
Abstract
Due to the rapid development of NGS technologies, a huge amount of NGS raw reads have been accumulated in public repositories, such as the Short Read Archive of NCBI. We successfully rescued the complete mitochondrial genome of Stegobium paniceum, a drug store beetle, from public NGS raw reads of truffle generated from the whole genome project. The circular mitogenome of S. paniceum is 15,474 bp long including 13 protein-coding genes, two ribosomal RNA genes, 22 transfer RNAs, and a single large non-coding region of 803 bp. Intraspecific transfer RNAs structure and sequence variations were investigated and simple sequence repeats identified from three S. paniceum mitochondrial genomes were compared showing their diversities as fundamental data to utilize them in various aspects including developing efficient molecular markers in the family, Ptinidae. Phylogenetic analysis of 23 Bostrichoidea mitochondrial genomes presented better species identification based on phylogenetic analyses and the optimal options for constructing phylogenetic trees based on Bostrichoidea mitochondrial genomes. Our results present not only utilization of public NGS raw read sequences but also intraspecific features of S. paniceum mitochondrial genomes and comparative analysis of Bostrichoidea mitochondrial genomes in various aspects.
Keywords
Introduction
Recent rapid development and utilization of next-generation sequencing (NGS) technologies have driven us to generate a large amount of NGS raw read sequences for various purposes,1–3 such as the sequencing of the whole genome,4–6 organelle genomes,7–9 and phylogenetic and phylogenomic studies.10,11 NGS raw read sequences can provide additional research opportunities because usually they cover almost all genomic DNA. For example, NGS raw reads from whole genomic DNA contains their organelle genome sequences, such as Rosa rugosa chloroplast 12 and mitochondrial 13 genomes, Vibunum amplificatum, V. dilatatum, 14 and Plantago ovata (Park et al. under review) chloroplast genomes and Monomorium pharaonis (Park et al. in preparation) and fourteen Pseudomyrmecinae mitochondrial genomes 15 were rescued from public SRA datasets generated for various purposes.11,16 In addition, organelle genomes of unexpected organisms were also retrieved, such as Rhopalosiphym mitochondrial genome 17 from the whole genome of Nymphaea colorata 18 and fungal mitochondrial genome of insect endosymbiont of Ricania speculum 19 and Sogatella furcifera. 20 These examples also imply that these datasets may have additional DNA sequence reads originated from endophytic or pathogenic species unintendedly once these organisms were included in DNA samples.
Stegobium paniceum, known as the drugstore beetle or the biscuit beetle is a worldwide pest of stored products. They have an extremely polyphagous diet including all sorts of organic matter starting from food ingredients such as flour, dry mixes, mushrooms, and spices to non-food materials such as paper, wool, leather, museum specimens, and even prescription drugs, where its common name was originated. Adult beetles can pierce through light packages and then can lay up to 75 eggs on the substrate 21 . The larval stage can vary from 4 to 20 weeks and is considered the most destructive stage as they bore tunnels in the food source. S. paniceum carries symbiotic yeasts, which produces nutrients such as vitamin B, compensating the poor nutrition uptake of the beetles. 22
Whole genome sequencing project of truffle, Tuber melanosporum, was published in 2010 with generating genome sequences from five individuals of truffle. 23 During assembling complete mitochondrial genome sequence of truffle, one insect mitochondrial genome was unexpectedly obtained from NGS raw reads of one individual of truffle (SRA accession: SRR5005499) which presents high similarity to that of S. paniceum. Considering with characteristics of S. paniceum, this insect might live inside the truffle and it was included unintendedly when DNA of this individual sample was prepared.
Based on obtained complete mitochondrial genome of S. paniceum together with already published mitochondrial genomes of S. paniceum, 24 identifications of intraspecific variations and SSRs among three mitochondrial genomes, nucleotide diversity analysis, configuration of 14 mitochondrial genomes of Anobiidae and Ptinidae, and phylogenetic analysis were conducted. Completion of our mitochondrial genome as a weak as diverse comparative analyses provides insights of characteristics of mitochondrial genomes in Anobiidae as well as a possibility of unexpected mitochondrial genomes which can be obtained from NGS raw reads publicly available.
Materials and methods
De novo assembly of the mitochondrial genome of S. paniceum from NGS raw reads of truffle
NGS raw reads of truffle (SRA accession: SRR5005499) were downloaded from NCBI and processed under the Genome Information System (GeIS, http://geis.infoboss.co.kr) which has been utilized in various genomics studies.7–9,13,14,17,19,20,25–83 SRR5005499 dataset used in this study contains 29,010,538 100-bp-reads (2,901,053,800 bp). In the pipeline, de novo assembly and confirmation were done by Velvet v1.2.10 84 with the options, minimum coverage is 80x and expected coverage is 100x, after filtering raw reads using Trimmomatic v0.33 with default option. 85 Gap-filling was conducted by GapCloser v1.12 86 with changing overlap parameters from 17 to 31 and assembled sequences were confirmed with BWA v0.7.17 with default alignment options 87 and the tview module of SAMtools v1.9. 88
Mitochondrial genome annotation
Geneious R11 v11.1.5 (Biomatters LSPANtd., Auckland, New Zealand) was used to annotate the mitochondrial genome of S. paniceum based on pairwise alignment with published S. paniceum mitochondrial genome. 24 ARWEN 89 was used for annotating tRNAs on the mitochondrial genome.
Drawing the circular map of the mitochondrial genome
The annotated GenBank format file of S. paniceum mitochondrial genome was used to draw the circular map using OGDRAW v1.3.1 with default options. 90
Prediction of tRNA structure
The annotated GenBank format file of S. paniceum mitochondrial genome was subjected to the MITOS web server with genetic code “05-invertebrate”, 87 and ARWEN web server with default option 89 for predicting tRNA structure. The prediction results were reviewed manually and draw final tRNA structure.
Calculation of codon usage
Codon usage was calculated based on gene annotations provided from NCBI database together with the pipelines of the revised insect mitochondrial genome database (Park et al. in preparation). Amino acids corresponding to codon sequence were investigated with a counting frequency of codons. After calculating all PCGs on the mitochondrial genome, statistics were generated in the environment of the revised insect mitochondrial genome database. The graph was drawn using Excel with adding codon labels.
Identification of intraspecific variations
Pair-wise sequence alignments among complete mitochondrial genomes of S. paniceum including the mitochondrial genome sequenced in this study were conducted by MAFFT v7.450 91 with the default option. Identifying intraspecific variations, SNPs and INDELs, on the mitochondrial genomes of S. paniceum was conducted using the function, ‘Find variations/SNPs,’ implemented in the Geneious R11 v11.1.5 (Biomatters Ltd, Auckland, New Zealand), which has been utilized in the previous insect mitochondrial genome studies.8,25,26,33,34,71–79,83 When the number of INDELs was calculated, continuous INDEL bases were considered one INDEL region.
Identification of simple sequence repeats on S. paniceum mitochondrial genomes
Simple sequence repeats (SSRs) were identified on the mitochondrial genome sequence using the pipeline of the SSRDB (http://ssrdb.infoboss.co.kr). Based on the conventional definition of SSR on organelle genomes: monoSSR (1 bp) to hexaSSR (6 bp) and total length of SSRs is above 10 bp. Because of different criteria of SSRs on organelle genomes,92–98 we adopted the criteria used in organelle genomes of Figulus binodulus, 62 Sogatella furcifera (Park et al. 99 ), endosymbiont of Sogatella furcifera, 20 Dysphania ambrosioides, 57 Arabidopsis thaliana, 68 Chenopodium album, 69 Rosa rugosa, 13 Plnatago (Park et al. under review), and Agrimonia species (Park et al. in submission): monoSSR (unit sequence length is 1 bp) to hexaSSR (6 bp) are used as normal SSRs and heptaSSR (7 bp) to decaSSR (10 bp) are defined as extended SSRs. Among normal SSRs, pentaSSRs and hexaSSRs of which unit number is 2 are classified as potential SSRs.
Comparison of simple sequence repeats among three S. paniceum mitochondrial genome
The SSRDB provides a comparison pipeline based on flanking sequences of identified SSRs named as ‘SSR Comparison History,’ which has been utilized in the previous studies.20,62,68,69 Because of the different coordination of mitochondrial genomes, nucleotide position is not an absolute criterion to identify SSRs found in the same region. This pipeline finds similar SSRs by selecting SSRs of which 500-bp flanking sequences of both sides of SSR are similar (sequence coverage is above 90% and sequence identity is above 90%). After selecting the candidates of similar SSRs, unit sequence and repeat number of SSRs are investigated to know whether sets of similar SSRs, called group SSRs, contain similar SSR or not.
Nucleotide diversity analysis including S. paniceum mitochondrial genomes
Nucleotide diversity was calculated based on the method proposed by Nei and Li 100 using the perl script based on two sets of multiple sequence alignments, which has been utilized in the previous studies.14,59,62,68–70,83 One is from four Ptinidae mitochondrial genomes including S. paniceum (MK947052), Gastrallus laevigatus (KX087292), Lasioderma redtenbacheri (KX087303), and Lasioderma serricorne (NC_038197) and the other is from eighteen mitochondrial genomes of superfamily Bostrichoidea (S. paniceum (MK947052), Gastrallus laevigatus (KX087292), Lasioderma redtenbacheri (KX087303), Lasioderma serricorne (NC_038197), Anthrenus verbasci (KX087239), Anthrenus verbasci (MG017450), Dermestes tessellatocollis (NC_044849), Dermestes maculatus (NC_037200), Dermestes frischii (NC_044850), Dermestes coarctatus (NC_044851), Nosodendron fasciculare (KX087322), Nosodendron sp. (KX035152), Anobiidae sp. (KT696225), Thorictus sp. (MK692678), Rhyzopertha dominica (NC_042820), Dinoderus minutus (KX087284), Bostrichoidea sp. (KX035220), and Apatides fortis (NC_013582)). Window size is 500 bp and step size is 200 bp for sliding-window method. Genomic coordination of each window was compared with gene annotation of mitochondrial genome.
Construction of phylogenetic trees
Twenty-three complete or partial mitochondrial genomes containing all 13 Protein-coding genes (PCGs) and 2 rRNA genes from superfamily Bostrichoidea were selected and retrieved from the NCBI. Together with the newly completed S. paniceum mitochondrial genome and an outgroup, Chaetosoma scaritides, four datasets were created: i) 13 PCGs with the third codon sites removed (called as dataset I), ii) 13 PCGs with all codon sites included (called as dataset II), iii) 13 PCGs with the third codon sites removed and 2 rRNA genes (called as dataset III), and iv) 13 PCGs with all codon sites and 2 rRNA genes (called as dataset IV). Codon-based alignments were individually made for each PCG using MAFFT provided on the Translator X web server with the default settings. 101 rRNA genes were also aligned using MAFFT 7.450. 91 Exclusion of the third codon sites and the concatenating of the aligned sequences were conducted under the environment of Geneious R11 v11.1.5. The maximum-likelihood (ML) trees were reconstructed in MEGA X. 102 During the ML analysis, a heuristic search was used with nearest-neighbor interchange (NNI) branch swapping, the Tamura-Nei model, and uniform rates among sites. All other options were set to their default values. Bootstrap analyses with 1000 pseudoreplicates were conducted with the same options. The posterior probability of each node was estimated using the Bayesian inference (BI) using MrBayes v3.2.6. 103 The GTR model with gamma rates was used as a molecular model. A Markov-chain Monte Carlo algorithm was employed for 1,000,000 generations, sampling trees every 200 generations, with four chains running simultaneously. Trees from the first 100,000 generations were discarded as burn-in.
Results and discussions
The complete mitochondrial genome of S. paniceum
From the public NGS raw reads of truffle, we rescued insect mitochondrial genome sequence when we tried to obtain truffle mitochondrial genome. After trimming 30 kb assembled sequences because the sequence was doubled due to circular form of the insect mitochondrial genome, we confirmed that it is from S. paniceum based on the similarity of COI sequence. 39,635 out of 29,010,538 100-bp-reads (0.13%) were used for S. paniceum mitochondrial genome sequences displaying 265x coverage.
Here, we present the complete mitochondrial genome of S. paniceum (GenBank accession: MK947052) of which length is 15,474 bp, containing 13 PGCs, 22 transfer RNAs (tRNAs), and 2 ribosomal RNAs (rRNAs; Figure 1; Table 1), which is the typical configuration of insect mitochondrial genomes. Its GC ratio is 21.9%, which is similar to that of S. paniceum complete mitochondrial genome (21.7%; NC_036678). 24 It is slightly higher than the three complete mitochondrial genomes of the Xyletininae family (Table 2). The order of PGCs on S. paniceum mitochondrial genome is the same as those of the Anobiidae family; while the tRNA order of mitochondrial genomes between Anobiidae and Xyletininae families are different: e.g., strand of tRNA-Gln (UUG) on S. paniceum mitochondrial genome is reversed in comparison to that of Lasioderma serricorne mitochondrial genome.

Complete mitochondrial genome sequence of S. paniceum. Grey graph inside circular diagram presents GC ratio of mitochondrial genome. Colourful bars on outer circular form indicate PCGs (yellow, pink, green, and purple), tRNAs (dark blue), and rRNAs.
Summary of S. paniceum mitochondrial genome.

*This column indicates the distance between two adjunct genes.
List of 28 available mitochondrial genomes from superfamily Bostrichoidea including S. paniceum completed in this study.

The length of tRNAs ranges from 62 bp to 70 bp (Table 1). From the predicted tRNA secondary structure, the length of the nucleotide-amino acid acceptor arm (AA arm) is 7 bp in 22 tRNAs and anticodon arm (AC arm) length is from 4 bp to 5 bp (Figure 2). Compared to AA and AC arms, the length of the dihydrouridine arm (D arm) and TΨC arm (T arm) are more variable, ranging from 2 bp to 5 bp. 102 All 22 tRNAs were shaped into a typical cloverleaf structure except tRNA-Ser (UCU) which lacks a D arm structure (Figure 2). Lack of D arm in tRNA-Ser on the mitochondrial genome is already a known phenomenon in many metazoan species. 111 On the other hand, tRNA-Val (UAC) on S. paniceum mitochondrial genome has a typical D arm structure, which is different from thrips mitochondrial genomes which miss D arm structure in tRNA-Val (UAC). 104 Twenty-four mismatches in 22 tRNAs were identified based on MITOS web server: eighteen out of twenty-four (75.00%) were G-U mismatch which can be explainable as G-U mismatch could make two hydrogen bonds and it has distinctive features and functions. 112 Four of twenty-four mismatches (16.67%) are U-U mismatches, one (4.17%) is U-C mismatch, and one (4.17%) is A-G mismatch. Predicted tRNA-Ser (UCU) structures from MITOS and ARWEN webserver display incongruent manner: there is C between U-A, and A-U bonds in AC arm in MITOS prediction (Figure 2); however, prediction structure from ARWEN showed two mismatches, A-A, and U-C in the same position of U-A and A-U bonds.

22 tRNA structure originated from S. paniceum mitochondrial genome. Structure of twenty-two tRNAs are presented with base pair of tRNAs. Names of tRNAs and anticodons are displayed on the right side under their structure. G-U mismatches (Wobble pairs) are coloured blue, and other mismatches were coloured red. Also, distinctive structure in Ser (UCU) is coloured red.
Codon usage of mitochondrial genomes of S. paniceum was analysed (Figure 3B). Based on the codon table of the invertebrate mitochondrial genome, there are two codons for methionine; however, two more codons, ATT (2 times) and TTG (1 time), were identified (see red colour codons in Figure 3B), caused by RNA editing events. It is different from that of Lasioderma serricorne (Coleoptera: Anobiidae) displaying the three exceptional codons: ATT, ATC, and TTG. 104 In addition, one of four codons for proline (CCG) and one of four codons for arginine (CGC) were not used in this mitochondrial genome (Figure 3B).

Codon usage of S. paniceum mitochondrial genome. (A) X-axis presents amino acids and Y-axis presents the number of amino acids along with the direction of genes ( + strand is blue colour and – strand is red colour) (B) Frequency of codons along with amino acids. Codons are displayed on the bars or around the bars with arrows. Red coloured codons indicate exceptional cases caused by an RNA editing event.
Identification and analysis of intraspecific variations on S. paniceum mitochondrial genomes
Intraspecific variations of insect mitochondrial genomes can be used for molecular markers to distinguish their origins in the level of populations113–118 or to identify cryptic species;119–121 however, these variations were not investigated intensively even though there are several complete or near-complete mitochondrial genomes of the specific species till now. To understand intraspecific characteristics of the mitochondrial genome of S. paniceum, one complete and one partial mitochondrial genome of S. paniceum (Table 2) were used for multiple sequence alignments to identify intraspecific variations. The genetic similarity among three S. panecium mitochondrial genomes is above 0.98 (Figure 4A), indicating three mitochondrial genomes are similar to each other.

Genetic distance and identified SNPs and INDELs among three S. paniceum mitochondrial genomes. (A) displays the table of genetic distances (left-down area) and number of SNPs and INDELs (right-up area) identified among three S. paniceum mitochondrial genomes. (B) Circular diagrams indicate three mitochondrial genomes of S. paniceum and boxes with an orange colour border mean genes containing synonymous SNPs and boxes with blue colour border indicate genes containing non-synonymous genes. Numbers of SNPs and INDELs are displayed around black arrows.
Eleven SNPs and 205 INDELs were identified between the mitochondrial genome in this study (GenBank accession: MK947052) and NC_036678 24 (Figure 4B). Three non-synonymous SNPs (nsSNPs) were found in ND4, ND1, and ND2 genes, respectively, and two synonymous SNPs (sSNPs) were found in ND2 and ND3 genes, respectively (Figure 4B). Interestingly, one INDEL was found in tRNA-Phe, which presents that three continuous cytosines on this mitochondrial genome; while four cytosines in NC_036678. The remaining SNPs and INDELs were in the 3′ of rRNA and putative control region. Twenty-two SNPs and 2 INDELs were identified between NC_036678 24 and the partial mitochondrial genome (GenBank accession: MH817140) which missed a part of 12S rRNA and control region (Figure 4B). Three nsSNPs were found in COX3, CYTB, and ND1, respectively, and ND4 and ND2 genes cover two nsSNPs each. Five sSNPs were found in COX2, ND3, ND5, ND1, and ND2 genes, respectively (Figure 4). One INDEL was also found in tRNA-Phe which is the same tRNA containing one INDEL in the previous comparison and one SNP was found in tRNA-Leu. The remaining SNPs and INDELs were in 16S and 5′ of 12S rRNAs. 14 SNPs without INDEL were found between MK947052 and MH817140 (Figure 4): four nsSNPs were in COX3, ND4, CYTB, and ND2 genes, respectively, three sSNPs were in COX2, ND5, and ND1 genes, respectively, and one SNP was found in tRNA-Leu (Figure 4B). Based on the small amount of sequence variations between two complete mitochondrial genomes of S. paniceum and partial mitochondrial genome (GenBank accession: MH817140), especially for INDELs, the control region of S. paniceum mitochondrial genomes may contain most sequence variations.
In tRNA, most of the tRNA sequences were consensus except tRNA-Leu (UAG), and tRNA-Phe (GAA). 6 Intraspecific variations identified on tRNAs did not affect tRNAs secondary structure such as stems or anticodon (Figure 5A and 5B). In detail, substitution occurs in D-loop (U into G; Figure 5A) of tRNA-Leu (UAG) and insertion occurs in the variable loop (G was inserted; Figure 5B) of tRNA-Phe. 6 These intraspecific variations of tRNAs indicate that sequence variations can occur on tRNAs but they will not affect their secondary structure because of their essential function in the mitochondrion.

Intraspecific variations of tRNAs in S. paniceum mitochondrial genomes. Variation of tRNAs are indicated as red circles. Also wobble pair is coloured blue and other mismatches coloured red. (A) Substitution of tRNA-Leu (UAG) in D-loop. (B) Insertion of tRNA-Phe in variable loop.
The number of sequence variations (11 SNPs and 205 INDELs) identified between S. paniceum complete mitochondrial genomes is similar or less level to those of Spodoptera frugiperda (275 SNPs and 43 INDELs between MN385596 and NC_027836, 351 SNPs and 49 INDELs between MN385596 and KU877172, 247 SNPs and 74 INDELs between MN385596 and KJ778892) 8 , Laodelphax striatellus (141 SNPs and 166 INDELs between MK862265 and NC_013706, 41 SNPs and 118 INDELs between MK862265 and JX880068), 37 and Chilo suppressalis (85 SNPs and 199 INDELs between MK207057 and NC_015612, 360 SNPs and 124 INDELs between MK207057 and HQ860290, and 836 SNPs and 243 INDELs between HQ860290 and NC_015612). 35 It is higher than those of Nilaparvata lugens (90 SNPs and 10 INDELs between MK606371 and MK590088 25 and 112 SNPs and 59 INDELs between MK590088 and NC_021748), 33 Aphis gossypii (61 SNPs and 3 INDELs between MN102349 and NC_024581, 34 66 SNPs and 176 INDELs between MT430940 and NC_024581, and 11 SNPs and 173 INDELs between MT430940 and MN943499 71 ), Hipparchia autonoe (19 SNPs), 26 Monomorium pharaonis (12 SNPs; Park et al. in preparation), and Laodelphax striatellus between MK838101 and MK862265 which were captured in Korea (only one SNP). 37 Considering with different origins of the samples and species-specific characteristics of each insect species of which intraspecific variations were investigated, the amount of intraspecific variations of S. paniceum mitochondrial genomes is enough to be utilized for distinguishing their origin; however, more mitochondrial genomes will be needed to establish stable molecular markers. Because of the utilization of the control region on mitochondrial genome, 122 many intraspecific variations identified on S. paniceum mitochondrial genomes can be also utilized as molecular markers.
Comparative analyses of 28 mitochondrial genomes of superfamily bostrichoidea
GC ratio, GC-skew, AT ratio, and AT-skew values of 28 Bostrichoidea mitochondrial genomes were calculated based on their mitochondrial genomes (Table 2) and plotted in the two graphs (Figure 6A and 6B). Three mitochondrial genomes of S. paniceum display similar characteristics as we expected because of the small number of intraspecific variations in comparison to those of inter-specific variations (Figure 6). In addition, one partial mitochondrial genome (GenBank accession: MH817140) is placed away from the other two complete mitochondrial genomes (See star marks in circles labelled as S. paniceum) because part of control region sequences was missed (Figure 6).

At ratio vs AT skew and GC ratio vs GC skew in 14 Anobiidae and Ptinidae mitochondrial genomes. (A) X-axis present GC ratio and Y-axis show GC-skew. (B) X-axis presents AT ratio and Y-axis shows AT-skew. Coloured circles indicate complete or partial mitochondrial genomes. Red circle indicates three S. paniceum including this study. Stars on coloured circles mean partial mitochondrial genome.
Subfamilies Xyletininae, and Dermestinae were well clustered from the remaining subfamilies (Figure 6A and 6B) which can be caused by their narrow taxonomical range: mitochondrial genomes from both families are in one genus. Interestingly, three S. paniceum (family Anobiinae) mitochondrial genomes were clustered, while Gastrallus laevigatus (family Anobiinae) is away from them (Figure 6), indicating that taxonomic distance is reflected in these plots. Anobiidae sp. (GenBank accession: KT696225) was far from those of superfamily Bostrichoidea in GC Skew plot (Figure 6B), which is congruent to the constructed phylogenetic tree that Anobiidae sp. is basal species in comparison to the other species. Taken together, GC ratio/GC skew and AT ratio/AT skew plots can be used as another barometer to measure their taxonomical distances beside phylogenetic trees.
Configuration of 28 mitochondrial genomes of Bostrichoidea
Based on multiple sequence alignment of available 28 mitochondrial genomes including three S. paniceum mitochondrial genomes assembled in this study, all 28 mitochondrial genomes present the same gene order (Figure 7A). Three S. paniceum mitochondrial genomes display the same gene order. In addition, all 28 mitochondrial genomes have the same gene order including PCGs, tRNAs, and rRNAs (Figure 7A). In addition, control regions of 16 complete mitochondrial genomes display low conserveness in comparison to the rest regions (Figure 7A), which is a similar trend to the other insect mitochondrial genomes,7,29–32,36 so that further analysis is required.

Genome configuration of 22 Bostrichoidea mitochondrial genomes. (A) displays multiple sequence alignment of 22 Bostrichoidea complete or partial mitochondrial genomes. NCBI accessions of mitochondrial genome are displayed on the left side. Bolded accession indicates mitochondrial genome of S. paniceum assembled in this study. Black dotted box indicates the control region of mitochondrial genomes used in the multiple sequence alignment. (B) presents multiple sequence alignment of control region sequences extracted from sixteen mitochondrial genomes of which the control regions are available.
Control region, which is the most variable region in the mitochondrial genome 123 and covers displacement loop (D-loop) region comprising a third strand of DNA creating a semi-stable structure,122,124 of the 16 complete mitochondrial genomes were collected and aligned to measure its conserveness (Figure 7B). As we mentioned above, most of the intraspecific variations of S. paniceum mitochondrial genomes were found in the control region, reflecting that the control region is the most variable region on the mitochondrial genome. Nucleotide diversity of control region including D-loop region was calculated, resulting 0.2131 which is higher than nucleotide diversity of conserved regions covering 13 protein-coding genes, 2 ribosomal RNAs, and 13 transfer RNAs (0.08368 in family Ptinidae and 0.1287 in superfamily Bostrichoidea; see the section, Nucleotide diversity of Bostrichoidea mitochondrial genomes). Nucleotide diversity of the control region is also higher than those of other insect species, such as tribe Figulini (0.1331) 62 and family Thripidae (0.1329; Seo et al. in preparation).
Simple sequence repeat analysis of S. paniceum mitochondrial genomes
Simple sequence repeat (SSR) was investigated on S. paniceum mitochondrial genomes using the pipeline of the SSR database (See Material and methods section). In total, 90 SSRs were identified (Table 3): Number of pentaSSRs is the largest (35 SSRs; 38.89%) and that of hexaSSR is the second largest (28 SSRs; 31.11%); while there are only one triSSR (1.11%), one octaSSR (1.11%), three heptaSSRs (3.33%) and four monoSSRs (4.44%; Figure 8A). This trend is similar to that of F. binodulus 62 even though the total number of SSRs of S. paniceum is almost two times than that of F. binodulus (50 SSRs); while it is different from that of Monomorium pharaonis (99 SSRs and 101 SSRs from that of USA and Korean isolates; Park et al. in preparation).

Distribution of simple sequence repeats of S. paniceum mitochondrial genome. (A) X axis presents SSR types and Y axis indicates number of SSRs for each type. Three colours, blue, orange, and grey, indicate mitogenomes of this study (GenBank accession: MK947052), NC_036678, and MH817140 (partial genome), respectively. The numbers on the bars indicates the number of SSRs. (B) The pie graph displays the number of SSR groups and the transparent blue area indicates that singleton SSRs consist of three origins of SSRs displayed in (C).
List of SSRs identified from S. paniceum mitochondrial genomes.

With the same pipeline, SSRs of two mitochondrial genomes were identified: 89 and 70 SSRs were found from NC_036678 and MH817140, respectively (Figure 8A). The number of SSRs identified from MH817140 is less than those of the rest two mitochondrial genomes because MH817140 mitogenome is shorter than the rest two mitogenomes missing part of 12S rRNA and control region. The overall trend of the number of SSRs along with ten types in three mitochondrial genomes is similar to each other (Figure 8A).
Comparison of simple sequence repeats among three S. paniceum mitochondrial genome
To understand the diversity of SSRs identified from the three mitochondrial genomes of S. paniceum, we grouped all 249 SSRs using the pipeline of the SSRDB (See Materials and Methods). In total, 65 SSR groups originating from three mitochondrial genomes (195 SSRs; 78.31%) were identified; while 11 partial SSR groups (22 SSRs; 8.84%) containing SSRs from the two mitochondrial genomes and 32 singleton SSRs (32 SSRs; 12.85%) were found (Figure 8B). Because of MH817140 partial mitochondrial genome, all 11 partial SSR groups contain SSRs only from NC_036678 and MK947052. Taken together, 32 singletons SSRs indicate SSR variations among three mitochondrial genomes. They cover five SSRs originating from MH817140 partial mitochondrial genome, 13 SSRs from NC_036678 and 14 SSRs from MK947052 (this study; Figure 8C). This diversity of SSRs can also be utilized to distinct its origin or populations like SNPs and INDELs on the mitochondrial genomes.
Nucleotide diversity analysis of Bostrichoidea mitochondrial genomes
To understand nucleotide diversity along with mitochondrial genome sequences, we calculated nucleotide diversity based on the two datasets: one consists of four mitochondrial genomes of Ptinidae species and the other covers eighteen species including the four Ptinidae species without species redundancy. The average nucleotide diversity of the first dataset is 0.08368 (Figure 9A), which is lower than those of tribe Figulini (0.1331) 62 and family Thripidae (0.1329; Seo et al. in preparation) but is higher than that of Aphididae (0.0432; Lee et al. in preparation). Considering with low taxonomic coverage of the four species, it can be larger than now once additional mitochondrial genomes in this family are available. Nucleotide diversity of the second dataset displays a similar trend to that of the first dataset (Figure 9B); however, average nucleotide diversity is 0.1287, larger than that of the first dataset because its taxonomical coverage is increased in comparison to the first dataset.
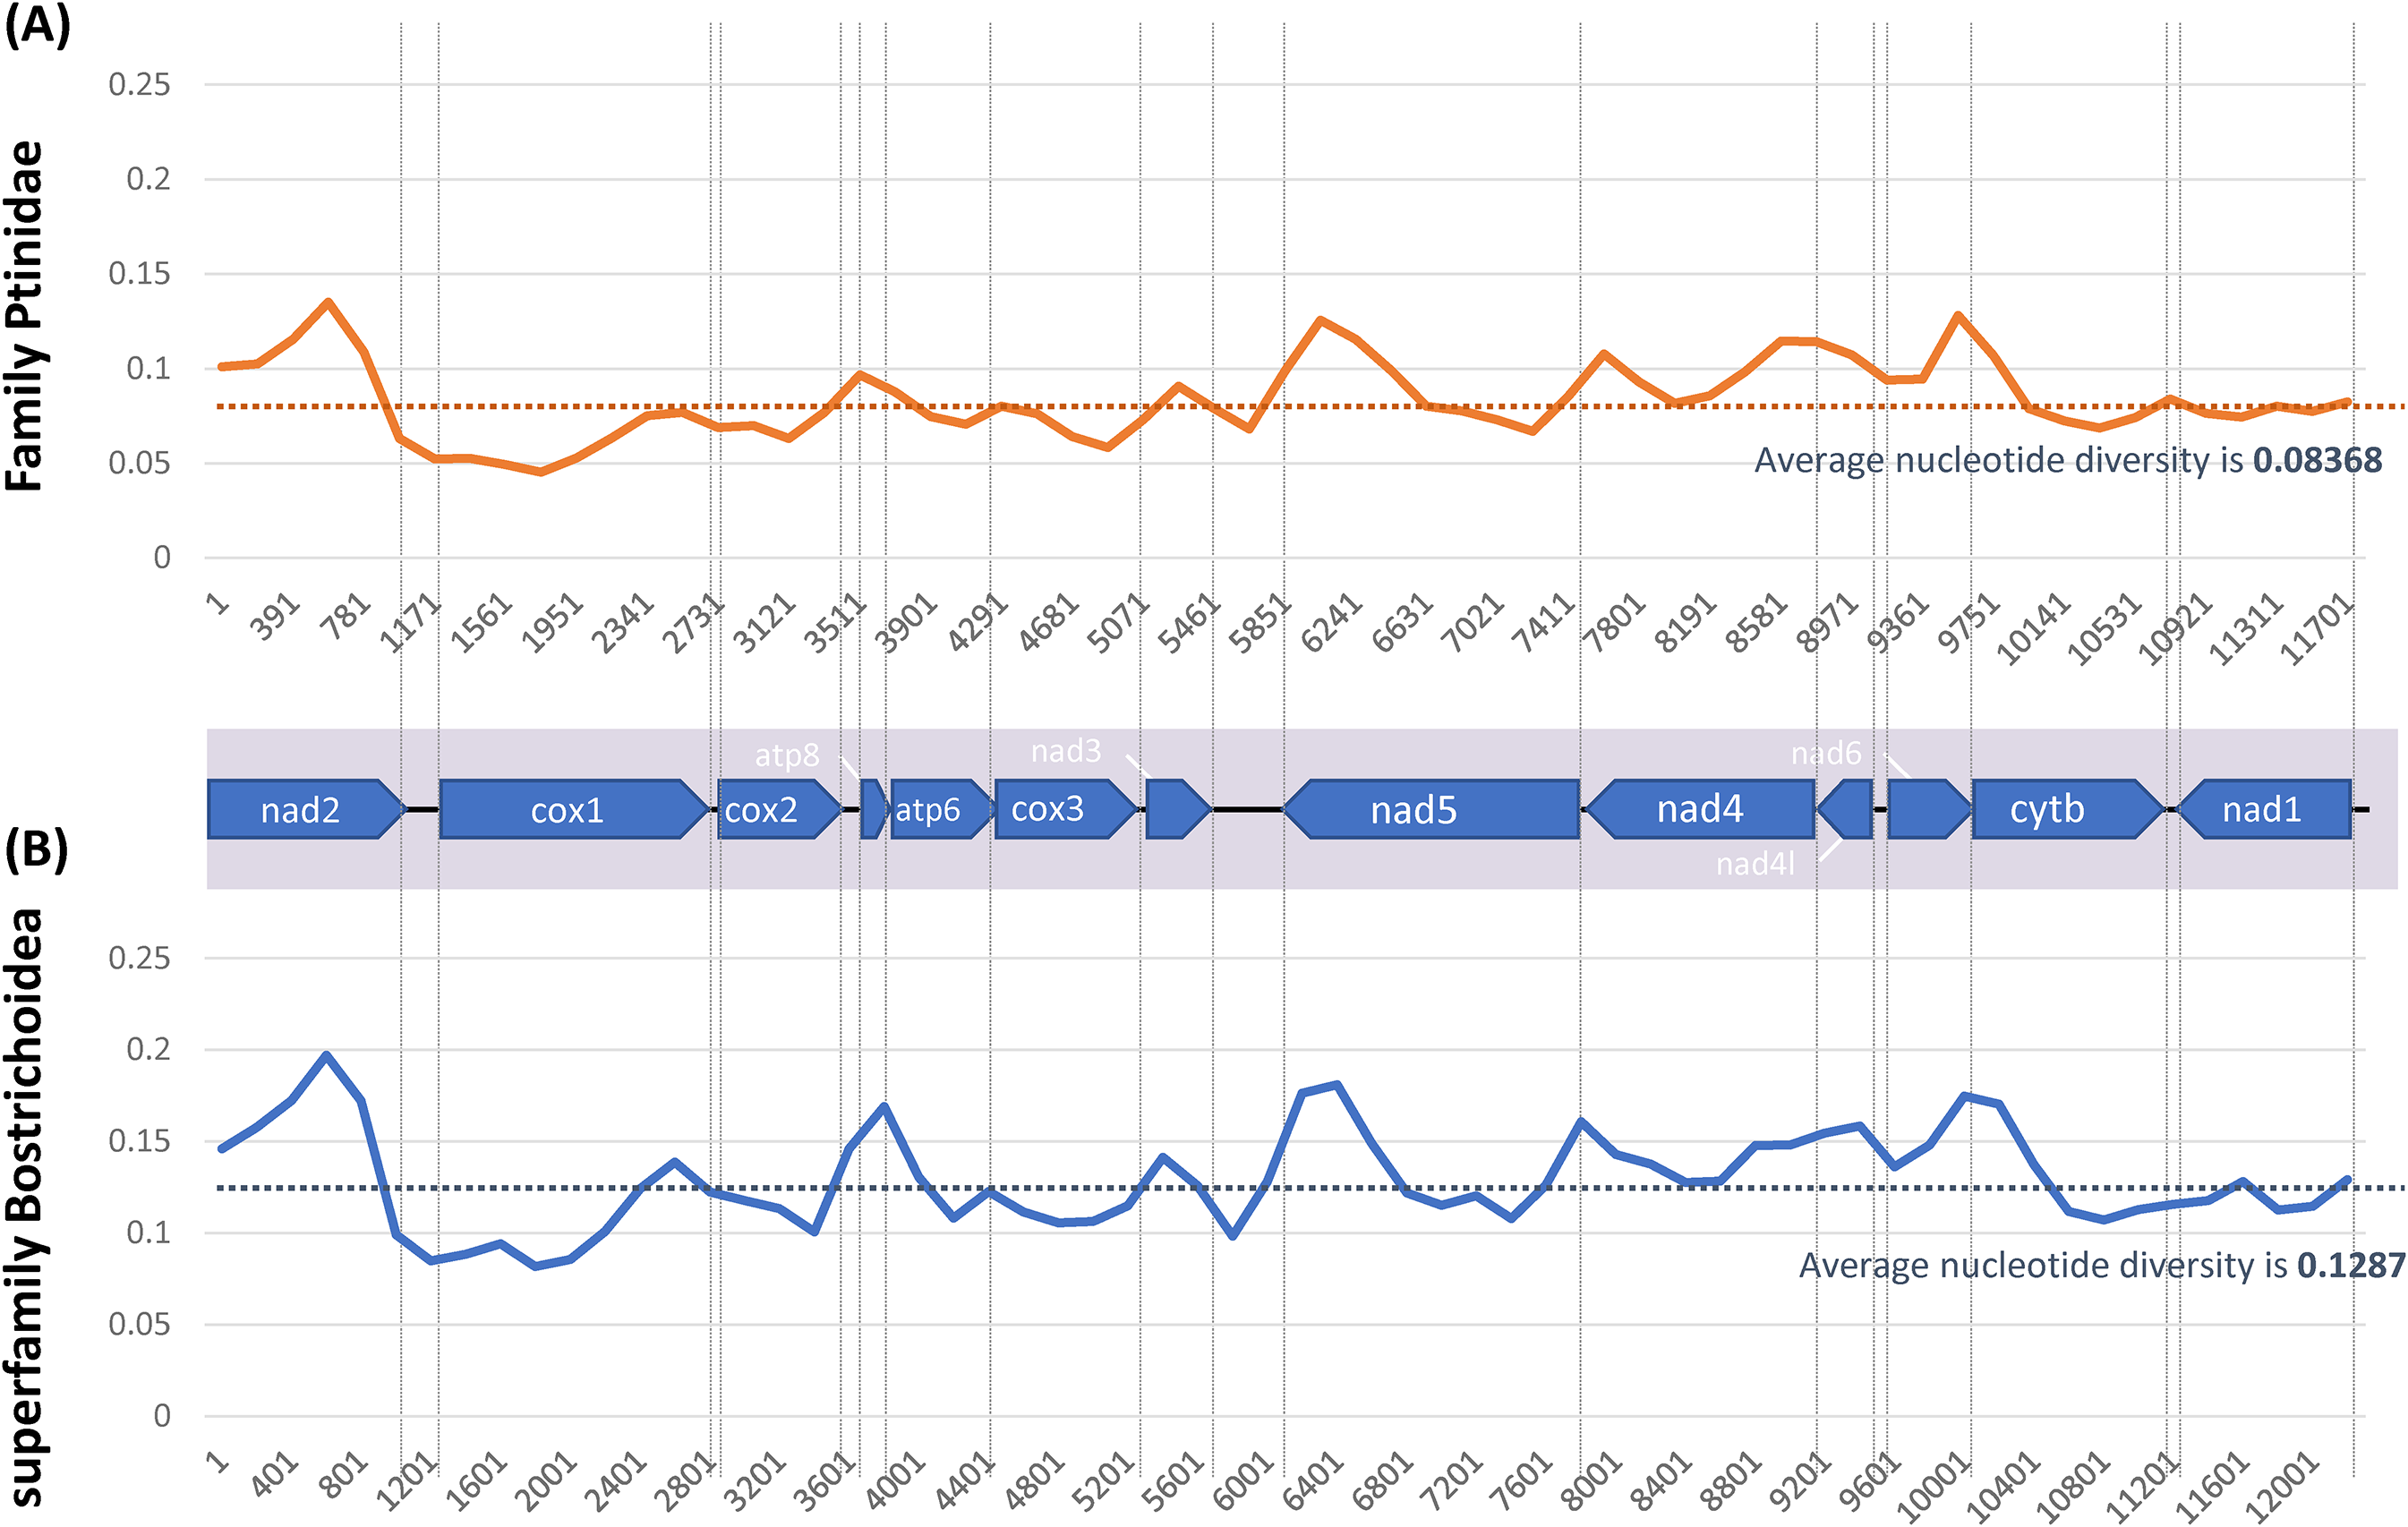
Nucleotide diversity plots of Ptinidae family and Bostrichoidea superfamily mitochondrial genomes. (A) displays nucleotide diversity plot using four mitochondrial genomes of Ptinidae family and (B) shows nucleotide diversity plot using eighteen mitochondrial genomes of Bostrichoidea superfamily. In both panels, X-axis indicates start position of sliding window (500 bp) used for calculating nucleotide diversity. Y-axis shows nucleotide diversity value (Pi value). Blue line means nucleotide diversity of each window and yellow dotted line is average nucleotide diversity value. Grey dotted lines show boundary of 13 PCGs displayed on the bottom of graph.
Most of PCGs display similar trend in both nucleotide plots except NAD1 which shows variations of nucleotide diversity inside NAD1 gene in superfamily Bostrichoidea is larger than that of Ptinidae family (Figure 9). It reflects that some of the four families including Ptinidae may have a different trend of nucleotide diversity in the NAD1 gene. In addition, CYTB and NAD1 genes present lowest nucleotide diversity among all 13 PCGs in both plots; while ATP8 and NAD5 genes show the highest in both plots (Figure 9), which is different from those of Tribe Figulini presenting NAD6 and ATP8 genes are the highest 62 and 88 Laodelphax striatellus mitochondrial genomes showing that ATP8 and CYTB genes are the highest. 28 From these results, ATP8 gene presents the highest nucleotide diversity as same as previous studies.105,106
Nucleotide diversity of COX1 gene display gradually increase from N-terminal to C-terminal in both plots (Figure 9); while NAD4, NAD5, and COX3 genes present decrease from N-terminal and then increase toward C-terminal (Figure 9), indicating that this trend of nucleotide diversity inside the gene can also be considered for developing efficient molecular markers for diverse purposes, e.g. N-terminal of COX1 gene will show better resolution of species identification in superfamily Bostrichoidea.
Phylogenetic interpretation of superfamily Bostrichoidea species based on available 23 mitochondrial genomes
Bootstrapped phylogenetic trees of 23 mitochondrial genomes of superfamily Bostrichoidea were constructed with various options (See Materials and Methods). Overall, the topology of each tree was congruent to each other (Figure 10 and Supplementary Figures S1 to S8), especially in the BI trees (Supplementary Figures S1 to S4) where only a single topology difference was found in the tree of the dataset I in the placement of genus Stegobium. ML trees showed a bit more disagreements in the topologies, particularly in the tree of the dataset I.

Phylogenetic trees of 23 mitochondrial genomes of superfamily Bostrichoidea. Bayesian inference (1,000,000 generations) and the maximum likelihood (bootstrap repeat: 10,000) phylogenetic trees of 23 mitochondrial genomes from superfamily Bostrichoidea and an outgroup. Subfamily and family names are displayed on the vertical bars on the right side. Support values are shown in the following order: BI-i/BI-ii/BI-iii/BI-iv/ML-i/ML-ii/ML-iii/ML-iv. The figured tree was based on BI-iv tree and branches not supported in other trees were shown by ‘-’. High values of 1 in BI trees and 95 or over in ML trees are depicted with an asterisk (*).
All four species of family Ptinidae including S. paiceum were clustered into a single clade (Figure 10). Subfamily Anobiinae of Ptinidae however was only supported in trees generated with dataset I and was paraphyletic in other six trees with Stegobium grouping with Lasioderma of subfamily Xyletininae. The partial mitogenome, KT696225, was identified as “Anobiidae sp.”, a junior synonym of family Ptinidae, however, did not cluster with the other Ptinid species. Instead, it clustered with genus Nosodendron of family Nosodendridae and the branch was found in seven of the eight trees (Figure 10).
Three species each representing a separate genus of Bostrichidae were well clustered in all eight trees. KX087284 identified as “Bostrichoidea sp.” and Apatides of subfamily Bostrichinae were clustered with highly supported in all eight trees (Figure 10) implying that KX087284 is likely from a member of the subfamily, based on the branch length compared to the other subfamily Dinoderinae. The whole clade of Bostrichidae was sister to Ptinidae except for ML trees using datasets II and IV which are the sets including untrimmed PCG sequences.
Two sequences of Dermestes maculatus were used in the phylogenetic analysis however, the two did not cluster into a single branch as in the three sequences of S. paniceum or L. serricorne. Instead, MN900863 formed a single clade together with D. tessellatocollis. We have compared the sequence with multiple COX1 sequences of the two species retrieved from NCBI and confirmed MN900863 is likely a misidentification of D. tessellatocollis. Anthrenus verbasci also had two mitochondrial genome sequences, however, the two genomes showed separate branches as in the former examples. Further analysis on the COX1 region, we found MG017450 mitochondrial genome was identical to that of A. unicolor japonicus. Two sequences of Nosodendron of Nosodendridae, a family sometimes considered a member of the neighbouring superfamily Derodontoidea, was nested within Dermestidae in ML tree of dataset I but was not supported elsewhere.
Taken together, our phylogenetic analyses including S. paniceum present that this approach can provide better species identification of unidentified mitochondrial genomes. Moreover, maximum likelihood phylogenetic trees with dataset I displays incongruent or low supportive values of phylogenetic tree (Figure 10), indicating that topology of phylogenetic tree with this option can be considered as relatively low confident phylogenetic tree. Further in-depth analysis for understanding this phenomenon should be required in near future using more up-coming mitochondrial genomes in this superfamily.
Supplemental Material
sj-pptx-1-sci-10.1177_00368504211072355 - Supplemental material for The investigation of intraspecific characteristics and comparative analyses of the complete mitochondrial genome of Stegobium paniceum (Linnaeus, 1758) (Coleoptera: Ptinidae) assembled from public NGS raw reads of the black truffle, Tuber melanosporum
Supplemental material, sj-pptx-1-sci-10.1177_00368504211072355 for The investigation of intraspecific characteristics and comparative analyses of the complete mitochondrial genome of Stegobium paniceum (Linnaeus, 1758) (Coleoptera: Ptinidae) assembled from public NGS raw reads of the black truffle, Tuber melanosporum by Jongsun Park, Jungmo Lee and Jonghyun Park in Science Progress
Footnotes
Acknowledgements
This study was carried out with the support of the two grants: InfoBoss Research Grant (IBI-0004) and “Cooperative Research Program for Agriculture Science & Technology Development (Project No. PJ013389052019)”, Rural Development Administration, Republic of Korea.
Declaration of conflicting interests
The author(s) declared no potential conflicts of interest with respect to the research, authorship, and/or publication of this article.
Supplemental material
Supplemental material for this article is available online.
Author biographies
Jongsun Park PhD is the co-CEO and CTO in Infoboss Inc. His research interest is bioinformatics, genomics, phylogenetics, plant systematics, entomology, biodiversity, and machine learning/deep learning for analyzing heterogenous Bio-BigData.
Jungmo Lee is a researcher who is interested in entomology.
Jonghyun Park is a researcher who is interested in ants.
References
Supplementary Material
Please find the following supplemental material available below.
For Open Access articles published under a Creative Commons License, all supplemental material carries the same license as the article it is associated with.
For non-Open Access articles published, all supplemental material carries a non-exclusive license, and permission requests for re-use of supplemental material or any part of supplemental material shall be sent directly to the copyright owner as specified in the copyright notice associated with the article.