
Abstract
Introduction:
Although forecasting electric vehicles’ growth in China was frequently reported in the literature, predicting electric vehicles market penetration as well as corresponding energy saving and carbon dioxide mitigation potential in a more suitable method is not well understood.
Methods:
This study chose the double species model to predict electric vehicles’ growth trajectory under mutually competitive conditions between electric vehicles and internal combustion engine vehicles. For comparison, it set two scenarios: with 200 and 300 vehicles per thousand persons at 2050. To give details on energy saving and carbon dioxide mitigation potential induced by electric vehicles’ market penetration, it further divided electric vehicles into five subgroups and internal combustion engine vehicles into seven subgroups, therein forming respective measurement formulas.
Results:
This paper solved the double species model and thus got its analytical formula. Then it employed the analytical formula to conduct an empirical study on electric vehicles market penetration in China from year 2010 to 2050. Under scenario 300, electric vehicles growth trajectory will emerge a quick growth stage during 2021–2035, thereafter keeping near invariant till 2050. Meanwhile, current internal combustion engine vehicles’ quick growth will continue up to 2027, then holding constant during 2028–2040, afterwards following a 10-year slowdown period. Scenario 200 has similar features, but a 2-year delay for electric vehicles and a 5-year lead time for internal combustion engine vehicles were found. On average, scenario 300 will save 114.4 Mt oil and 111.5 Mt carbon dioxide emissions, and scenario 200 will save 77.1 Mt oil and 73.4 Mt carbon dioxide emissions each year. Beyond 2032, annual 50.0% of road transport consumed oil and 18.6% of carbon dioxide emissions from this sector will be saved under scenario 300.
Discussion:
Compared with scenario 200, scenario 300 was more suitable to predict electric vehicle market penetration in China. In the short-term electric vehicle penetration only brings about trivial effects, while in the long-term it will contribute a lot to both energy security and carbon dioxide mitigation. The contribution of this article provided a more suitable methodology for predicting electric vehicle market penetration, simulated two coupled trajectories of electric vehicles and internal combustion engine vehicles, and discussed relative energy-saving and climate effects from 2010 to 2050.
Keywords
Introduction
With climate change and energy security being growing concerns, the development of electric vehicles (EVs) has taken on an accelerated pace worldwide.1,2 Major countries including Norway, France, Ireland, Spain, United Kingdom, Belgium, Japan, the United States, Canada, China, and India, have announced strong financial incentives for EV development.3–5 In China, the government holds that EVs have the potential to solve a number of challenges related to automobile use, such as tailpipe emissions, energy supply security, and high oil prices.6,7
In 2010, China announced a program to provide incentives up to USD 8785 for the private purchase of battery electric vehicles (BEVs) in cities of Shanghai, Shenzhen, Hangzhou, Hefei, and Changchun. The subsidy would be reduced once 50,000 units were sold. Later, the government implemented the “ten cities & thousand units” program to further promote EVs’ deployment. By 2012, this “stage-2 EVs demonstration program” had extended to 25 cities. According to the Energy-saving and New Energy Automotive Industry Development Plan (2012–2020) issued by the State Council, EV stock would reach 5 million units by 2020. Another policy carried out from 2014 set a target of over 30% EV sales in public service area, including electric buses, electric taxis, electric logistic, and sanitation vehicles. At the end of 2016, China Society of Automotive Engineers (SAE-China) released the Technology Roadmap for Energy-saving and New Energy Vehicles, which suggested EV sales proportion would be 7%–10%, 15%–20%, and 40%–50% in 2020, 2025, and 2030, respectively. 8 This goal was further accentuated by the Medium-long Term Development Plan of Automotive Industry released by the government in 2017. 9
With such strong incentives to promote EV development nationwide, 2018 saw EV sales over 1 million units, meaning 212-fold of sales in 2011. 5 Under this stimulating background, employing more suitable methodology to predict EV market penetration became a big concern, not only for the government, automakers, and consumers, but also for power generators, environmentalists, and other stakeholders. Situating on literature reviews, this article introduced the double species model to predict EV market penetration. Employing the model’s analytical formula, it further conducted an empirical study on China EV market penetration, corresponding energy-saving and carbon dioxide (CO2) mitigation effect.
Methods
Methods choice
In the literature of other scholars, many methods have been utilized to estimate vehicle stock. He 10 applied an elasticity approach to predict vehicle stock in China from 1997 to 2030. Based on market allocation (MARKet ALlocation, MARKAL) model, Timur et al. 11 explored the prospects of alternative fuels in the global transportation sector. Designing an interactive human–machine integrated system, Liu and Zhang 12 predicted passenger vehicles development in China. Besides these methods, the S-shaped curve family was widely employed to predict vehicles growth. For example, Button et al. 13 adopted the modified logistic curve to simulate vehicle stock in low-income countries. Employing the Gompertz curve, Zachariadis et al. 14 simulated vehicle growth as well as tailpipe emissions in Greece, while Wu et al. 15 predicted light duty vehicle development in China from 2015 to 2030. In their literature, Chai et al. 16 Willern and Cooper, 17 Jong et al. 18 Kobos et al. 19 Wang and He, 20 Dargay and Gately, 21 Ingram and Liu, 22 etc. also chose the S-shaped curve family to conduct vehicle-related research. The advantage of the S-shaped curve is that it may catch the life-cycle essence of most economic phenomenon: with a slow growth rate at introduction stage, a quick growth rate at booming stage, and again a slow growth rate near saturation point.
To explore how alternative fuel vehicle (AFV) penetration would affect the demand for conventional internal combustion engine vehicle (ICEVs) in South Korea, Ahn et al. 23 introduced a conjoint analysis approach. Based on this method, Weinert et al. 24 examined EVs’ industrial evolution in China. They suggested that the balance of driving- and resisting-forces appear to favor EV development in the long term. In a conjoint analysis, levels of attributes describing a product are combined to build descriptions of the alternatives. 25
The double species growth model, proposed by Lotka 26 and Volterra, 27 has characteristics of both conjoint analysis and S-shaped family.28,29 It may catch the intrinsic features of EV market penetration: (a) both EV and ICEV development are mutually affected (interactive influence feature) and (b) from the introduction stage to the ultimate saturation level, the EV industry will have an S-shaped growth trajectory (product life-cycle growth feature).
The double species model26,27 can be written as
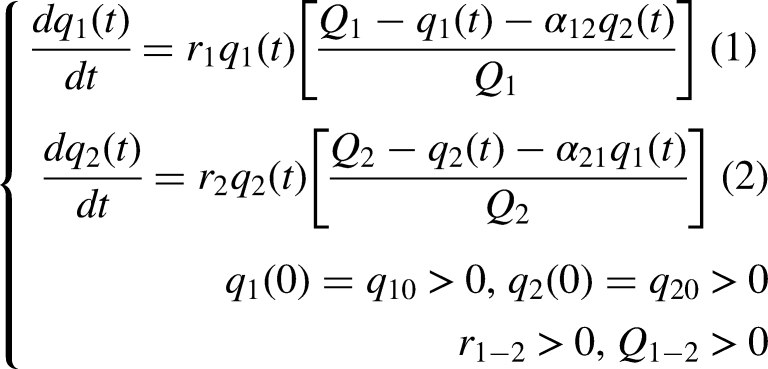
In the double species model, if each species develops independently, both competitive coefficients would be zero. So equations (1) and (2) are simplified as

Model solution
Equations (1) and (2) are nonlinear ordinary differential equations, for which it is difficult to obtain analytical formula. Almost all the literature on this model was focused on fields of equilibrium analysis, equilibrium feature, computer simulation, and stochastic and time delay analysis.30–33 As far as we know, it has not yet been solved analytically. Here we apply the Bernoulli equation method to solve equations (1) and (2).
Rewrite equation (1) as


Empirical study
Model calibration
Section 3 conducts an empirical study on EV market penetration and corresponding energy-saving and CO2 mitigation effect in China. For convenience, let’s denote ICEVs and EVs as species 1 and species 2, respectively. In this study,


In line with Liu et al.
7
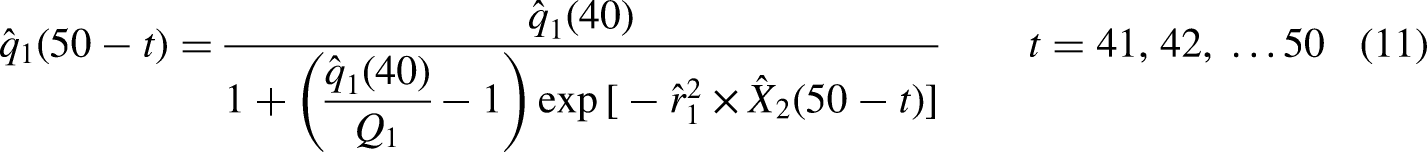
ICEV stock would peak at 2040, thereafter gradually slow down. As this peak point was also in accordance with the Medium-long Term Development Plan of Automotive Industry released by the government in 2017, we took ICEV stock peaking at 2040 as a boundary condition. To catch the negative growth phenomenon during 2041–2050, we inverted ICEVs’ S-curve in a way that kept the intrinsic growth rate unchanged and only substituted the form factor with
Measurement of energy saving and Co2 mitigation effects
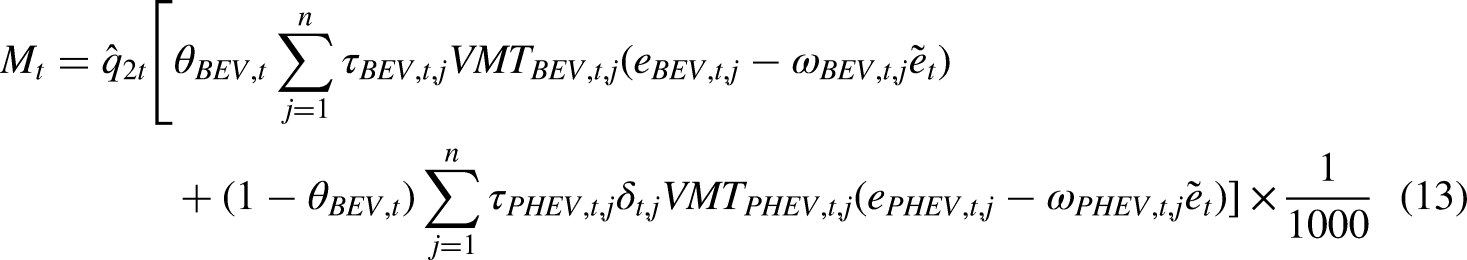
Vehicle activity level, measured by annual vehicle mileage travelled (VMT), is required to evaluate EVs oil saving effect. Considering different types of vehicle have different VMT records,
34
the annual oil-saving effect can be calculated as

Correspondingly, the annual CO2 mitigation effect is measured by
Data process
Since fuel cell electric vehicles (FCEVs) make up a very small proportion, 8 this article neglects it and divides EVs into BEVs and PHEVs. Data on EV stock during 2010–2018 is collected from the International Energy Agency (IEA) report.1,3–5 On average, the proportion between BEVs and PHEVs is 75.5% and 24.5% each year. We assume this proportion will stay unchangeable up to 2050. ICEVs contain the above seven types and their respective stock data during 1990–2018 are collected from China Association of Automobile Manufacturers (CAAM), SAE China, and National Bureau of Statistics.
Total vehicle stock at 2050 is determined by human population and vehicle stock per thousand persons. Zhou et al. 36 predicted that Chinese human population at 2050 would be 1300 million. Later, United Nations 37 updated this prediction to 1450 million at 2050. Considering the huge population, finite road construction, low Disposable Personal Income (DPI) as well as rapid development of public transportation, we use United Nations’ data and set two scenarios: with vehicle stock saturated at 2050 being 200 vehicles (scenario 200) and 300 vehicles (scenario 300) per thousand persons. note 1 Referring to the Technology Roadmap for Energy-saving and New Energy Vehicles,7,8 we assume that EVs and ICEVs will respectively share 60% and 40% of total vehicle stock in 2050. 9
In line with CAAM, 38 EV penetration mainly concentrates on cars, light duty buses and light duty trucks in the near future. We assume that no other EV type is operated before 2030 and the proportion of existing EV types is in accordance with respective average share during 2010–2018. Beyond 2030, BEVs will gradually penetrate to medium duty bus fleet and medium duty truck fleet; therein their respective share is adjusted correspondingly. 7
In 2010, the fuel economy of cars, light duty buses and light duty trucks was 6.9, 7.8 and 8.0 L/100 km, respectively. Recommended by the Technology Roadmap for Energy-saving and New Energy Vehicles, 8 the fuel economy of cars will reach 5, 4, and 3.2 L/100 km in 2020, 2025, and 2030. Meanwhile, other vehicle types will enhance fuel economy by 10%, 15% and 20% in the same time horizon. Concerning further improvement in fuel economy will be very finite, this article fixes it at 2030 level in the following years.
Hou et al. 34 and Zhang et al. 39 provided annual VMT data for cars, light duty buses, and light duty trucks at 2000, 2015, 2030, and 2050. This article supplements VMT during 2010–2050 by assuming that there is a geometric series for data of each type. In addition, the ratio of VMT powered by electricity for PHEVs is set as 76.0%. 40
To measure EV CO2 mitigation effect, emission intensity is required. Investigation showed us that cars, light duty buses, medium duty buses, light duty trucks, and medium duty trucks each emitted 190.2, 194.5, 208.0, 239.4, and 252.7 gCO2/km in 2010. This factor is updated in line with the above fuel economy improvement during 2010–2050. Measurement to CO2 mitigation effect still needs to subtract those emissions from electricity production. In 2012, the National Development and Reform Commission (NDRC) released the electricity emission factor of 31 provincial grids. By weighted average calculation, the factor is 659.03 gCO2/KWh for the national grid. Since the government has committed that renewable energy will take 15%, 20%, and 40% at 2020, 2030, and 2050, 41 emission factor is adjusted in accordance with this regulation.
In recent years, most sold EVs in China were BYD.E5, BYD.Song, Beijing Auto EC 180, Geely ZhiDou D2, Chery eQ, and SAIC Rowe 550 PHEV/E550, etc. In 2015, the BYD series took 49.67% EV market share. Concerning electricity consumption rate, its weighted average value was 0.215 KWh/km. We choose electricity consumption rate as BYD’s data adjusted in vehicle type dimension and in time dimension by Liu et al. 7 and Zhang et al. 39 reports.
Data process is completed in SPSS 19.0 and Matlab R2014a environment.
Results
Intrinsic growth rates
The intrinsic growth rate of EVs and ICEVs are estimated by the respective historical data of each type. Through employing the Augmented Dickey-Fuller unit root test (ADF), both EV and ICEV stock data show an obvious time trend. In statistics, the left side in equation (10) can be explained in variable
Applying a linear regression method to equation (10) with dependent variable calculated by EV data and independent variable calculated by t and ICEV data, EVs intrinsic growth rate is estimated, as seen in Tables 1 and 2. Similarly, reiterating the same process with dependent variable calculated by ICEV data and independent variable calculated by t and EV data, ICEVs’ intrinsic growth rate is also estimated, as shown in Tables 3 and 4. At 10%, 5%, and 1% statistical levels, equation (10) fits well to both EVs and ICEVs actual growth trajectory.
Coefficients of EVs regression model (scenario 300).

Coefficients of EV regression model (scenario 200).

Coefficients of ICEV regression model (scenario 300).

Coefficients of ICEV regression model (scenario 200).
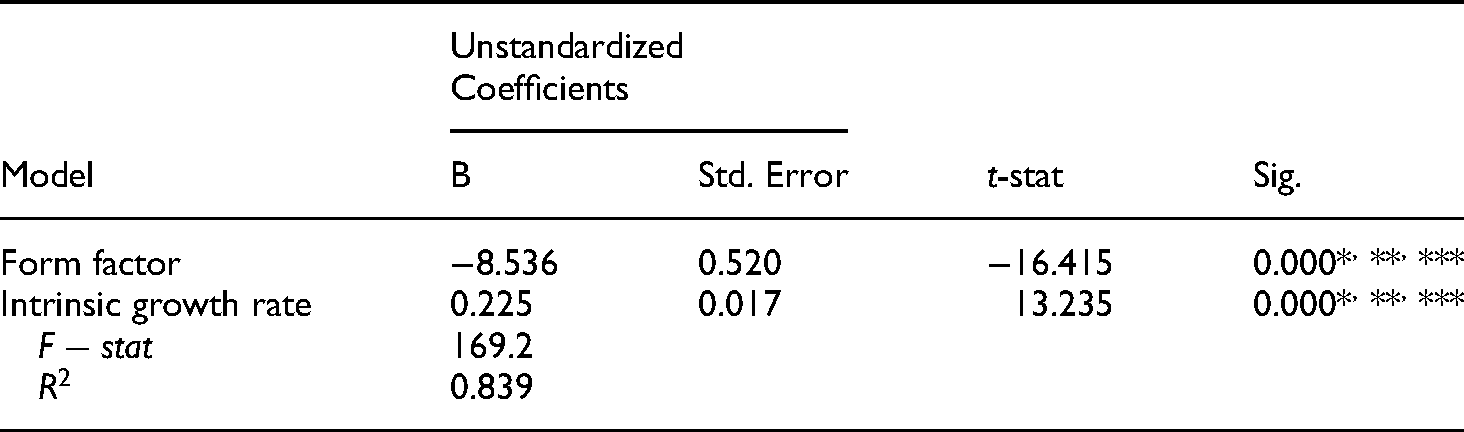
As seen in equations (1) and (2), the economic meaning of intrinsic growth rate is the common factor of growth rate across the time horizon. It does not depend on vehicle stock level every year. Generally, the stronger policy incentives to an industry, the higher intrinsic growth rate the industry will achieve. Since China has set strong incentives to deploying EVs development,1,3 EVs intrinsic growth rate is 7-fold higher than that of ICEVs under scenario 300.
Growth trajectories
Through applying boundary condition and estimated parameters in Tables 1 and 2 to equation (10), EV growth trajectory from 2010 to 2050 under each scenario is predicted, as displayed in Figures 1 and 2. To make an intuitive version of model fitness, EVs actual stock during 2010–2018 is presented in both figures.

Predicted electric vehicles trajectory from 2010 to 2050 under scenario 300.

Predicted electric vehicles trajectory from 2010 to 2050 under scenario 200.
Similarly, through applying boundary condition and estimated parameters in Tables 3 and 4 to equations (10) and (11), ICEV trajectory from 1990 to 2050 under each scenario is predicted, as shown in Figures 3 and 4. The actual data series is also plotted to give an intuitive version of model fitness.

Predicted internal combustion engine vehicles trajectory from 1990 to 2050 under scenario 300.

Predicted internal combustion engine vehicles trajectory from 1990 to 2050 under scenario 200.
To draw a comparison among these trajectories, Table 5 summarizes their main features. The following analysis reveals many useful policy implications.
EV and ICEV growth features under each scenario (million).
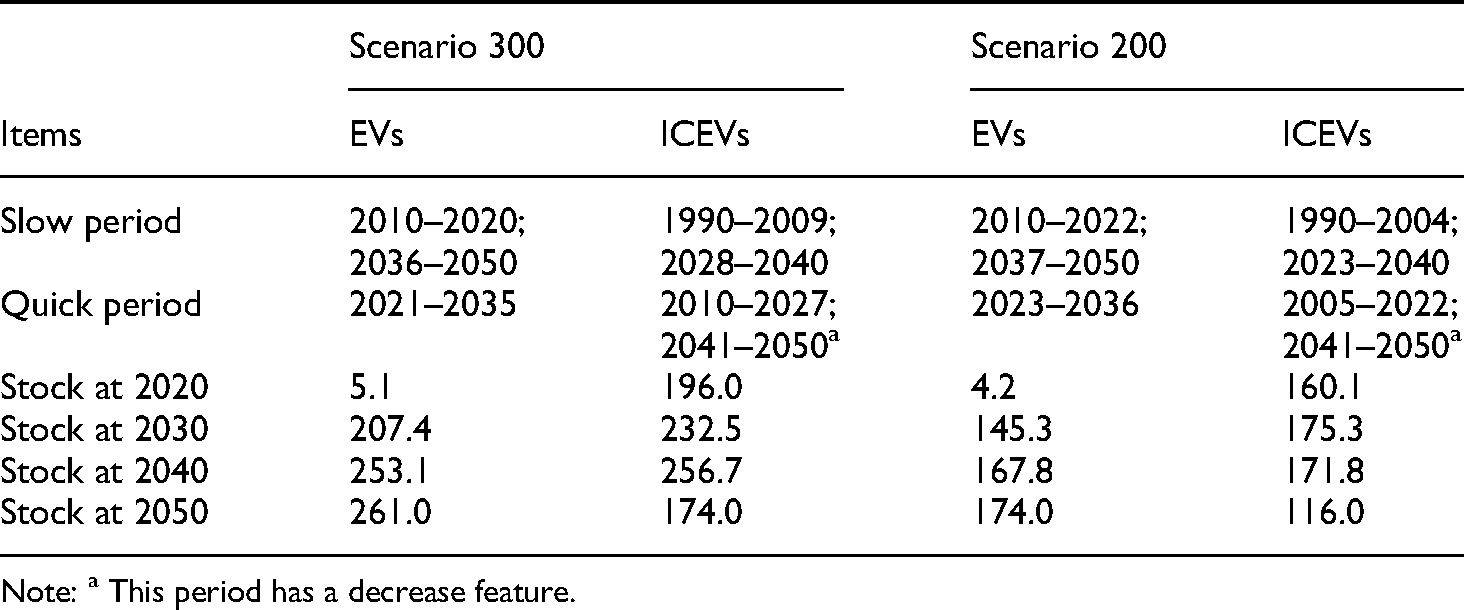
Note: a This period has a decrease feature.
First, Scenario 300 implies that EVs industry will have a quick growth stage during 2021–2035, then get into a maturity stage up to 2050. Although EV stock was 4.92 million at the end of 2020, from the industry life cycle perspective, it still belongs to the introduction period. A similar conclusion can be drawn from Scenario 200; however, there is a 2-year delay in contrast to Scenario 300. Obviously, it is a wise strategy for automakers to invest in EV research, development and deployment (RD&D) and gradually develop their own EV brand.
Second, Scenario 300 reveals that current ICEVs quick growth stage will continue for 7 years, then hold stable during 2028–2040, afterwards, following a slowdown period from 2041 to 2050. Also, the ICEV trajectory under Scenario 200 has a similar feature. The difference is that the quick period is shortened to 2 years, while the stable period will hold for 17 years. Moreover, statistical tests indicate that scenario 300 fits ICEVs data better than scenario 200. This is also shown in Figures 3 and 4: the current ICEVs stock will reach the peak under scenario 200; however it still has a 106.3 million gap between 2014 and 2040 under scenario 300.
Finally, under both scenarios EV stock will surpass ICEV stock slightly at the end of 2041. It implies that Chinese EV strategy42,43 may be realized if the government persistently sets strong policy incentives on this industry, such as tax reduction, charge pile/station construction, battery technology advancement, public transport fleet electrification, etc. As Tables 1 and 3 display, the current high intrinsic growth rate of EVs reveals strong policy support for this industry.
Energy saving and CO2 mitigation effects
Figures 5 and 6 display that EVs penetrating in the road transportation sector will bring a yearly oil saving effect. Under both scenarios, a downward trend of oil saving effect during 2032–2040 is observed. It is mainly attributed to the continuous uptake of ICEVs and gradually slow growth rate of EV stock (see Figures 1 and 3, Figures 2 and 4). Since 2041–2050 will undergo a downward total vehicle stock and high proportion of electric cars in the EV industry, a slightly downward oil saving effect is found in this period.
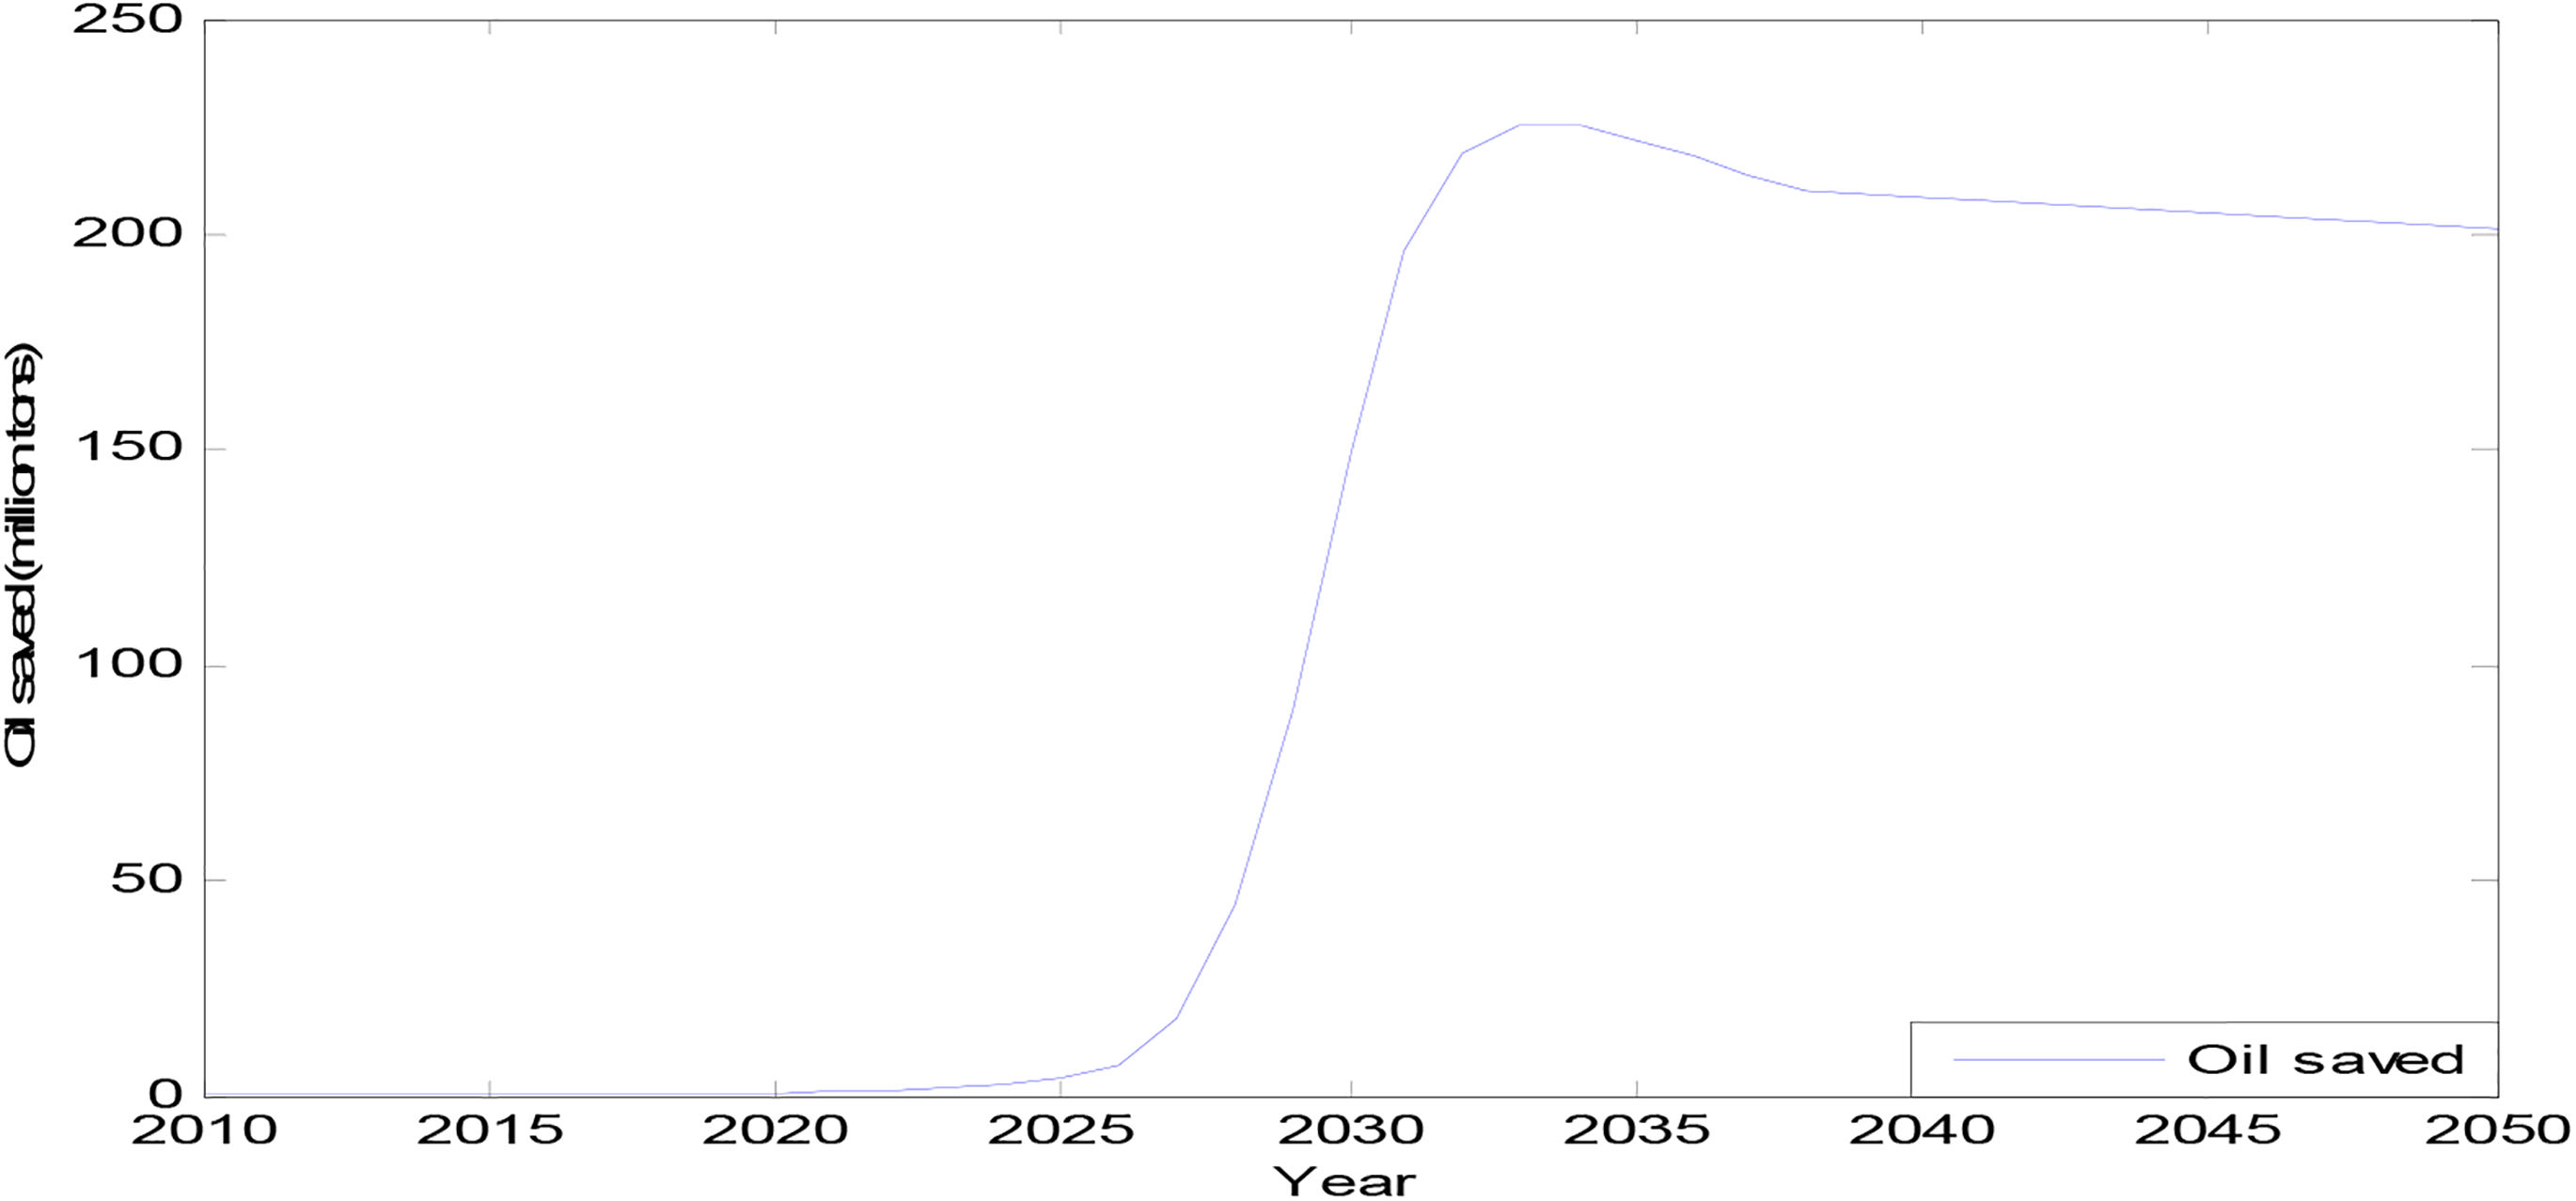
Yearly oil saving effect from 2010 to 2050 under scenario 300.

Yearly oil saving effect from 2010 to 2050 under scenario 200.
Meanwhile, Figures 7 and 8 display that substituting ICEV with EV also produces a yearly CO2 mitigation effect. At 10%, 5%, and 1% statistical levels, the correlation coefficient between CO2 mitigation effect and oil saving effect is 0.946.

Yearly CO2 mitigation effect from 2010 to 2050 under scenario 300.

Yearly CO2 mitigation effect from 2010 to 2050 under scenario 200.
At 2020, 2030, 2040, and 2050, the annual oil saving and CO2 mitigation effects are presented in Table 6. In contrast to national CO2 emissions being roughly 10,000 Mt in 2015, the current CO2 mitigation effect is trivial because of the low EV share and high proportion of electricity generated by coal combustion. However, total oil saving and CO2 mitigation effects both exceed 4000 Mt under scenario 300. Even under scenario 200, this value is over 3000 Mt. On average, yearly 114.4 Mt oil as well as 111.5 Mt CO2 will be saved under scenario 300, and 77.1 Mt oil as well as 73.4 Mt CO2 will be saved under scenario 200.
Oil saving and CO2 mitigation effects under each scenario (Mt).

With EVs year-on-year penetrating, 2028 will see significant change: oil saving and CO2 mitigation both surpass 85.0 Mt under scenario 300. This phenomenon also occurs under scenario 200, over 60.0 Mt saved in 2028. Moving beyond 2032, 206.3 Mt oil and 204.8 Mt CO2 will be saved under scenario 300 every year. In percentage terms, it will take nearly 50.0% of road transport consumed oil and 18.6% of CO2 emitted from this sector. Obviously, this won’t be neglected in contrast to the current trivial energy saving and CO2 mitigation effects caused by EV penetration.
Discussion
The saturated level is an important factor for predicting total vehicle stock. Button et al. 13 predicted vehicle growth for low-income countries by setting this parameter between 300 and 450 vehicles per thousand persons. Dargay and Gately 21 assumed a saturated level of 600 vehicles per thousand persons to forecast Chinese vehicle development. However, some researchers held that such a high level might be a disaster for China where human population is huge and personal income is low. Concerning these research efforts, this article sets two scenarios: with 200 and 300 vehicles per thousand persons at 2050. In line with statistical test in Tables 1–4, scenario 300 is more reasonable than scenario 200.
Yan and Crookes 44 reported that Chinese vehicles had grown tremendously over the past decades and the quick growth trend would continue in the foreseeable future, which was also reported by Michael. 45 Our research results further quantify this period: ICEVs quick growth will keep up to 2027 and EVs quick growth will emerge during 2021–2035 under Scenario 300. In 2010, the government announced a long-run EV program that EV stock would be equal to ICEV stock at 2030. 46 Considering EVs stock only shared 0.57% and 1.75% in total vehicle stock in 2017 and 2020, such a big gap allows this study to delay the equivalent point to 2040. Also, the equivalent point appears a decade earlier than Voelcker’s forecast, 47 which may be explained in high intrinsic growth rate of EVs. By 2030, Hu et al. 48 and Zhang et al. 49 suggested that Chinese vehicle stock would reach 400 million. Our recommended scenario is 439.9 million, higher than their previous estimation on account of the more suitable methodology and up-to-date data.
Our empirical study implies that before EVs significantly affects CO2 emissions, there will be a decade of slow growth period. The reason is that with electricity generation being dominated by coal combustion, EVs needs to reach a large scale for bringing significant mitigation effect. A decade’s slow growth period was also observed by similar research focusing on other countries.50,51 Concerning governmental regulations, Perujo and Ciuffo 52 recommended that without an appropriate regulation, EV deployment at a large scale would heavily influence daily requested electric power. Fortunately, regulated charging may smooth daily load curve and bring more CO2 mitigation than the stochastic charging behaviors.6,53 In addition, although EVs is an effective instrument for CO2 mitigation in the long run, the required delivery infrastructure investment is very high. 11 To motivate EV development and enjoy its long-term benefits, the government needs to set strong policy incentives in areas such as tailpipe emissions control, corporate average fuel economy (CAFE) standards, EV supply equipment construction, battery technology development, charging behavior regulation, tax exemption, tolls and parking fee waived, etc.3,42
Conclusions
With energy security and climate mitigation being growing concerns, China’s EV industry has taken on an accelerated pace. It is getting to be a major concern for stockholders to predict EV market penetration and evaluate corresponding energy-saving and CO2 mitigation effect. This article introduced the double species model to predict EV market penetration. Because of conjoint analysis and logistic growth characteristics of the model, it is more suitable to fulfil this work under EVs’ and ICEVs’ mutually competitive environment. After model choice was determined, we solved the model and got its analytical formula. Based on the analytical formula, we conducted an empirical study on EVs penetration in China and its energy-saving and CO2 mitigation effects during 2010–2050. To make policy suggestions built on robust results, we compared two scenarios: with 200 and 300 vehicles per thousand persons at 2050.
This article simulated two trajectories for EV market penetration as well as relative oil saving and CO2 mitigation effects. EVs’ quick growth will emerge during 2021–2035 or 2023–2036 under scenario 300 and scenario 200, respectively, thereafter, keeping stable up to 2050. Coupled with EVs’ trajectory, the current ICEVs’ quick growth will continue to 2027 or 2022 under each scenario, then keep stable up to 2040, afterwards, following a slowdown period during 2041–2050. Because of small EV share as well as high emission intensity of electricity, both energy-saving and CO2 mitigation effects are of little importance at present. However, beyond 2032, annual 50.0% of road transport consumed oil and 18.6% of CO2 emitted by this sector will be saved under scenario 300. Obviously, this will contribute a lot to both energy security and CO2 mitigation.
This paper contributed to existing findings in areas of novel prediction model, coupled growth trajectories for EVs and ICEVs, as well as annual energy-saving and climate effects from 2010 to 2050. As a future work, it is worth studying by employing multi-species model and more scenarios to simulate EV market penetration and estimate relative energy and climate effects.
Footnotes
Data availability statement
All of the data in the manuscript are public and data sources are presented in subsection data process.
Declaration of conflicting interests
The authors declared no potential conflicts of interest with respect to the research, authorship, and/or publication of this article.
Funding
This research was funded by Natural Science Foundation Project of CQ CSTC (No. cstc2012jjA20013), Chongqing University of Arts and Sciences Project (No. R2012JG04) and 2021 Humanities and Social Sciences Program of Chongqing Municipal Education Commission (No. 21SKGH227).
Notes
Appendix
Author biographies
Shijun Fu received his Ph.D degree in technoeconomics and management from Chongqing University, Chongqing, China, in 2011. He is currently an associate professor with Chongqing University of Arts and Sciences. His research interests include electric vehicles, renewable energy and logistics engineering.
Hongji Fu is an undergraduate in School of Mechanical & Automotive Engineering, South China University of Technology, Guangzhou, China. He is mainly engaged in research on deep machine learning, digital twins and autonomous driving.