
Abstract
The characteristics of heat transfer load from the non-air-conditioned (NAC) area can help to understand the complex airflow movement and thermal physical mechanisms inside large space buildings. Based on building energy modeling, the indoor thermal environment and building energy consumption of a plant for computerized numerical control (CNC) machine tools are studied. Considering the form of the stratified air-conditioning system and the phenomenon of heat retention near the roof in the plant, the double zone and triple zone models are established. The vertical air temperature, the parameters of the terminal of the air-conditioning system and the heat/cool source system of the plant in summer and winter were measured on site, which verifies the accuracy of the established model. Based on the validated model, the proportion of heat transfer load from the NAC area is calculated, at the range of about 60%–85%. The positive influence of the roof heat transfer coefficient on the sensible heat load in the NAC area is revealed. The recommended value of the non-dimensional zone-mixing flow rate between the air-conditioned (AC) and NAC areas is given, with 30% (in summer). The results of this work can help understand the composition of the stratified air-conditioning load in large spaces and optimize the design of air distribution.
Keywords
Introduction
Large space buildings with zone heights typically above 10 m are becoming more and more common. Such buildings generally use stratified air-conditioning systems, which regulate the thermal environment at the lower occupied area, whilst the upper level is usually controlled by natural or mechanical ventilation. Nozzle jet air supply is a typical stratified air distribution form, it can not only provide efficient temperature control with a long throw, but also meet the standard requirements for temperature and humidity management in the lower occupied area.1,2 Nozzle jet air distribution is widely used in large space buildings such as airport terminals,3,4 high-speed railway stations,5,6 and industrial plants.7,8
It is a consensus to regulate the indoor thermal environment of large space buildings hierarchically, which can achieve significant energy saving while satisfying thermal comfort. However, in practical engineering applications, the effectiveness of stratified air-conditioning systems is not satisfactory. The energy consumption of air-conditioning systems in buildings with large spaces is over double that in ordinary public buildings, 9 but indoor temperature and humidity control still faces challenges.10,11 It may be closely related to the indoor complex air movement. The structural characteristic of the internal vertical interconnection in large spaces is the cause of complexity in the indoor airflow movement, which makes it difficult to regulate the indoor thermal environment.12,13 For designers of indoor air distribution, an accurate estimation of the load demand of buildings is of decisive significance for the selection of air-conditioning system and the optimization of air distribution. The load composition of the building with the stratified air-conditioning system is special. In addition to the conventional envelope load, interior heat dissipation load, and air infiltration load, there are also convective heat transfer load formed by the vertical temperature gradient of indoor air and radiative heat transfer load caused by the temperature difference of surfaces. Some researchers have focused on the formation mechanism and calculation method of the stratified air-conditioning load. Gorton and Sassi14,15 proposes a method for calculating the stratified air-conditioning load based on scale-model experiments. This method divides the space vertically into several regions, and the heat and mass balance equations in each region are established to determine the temperature profiles and loads in the thermally stratified air-conditioning system. ASHRAE TC4.1 (Design Load Calculation Committee) 16 proposes a simplified calculation method for air-conditioning design load based on heat balance, namely Radiant Time Series method. In this method, the heat conduction equation is replaced by the periodic response factor (PRF), which avoids solving the complex heat balance equation directly, making the solving process simpler and faster. Pan et al. 17 calculates the cooling load of different types of atrium buildings based on CFD, and proposes a simplified method to estimate the cooling load in large spaces. Cheng et al. 18 studies typical spaces with different building heights by CFD simulation. While optimizing the stratified air distribution systems, the databases of effective cooling load factors for different heat sources are built. Benefit from these results, the understanding of the stratified air-conditioning load in large spaces has been further deepened.
The development of building energy modeling makes it possible to analyze the dynamic energy consumption of buildings. Simulating the hourly building load, energy consumption of units, and cooling (heating) capacity of the air-conditioning system can help reveal the changing law and dominant influencing factors of the stratified air-conditioning load. Hsieh et al. 19 simulated the microclimate and building energy use on a typical large space building using EnergyPlus combined with CFD. He found that heat rejection from air conditioners worsens the thermal environment below the urban canopy, thus increasing building energy use. Loutzenhiser et al. 20 compared the effectiveness of EnergyPlus and DOE-2.1E in simulating the light levels of buildings. According to the data of daylight illuminance and light power measured in the actual buildings, it is confirmed that the simulation results of EnergyPlus have higher accuracy. Stazi et al. 21 studied the dynamic performance of envelopes characterized by different traditional wall constructions using EnergyPlus and CFD, and identified the optimal retrofit solution from the point of view of comfort and energy savings in each case. Homod et al.22–24 proposed a novel integrated building model that comprehensively evaluated the energy demand, energy saving potential of the Heating, Ventilating, and Air-Conditioning (HVAC) system in smart buildings and its impact on indoor thermal comfort. Existing findings mostly focus on the energy consumption simulation of large space buildings using EnergyPlus, but few studies involve quantitative assessment of the stratified air-conditioning load. In addition, the heat transfer load from the NAC area is one of the components that cannot be ignored in the stratified air-conditioning load. The reveal of its characteristics can help further understand the energy demand of large space buildings and optimize the design of air distribution.
This work takes a plant for CNC machine tools as the research object. Based on EnergyPlus, the characteristics of the heat transfer load from the upper NAC area are deeply studied. According to the airflow pattern of the plant and the phenomenon of heat retention near the top, the double zone and triple zone models are established, and the thermal environment distribution and building energy consumption in the plant are simulated. A series of thermal environment and equipment parameters measured on site verify the accuracy of the established models. Based on the validated model, the proportion of heat transfer load from the NAC area is calculated. The positive influence of the roof heat transfer coefficient on the sensible heat load in the NAC area is revealed. In addition, the recommended value of the non-dimensional zone-mixing flow rate between the AC and NAC areas is given.
Method
EnergyPlus cooperates with the building systems simulation manager, surface heat balance manager, and air heat balance manager to solve the indoor air state and building energy consumption. When solving the heat balance equations, EnergyPlus ignores shifty heat capacity and assumes that heat transfer is one-dimensional.
The geometric model of the target building is based on Google SketchUp and built in cooperation with OpenStudio. SketchUp can introduce the graphical user interface into the modeling process of the building geometry and the air-conditioning system, which greatly enhances the user’s visual interaction and simplifies the modeling. After the geometric modeling is completed, the output file can be calculated and subsequently modified in EP-launch and IDF Editor. Meteorological data uses the outdoor hourly weather parameters measured on site instead of calling them from the database on the EnergyPlus office website. The indoor design temperature (in the occupied zone) is obtained by averaging the vertical air temperature measured on site and does not use the recommended temperature from the air distribution design method, which is to eliminate the deviation of the building energy consumption caused by the difference in the indoor design temperature (measured and recommended values). Different materials of the envelope correspond to different heat transfer coefficients, which are directly related to the thickness, roughness, density, and thermal conductivity coefficient of the material. In this study, the heat transfer coefficient of the envelope is also determined by on-site measurement. The heat gain in the building, including the heat dissipation of personnel, lighting, and equipment, is also set in the corresponding thermal zone according to the data measured on site. The above methods are all in order to make EnergyPlus simulation results not affected by input parameters, so as to better reveal the impact of different energy use behaviors in large spaces on building energy consumption.
EnergyPlus uses Thermal Zone as the basic unit of energy consumption simulation. The air in the same zone is believed to be fully mixed, so the air state is uniform. Adjacent thermal zones are not isolated, but there is airflow movement. The Zone Mixing module can be used to simplify the air flow between thermal zones, which is accompanied by heat exchange. However, the radiative heat transfer between adjacent zones is not considered. Therefore, the infrared radiation transfer (IRT) material is introduced. The IRT surface can convert the short-wave radiation received by the surface into long-wave radiation to participate in the radiative heat exchange inside the building. IRT is used as the material for the interface between adjacent thermal zones to allow radiative heat exchange.
The object of this research is a plant for CNC machine tools. It is a typical large space building, and the thermal environment of the occupied zone is adjusted stratified through the sidewall nozzle air supply. According to the interface where the nozzles are located, the plant can be divided into the lower AC and upper NAC areas. Xu et al. 25 measured the vertical air temperature distribution in the plant in summer, and found that the air temperature was very high in the area near the roof, and the temperature of the inner surface of the roof was significantly higher than that of the sidewall of the NAC area. Therefore, there is heat retention near the roof, which is considered to be a characteristic of vertical air temperature distribution in large spaces. The heat retention near the roof can intensify the heat transfer of the air in the NAC area, thereby further affecting the heat transfer from the NAC to AC areas. Figure 1 shows the two forms of thermal zone division in EnergyPlus. The dividing interface of the double zone model selects the plane where the nozzles are located. On the basis of the double zone model, the triple zone model further subdivides the NAC area into the roof heat retention zone and the central main convection zone. The triple zone model simplifies the double sloped roof of the plant to a flat roof to facilitate the definition of the heat retention zone. The window area of the external wall is controlled to be equal to ensure equal heat transfer of the envelope.

Two forms of thermal zone division in EnergyPlus: (a) double zone model and (b) triple zone model.
After completing the thermal zone division of the building, it is necessary to construct loops for the air-conditioning system. Zone HVAC Equipments, Plant Loop, and Condenser Loop modules are used to construct air-conditioning terminal loops (centralized and decentralized systems) and heat/cool source system loops (chilled water/hot water and cooling water), respectively. In this study, the air-conditioning system adopts all-air primary return air system. In summer and winter, the surface cooler and heating coil are used to process the mixed air of fresh air and return air. The heat/cool source system has two different operating strategies to cope with different building energy behaviors in different seasons. In summer, the building load is high, so the ground source and air source heat pumps work together. In winter, only the ground source heat pump is used.
Large space buildings often use stratified air-conditioning systems to adjust the indoor thermal environment in zones. Taking the sidewall nozzle air supply as an example, the area below the interface where nozzles are located is called the AC area. The nozzle jets can not only provide efficient temperature control with a long throw, but also meet the standard requirements for temperature and humidity management in the lower occupied zone. For the AC area, the air temperature can reach the set temperature, and the temperature fluctuation in the vertical direction is small. For the NAC area, since the environment in this area is not subject to artificial adjustment, the heat gained in various parts will gather in the upper part of the building along with the rising hot airflow, resulting in a significant air temperature gradient in this area. Room Air module can describe the air temperature stratification phenomenon. Here, Temperature Pattern-Nondimensional Height has a high degree of user freedom, and it allows users to set the air temperature corresponding to the dimensionless height to describe the indoor vertical air temperature distribution. In this study, the on-site measurement of the air temperature can accurately define the vertical temperature distribution of the building, thereby more accurately simulating the building energy consumption.
On-site measurement
The object of this study is the plant for CNC machine tools in University of Shanghai for Science and Technology (USST). Figure 2 shows the internal layout of the plant. The plant covers an area of about 500 m2, with spans of 18 and 28 m on the east-west and north-south sides, respectively. The plant adopts a double sloped roof, the highest point is 12 m away from the floor and the lowest point is 10 m. There are 16 CNC machine tools evenly arranged in the plant, each with an operating power of about 5 kW. The heat/cool source system uses the air source and ground source heat pumps. The coupling and independent operation of the two can respectively ensure the cooling (heating) demand of the plant in summer and winter. The air-conditioning system adopts a centralized all-air system, and the terminals are nozzles installed on the sidewall. The plant is equipped with eight main nozzles and eight auxiliary nozzles, each with the same diameter of 373 mm. The installation height of the main nozzles is 5.5 m. The maximum air supply volume of the air-conditioning system is 30,000 m3/h. The air return outlet is on the same side as the nozzles, with a size of 2 m × 3 m, 0.6 m above the floor.

Internal layout of the plant for CNC machine tools.
The indoor thermal environment, air-conditioning system parameters, heat/cool source unit parameters, and outdoor environment in summer and winter were measured on site. Specifically, the main measurement parameters include: outdoor temperature, sunlight intensity, indoor air temperature, temperature and humidity of air supply, air supply volume, temperature and flow rate of water supply and return in heat pumps, electric power of air-conditioning unit and heat pumps, etc. These measured data can be used as the boundary conditions of EnergyPlus simulation, and can also be used for comparison with EnergyPlus simulation results. The temperature and flow rate of water supply and return in the heat pump are measured by platinum resistance sensors and KROHNE OPTIFLUX4100W electromagnetic flowmeter (±1 mm/s), respectively. The electric power of the air-conditioning unit and heat pumps and air supply volume can be directly read from the display screen of the control cabinet in the machine room. The temperature and humidity of air supply are measured by the E + E EE21 sensor (±0.1°C, ±1% RH). The sunlight intensity is measured by a solar radiation instrument (an accuracy of ±0.1 W/m2).
Figure 3 shows the position of the vertical measuring point for the air temperature in the plant. The indoor space could be divided into two parts according to the different temperature testing devices. The air temperature in the space above 3 m was measured by the PT1000 temperature sensors (an accuracy of ±0.1°C) fixed on the vertical measuring lines, and the adjacent points were separated by 1 m. The air temperature in the space below 3 m was measured by testo temperature and humidity sensors (±0.1°C, ±1% RH), which were arranged on the telescopic rods, and the height of the testo sensors were 0.1, 1.1, and 1.7 m. A total of 105 measuring points were arranged on Lines A–K in the plant.

Position of the vertical measuring point for the air temperature.
Table 1 shows some of the parameters of the 4-day field measurements in the plant in summer (Cases 1–2) and winter (Cases 3–4). Outdoor temperature, air supply temperature, air supply volume, and CSC machine tool power can be used as the setting parameters of EnergyPlus simulation. The hourly measured data are directly input into the model after averaging. The measured heat transfer coefficients of the envelope are as follows, with a unit of W m−2 K−1: 0.91 for the roof, 2.05 for the outer wall, 6.38 for the outer window, 5.94 for the door, and 1.66 for the inner wall. Before the experiment started, the frequency of the air-conditioning unit and the electric power of the heat pumps were adjusted to balance the cooling (heating) capacity of the air-conditioning system with the building load. The data collection time for on-site measurement is from 10:00 to 16:30, and data are recorded every 30 min. Considering the heat storage characteristics of the building envelope and the stability of unit operation, the unit opening time is 12 h before the data recording time. The detailed hourly measurement data for these 4 days are given in Supplemental Document.
Parameters of the 4-day field measurements.

Results and discussion
Model validation
Figure 4 shows the comparison between the simulated and measured values of hourly air temperature in the AC and NAC areas. Cases 1–4 can reflect the accuracy of EnergyPlus in simulating the air temperature in summer and winter. For Case 1, the maximum deviation between the simulated and measured values of air temperature is 0.8°C in the AC area and 0.6°C in the NAC area. For Case 2, the maximum deviation of air temperature is 0.7°C in the AC and 0.8°C in the NAC areas. For Case 3, the maximum deviation is 0.4°C in the AC and 0.3°C in the NAC areas. For Case 4, the maximum deviation is 0.8°C in the AC area and 0.5°C in the NAC area. The results depict that the simulated value of indoor air temperature shows a consistent trend with the measured value in different thermal zones. The average deviation of the air temperature of the four cases is 0.37°C in the AC area and 0.25°C in the NAC area. The accuracy of the simulation is slightly higher in winter (Cases 3–4) than in summer (Cases 1–2). This is because the air temperature difference between the AC and NAC areas is smaller in winter, and the hourly air temperature changes more steadily. In summer, the hourly change of air temperature fluctuates more, and it is more affected by outdoor meteorological parameters.

Comparison between the simulated and measured values of hourly air temperature in the AC and NAC areas: (a) cases 1–2 and (b) cases 3–4.
Figure 5 shows the comparison between the simulated and measured values of hourly EER and COP of the air-conditioning system. The results show that EER and COP are basically stable at the same level. The average deviation of EER of the air-conditioning system is 14.47% for Case 1 and 14.11% for Case 2. The average deviation of COP of the air-conditioning system is 28.02% for Case 3 and 26.71% for Case 4. According to the definition of EER and COP, these parameters represent the ratio of the cooling (heating) capacity of the air-conditioning system to the effective input power. Let’s take Case 1 (in summer) as an example to explain the reasons for the deviation of EER.

Comparison between the simulated and measured values of hourly EER and COP of the air-conditioning system.
Figure 6 shows the comparison between the simulated and measured values of the hourly power consumption of air-conditioning units and hourly cooling capacity. The results show that the maximum deviations of the power consumption of the water pump, fan, air source, and ground source heat pumps are 0%, 4.88%, 12.00%, and 5.98% respectively, and the average deviations are 0%, 2.84%, 4.03%, and 3.22%. The maximum deviation of the total power consumption of the air-conditioning system is 3.12%, and the average deviation is 1.47%. It shows that EnergyPlus has very high accuracy for simulating the power consumption of the air-conditioning units. The maximum deviation of the cooling capacity is 20.00%, and the average deviation is 15.29%. The simulated value of hourly cooling capacity is generally smaller than the measured value, which is the reason why the simulated value of EER is smaller. The lower simulated value of the cooling capacity may be caused by the cooling capacity loss of the air-conditioning system during actual operation. The reasons for the loss of cooling capacity are as follows: First, the heat/cool source units are placed outside the plant, and part of the cooling capacity is lost when the heat/cool source units deliver chilled water to the room; secondly, there is air leakage at the terminal when it delivers cold air to the occupied zone, which also causes part of the cooling capacity to be lost. The calculation mechanism of EnergyPlus determines that it is based on the heat balance of the thermal zone. After iterative calculation, the cooling capacity of the air-conditioning system can match the building load as much as possible. However, EnergyPlus simulation is under ideal conditions, and it cannot consider the loss of cooling capacity. Therefore, the simulated COP is smaller. The simulated COP is corrected below.

Comparison between the simulated and measured values of hourly power consumption of air-conditioning units and hourly cooling capacity (case 1).
The difference between the measured hourly cooling capacity of unit and terminal is used to correct the simulated cooling capacity, which is to make the simulation process consider the loss of cooling capacity of the air-conditioning system. Figure 7 shows the comparison between the measured and corrected simulated values of hourly cooling capacity and EER. The results show that the deviation of the corrected EER has increased from the original 14.47% to the current 3.02%. Therefore, after manual correction, the accuracy of the simulation can be guaranteed.

Comparison between the measured and corrected simulated values of hourly cooling capacity and EER (case 1).
Parametric analysis
Proportion of heat transfer load from NAC area
Based on the corrected model, the characteristics of heat transfer load from the NAC area in large spaces are studied. The Practical Heating and Air Conditioning Design Manual edited by Lu 26 guides the calculation of the stratified air-conditioning load in large space buildings in the design stage. The manual believes that the stratified air-conditioning load consists of the air-conditioning load (including the envelope load, the internal heat dissipation load, and the air infiltration load) and the heat transfer load from the NAC area (including the radiative and convective heat transfer loads). It is a semi-empirical calculation method involving a large number of empirical coefficients, which can be easily applied to actual buildings and has a certain degree of accuracy. Based on EnergyPlus, the characteristics of heat transfer load from the NAC area in large spaces are studied. The AC and NAC areas of the plant are simplified into two areas with independent air-conditioning systems, respectively. The material of the interface between adjacent thermal zones does not use IRT material. Therefore, there are no convective and radiative heat exchange between adjacent thermal zones. The sensible heat loads in the AC and NAC areas can be calculated, respectively. The heat transfer load from the NAC area can be defined as the part of the sensible heat load in the NAC area transferred to the AC area as the cooling load. The proportion of the heat transfer load to the sensible heat load in the NAC area is defined as the parameter a. Tables 2 and 3 show the simulated value of the sensible heat load in each thermal zone by the double zone and triple zone models. The results show that for the double zone model, the proportion of the heat transfer load from the NAC area accounts for 65.92% in Case 1, 61.28% in Case 2, 84.04% in Case 3, and 82.12% in Case 4. For the triple zone model, the proportion of the heat transfer load from the NAC area accounts for 72.32% in Case 1 and 78.95% in Case 3. The proportion in winter is generally higher than that in summer. It is because the temperature difference between the air in the NAC area and the outdoor environment is greater in winter, which generates a greater sensible heat load in the NAC area, resulting in a larger proportion of the heat transfer load from the NAC area.
Simulated value of the sensible heat load in each thermal zone by the double zone model.

Simulated value of the sensible heat load in each thermal zone by the triple zone model.

Roof heat transfer coefficient
Figure 8 shows the relationship between the hourly sensible heat loads in the AC and NAC areas and the roof heat transfer coefficient simulated by the double zone model in summer and winter. The results show that with the increase in the roof heat transfer coefficient, the sensible heat load in the AC area remains basically unchanged, while the sensible heat load in the NAC area is gradually increased. The changes of hourly sensible heat load in the NAC areas show different patterns in summer and winter. In summer, the sensible heat load gradually increases after 12:00, while it is greater in the morning and evening in winter. It is because in summer, the outdoor ambient temperature and solar radiation in the afternoon are stronger than those in the morning, which causes the sensible heat load in the NAC area to gradually increase during this time period. In winter, the outdoor ambient temperature is lower in the morning and evening, and the temperature difference between the air in the NAC area and the outdoor environment is the largest during this time period, resulting in a greater sensible heat load.

Relationship between the hourly sensible heat loads in the AC and NAC areas and the roof heat transfer coefficient simulated by the double zone model in: (a) summer and (b) winter.
Figure 9 shows the relationship between the hourly sensible heat loads in the AC and NAC areas and the roof heat transfer coefficient simulated by the triple zone model in summer and winter. The NAC area is further subdivided into the middle and top zones. It shows that the simulation results of the triple zone model are similar to the double zone model. The sensible heat load in the top heat retention zone increases with the roof heat transfer coefficient, while that in the AC area and the middle convection zone remains basically unchanged. It is believed that the roof heat transfer coefficient mainly causes the load change in the top heat retention zone belonging to the NAC area. The sensible load in the top zone is positively correlated with the roof heat transfer coefficient.
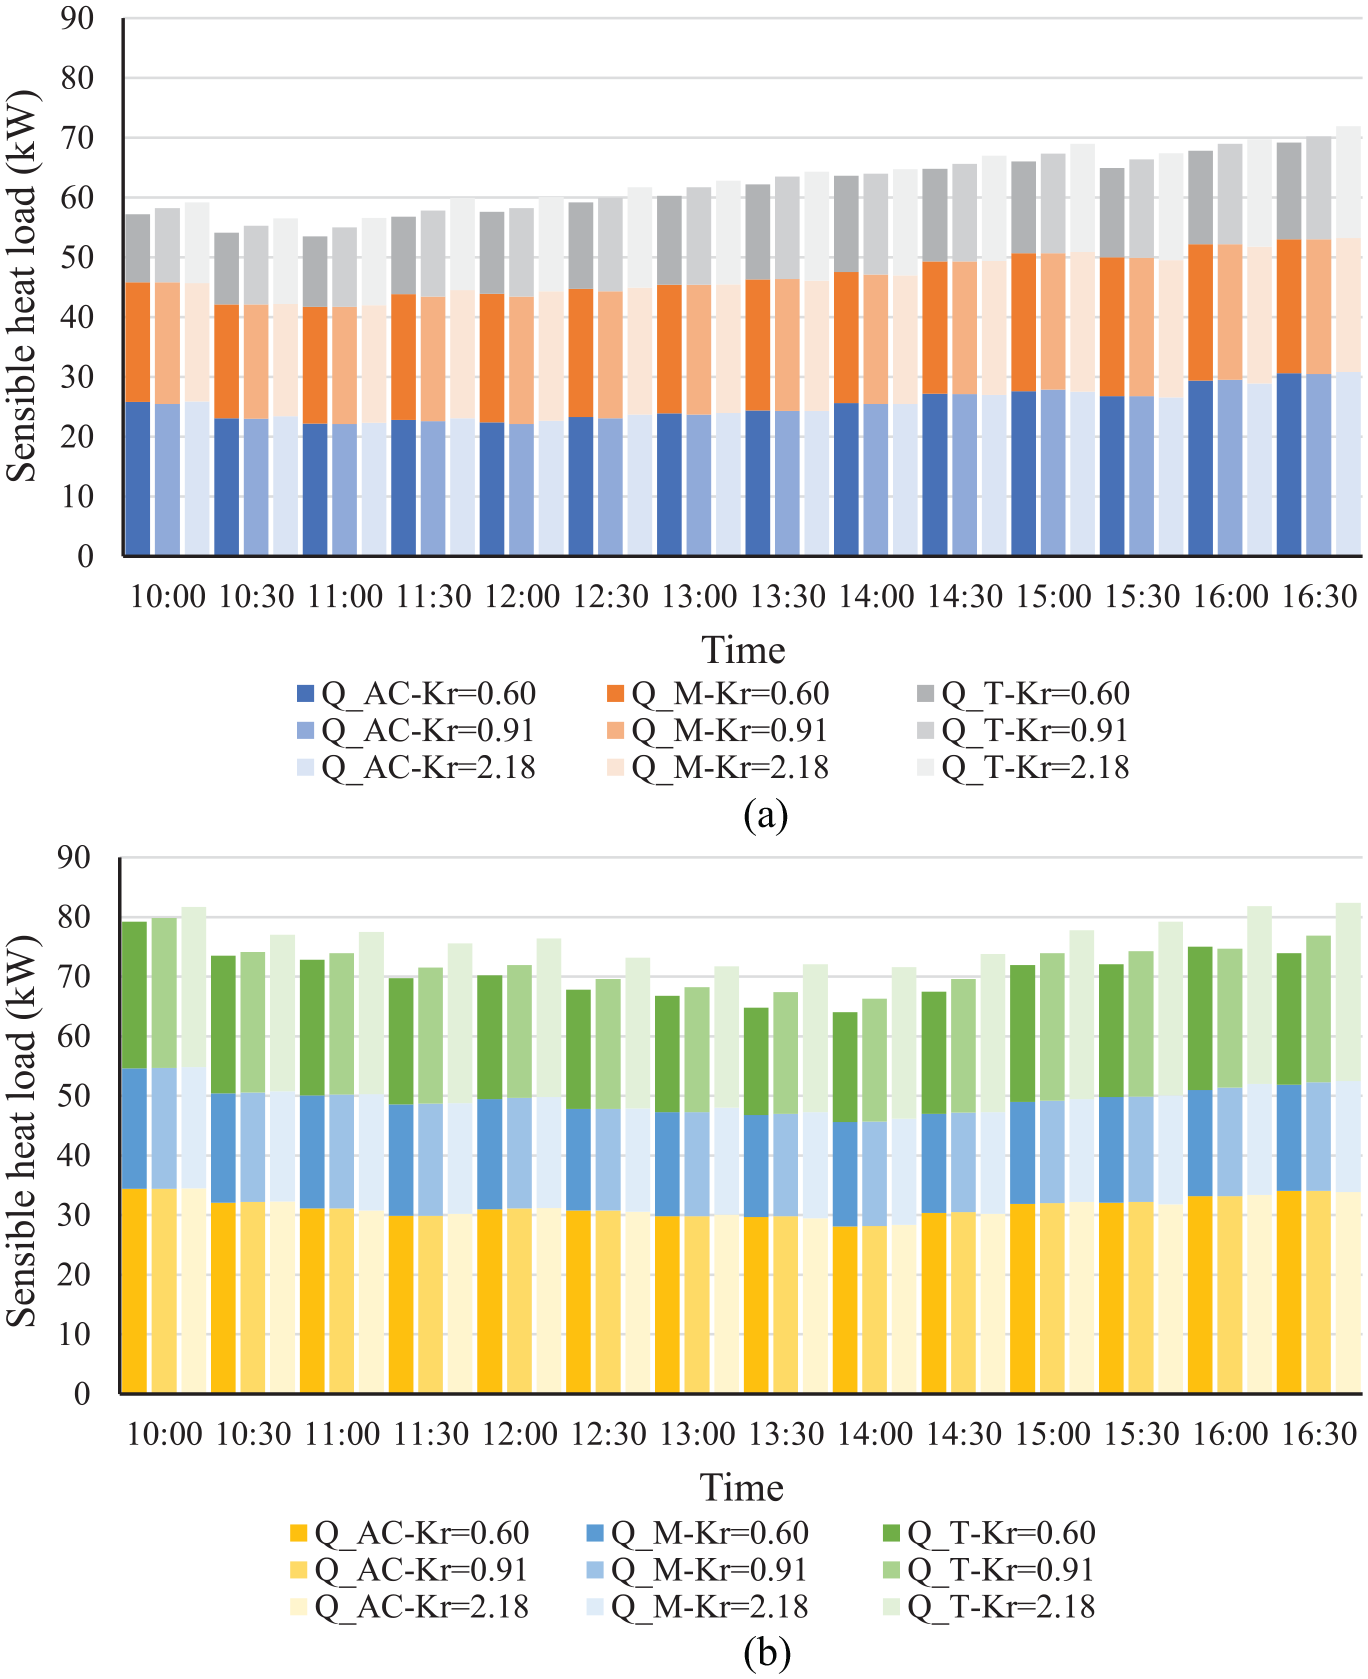
Relationship between the hourly sensible heat loads in the AC and NAC (middle and top zones) areas and the roof heat transfer coefficient simulated by the triple zone model in: (a) summer and (b) winter.
Zone-mixing flow rate
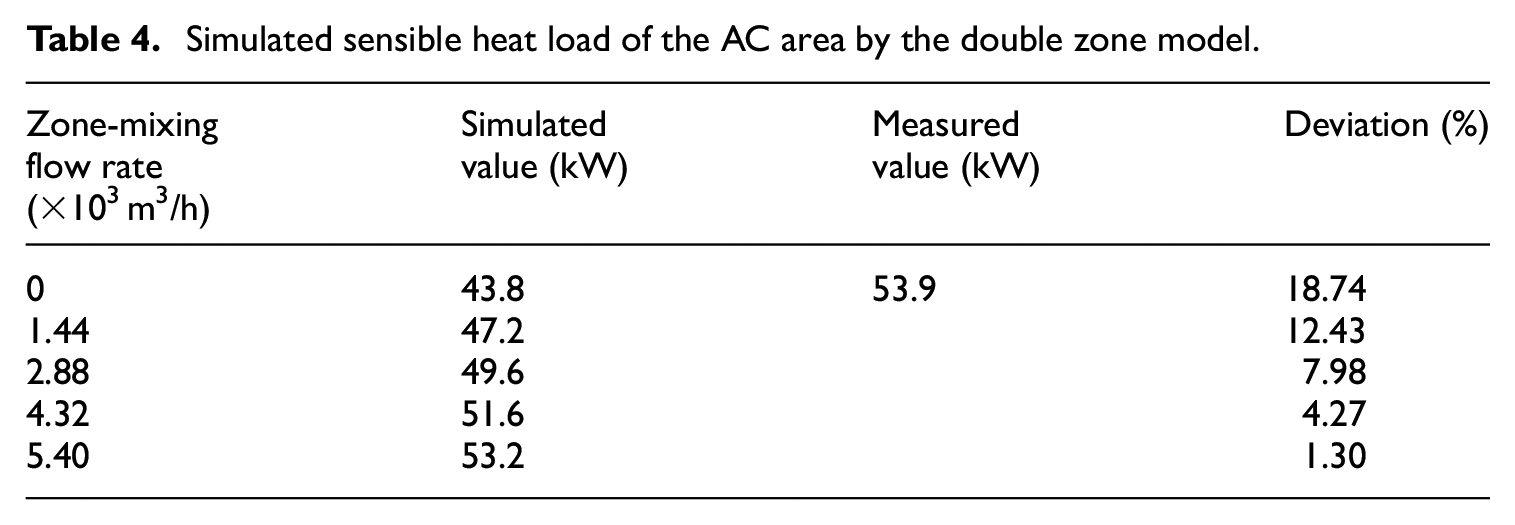
In Sections 4.2.1 and 4.2.2, the AC and NAC areas are isolated, and there is no convective and radiative heat transfer between these two thermal zones. It is to quantitatively analyze the proportion of heat transfer load from the NAC area and reveal the influence of the roof heat transfer coefficient on the sensible heat load in the NAC area. For large space buildings, the temperature gradient between the AC and NAC areas will drive the air flow at the interface and accompany convective heat exchange. Therefore, based on EnergyPlus, the material of the stratified interface is reset to IRT material to ensure radiative heat exchange. The Zone Mixing module is used to consider the zone-mixing flow rate between the AC and NAC areas. By comparing the measured value of the sensible heat load in the AC zone with the simulated value, the recommended zone-mixing flow rate is determined. Tables 4 and 5 show the simulated values of the sensible heat load of the AC area under different zone-mixing flow rates by the double zone and triple zone models, taking Case 1 as an example.
Simulated sensible heat load of the AC area by the double zone model.
Simulated sensible heat load of the AC area by the triple zone model.

The results show that when the zone-mixing flow rate is 5.4 × 10³ m3/h, the deviation between the simulated and measured value of the sensible heat load in the AC zone is the smallest, which is 1.30% for the double zone model and 0.74% for the triple zone model. Since the zone-mixing flow rate has different recommended values for different buildings, it is dimensionless treated below. The non-dimensional zone-mixing flow rate is defined as the ratio of the zone-mixing flow rate to the air supply volume of the air-conditioning system. In this case, the non-dimensional zone-mixing flow rate is about 30%. The proportion of convective heat transfer load is further calculated, with 17.63% for the double zone model and 13.50% for the triple zone model. The reason why the convective heat transfer load simulated by the triple zone model is smaller is that the air in the top heat retention zone of the triple zone model does not participate in the convective heat transfer inside the building. In the triple zone model, the volume of the middle convection zone is smaller than that of the entire NAC area in the double zone model. In addition, the air temperature distribution in the NAC area of the triple zone model is further refined. The temperature in the top heat retention zone is high, and the heat in the middle convection zone is less than that in the entire NAC area in the double zone model, and its air temperature is also lower. Therefore, the air temperature difference involved in convective heat transfer process in the triple zone model is less than that in the double zone model, and the proportion of convective heat transfer load is also smaller. Compared with the proportion of convective heat transfer load calculated by the Practical Heating and Air Conditioning Design Manual, 26 the value calculated by the triple zone model is more accurate.
Conclusions
Based on EnergyPlus, the characteristics of heat transfer load from the NAC area in large space buildings are studied. This work takes a plant for CNC machine tools using sidewall nozzle jets as the research object, and establishes a double zone model regarding the plane where the nozzles are located as the interface. The hourly air temperatures in the AC and NAC areas, power consumption of air-conditioning units and cooling (heating) capacity are simulated in summer and winter. The accuracy of the double zone model is verified by the detailed data of the 4-day field measurements. Based on the modified model, the NAC area is further subdivided into the middle convection zone and the top heat retention zone to consider the characteristic of heat retention near the roof. The proportion of the heat transfer load from the NAC area is calculated according to the simulation results by the double zone and triple zone models. This value is at the range of about 60%–85%. The sensible heat load in the NAC area (especially the top heat retention zone) is positively correlated with the roof heat transfer coefficient. The recommended value of the non-dimensional zone-mixing flow rate between the AC and NAC areas is given, which is 30% (in summer). The proportion of the convective heat transfer load is further calculated, which calculated by the triple zone model has higher accuracy. The detailed analysis of the heat transfer load in this work can provide guidance for the design of stratified air-conditioning systems and air distribution in large space buildings.
Supplemental Material
sj-docx-1-sci-10.1177_00368504211036133 – Supplemental material for A study on heat transfer load in large space buildings with stratified air-conditioning systems based on building energy modeling: Model validation and load analysis
Supplemental material, sj-docx-1-sci-10.1177_00368504211036133 for A study on heat transfer load in large space buildings with stratified air-conditioning systems based on building energy modeling: Model validation and load analysis by Yunqian Zhang, Jun Lu, Xin Jiang, Shuren Shen and Xin Wang in Science Progress
Footnotes
Declaration of conflicting interests
The author(s) declared no potential conflicts of interest with respect to the research, authorship, and/or publication of this article.
Funding
The author(s) disclosed receipt of the following financial support for the research, authorship, and/or publication of this article: This work was supported by the National Natural Science Foundation of China (grant number 51708054) and the Machinery Industry Innovation Platform Construction Project of China (grant number 2019SA-10-07).
Supplemental material
Supplemental material for this article is available online.
Author biographies
References
Supplementary Material
Please find the following supplemental material available below.
For Open Access articles published under a Creative Commons License, all supplemental material carries the same license as the article it is associated with.
For non-Open Access articles published, all supplemental material carries a non-exclusive license, and permission requests for re-use of supplemental material or any part of supplemental material shall be sent directly to the copyright owner as specified in the copyright notice associated with the article.