
Abstract
This integrated bioinformatic study aimed to investigate potential prognostic candidates in hepatocellular carcinoma (HCC). In the GSE14520, GSE101685, and The Cancer Genome Atlas (TCGA) datasets, differentially expressed genes (DEGs) were identified and functional pathways of common DEGs were enriched. The least absolute shrinkage and selection operator (LASSO) model was used to screen the potential parameters associated with overall survival (OS) in HCC patients. Metabolic pathways were the most significantly enriched functional pathways of common DEGs in these three datasets. After LASSO model analysis, HMGCS2, UGP2, BCLC staging and TNM staging were screened as potential prognostic candidates for OS in HCC patients in GSE14520. HMGCS2 in the metabolic pathway was significantly downregulated in tumor tissues and peripheral blood mononuclear cells in HCC patients (all p < 0.05). Cox regression model indicated that HMGCS2 might be associate with OS in HCC patients in GSE14520 and in the TCGA (p = 0.029 and p = 0.05, respectively). Kaplan–Meier analysis demonstrated that HMGCS2 downregulation in tumors contributed to an unfavorable OS in HCC patients, both in GSE14520 and in the TCGA (p = 0.0001 and p = 0.0002, respectively). Additionally, HMGCS2 was significantly downregulated in HCC patients with high alpha-fetoprotein (AFP), main tumor size >5 cm, multinodular, advanced tumor staging including BCLC, TNM and CLIP (all p < 0.05). HMGCS2 was involved in metabolic pathways, and downregulated HMGCS2 in tumors was associated with unfavorable OS in HCC patients.
Introduction
As one of the leading causes of cancer death, the incidence of hepatocellular carcinoma (HCC) has continued to increase globally in recent decades and will rise over the next 10–20 years.1−3 Mortality related to liver cancers including HCC has markedly increased by more than 2% annually since 2007, 1 and HCC is the seventh most frequently occurring cancer and the second most common cause of cancer death. Even though comprehensive treatment strategies have been developed, the prognosis of HCC is still not up to expectations.
Biomarkers in tumor tissues are a direct and cost-effective adjunct, especially in monitoring disease prognosis and treatment target selection in HCC patients.4,5 Identifying reliable prognostic biomarkers and therapeutic targets for HCC treatment is urgently required.6,7 Currently, only three biomarkers alpha-fetoprotein (AFP), core fucosylated AFP and des-gamma-carboxy prothrombin are widely used for HCC.6,8 However, high-throughput technologies and gene chips have become fast approaches for identifying differentially expressed genes (DEGs) and functional pathways and have led to a dramatic increase in the availability of molecular insights at multiple biological levels involved in the aggressiveness of HCC.9−11 Various bioinformatics databases in hepatology are currently available, and the accessibility of genomic sequencing data from liver tumors has provided us with invaluable resources. 11 Although many biomarkers identified through public databases have not been well validated and used widely in clinics,5,12,13 integrating data from different sources including the Gene Expression Omnibus (GEO) and The Cancer Genome Atlas (TCGA) still helps us to facilitate the identification of promising biomarkers or therapeutic targets.11,14
This study identified common DEGs in multiple datasets and investigated the most significant functional pathways. Clinical data were obtained from GSE14520 and TCGA liver hepatocellular carcinoma (LIHC). The least absolute shrinkage and selection operator (LASSO) model was used to identify potential candidates for predicting prognosis in HCC patients. We hope our findings will provide helpful insights into the pathogenesis and progression of HCC.
Materials and methods
Ethics statement
This study is a secondary analysis based on public datasets. As declared in the original datasets, every subject provided verified informed consent. The informed consents and study protocol were reviewed and approved by the Institutional Review Board of the participating institutes.15,16
Data source
Microarray series of GSE14520 15 and GSE101685 were downloaded from the GEO database (https://www.ncbi.nlm.nih.gov/geo/, Table 1). In GSE14520, 220 hepatitis B virus (HBV) related HCC patients were included in this analysis after excluding 22 cases without gene expression and 5 cases without clinical data. All liver tissue was obtained with informed consent from patients who underwent radical resection between 2002 and 2003 at the Liver Cancer Institute and Zhongshan Hospital, Fudan University. In GSE101685, 8 normal tissues and 24 HCC patients were selected for RNA extraction and showed the gene expression profile. Detailed information on these GEO datasets is summarized in Table 1. In addition, mRNA normalized counts data of LIHC in the TCGA database derived from the RNAseq Htseq platform were downloaded from the Genomic Data Commons Data Portal (https://cancergenome.nih.gov/). This dataset contains 424 samples with 374 liver cancer samples and 50 normal liver samples.
Details of GEO and TCGA datasets included in this study.

PBMCs: peripheral blood mononuclear cells.
Clinical and gene expression data in tumor samples with Z scores normalized of TCGA-LIHC dataset were obtained from cBioPortal for cancer genomics (http://www.cbioportal.org/).17,18 After excluding non-HCC subjects and those without gene expression data, 361 cases were finally enrolled in the study. Clinicopathological features including age, gender, American Joint Committee on Cancer (AJCC) staging, body mass index, family history of cancer, risk factors, pathological grade, vascular invasion, child-pugh stage, AFP, hepatic inflammation, and Ishak scores were considered.
Identification of DEGs
Raw.CEL files of the microarray GSE14520 and GSE101685 datasets were normalized by the quantile method of robust multichip analysis (RMA) from the R affy package. 19 Relative log expression (RLE) and normalized unscaled standard error (NUSE) tests were used for quality assessment of each sample in the GEO series. Mean gene expression data were calculated when multiple probes mapped onto the same gene name. Missing gene expression data were imputed with the k-nearest neighbor (KNN) method by the impute index in the R program. 20 DEGs between tumor and nontumor tissues were identified by the Limma package in the R program. 21 In the TCGA dataset, the edgeR22,23 package in the R program was used to identify DEGs between tumor and nontumor samples, with the criterion of |log2FC| > 1.0 and adjusted p-value <0.05.
Common DEGs in GSE14520 and GSE101685 and the LIHC profile in the TCGA database were calculated in a Venn diagram from Bioinformatics & Evolutionary Genomics (http://bioinformatics.psb.ugent.be/webtools/Venn/). As shown in Table 1, GEO series with raw .CEL file format, including GSE33006, GSE45436, GSE55092, GSE60502, and GSE84402, were used to reevaluate the expression levels between tumor and nontumor tissues of screened candidates. GSE58208 and GSE49515 were used to calculate candidate gene expression in peripheral blood mononuclear cells between HCC and non-HCC patients (Table 1). Protein levels of screened candidates between HCC and normal samples detected by immunohistochemistry (IHC) in the Human Protein Atlas (https://www.proteinatlas.org/, HPA) dataset were also presented.
Enrichment analysis
As we described above, common DEGs in GSE14520 and GSE101685, and LIHC profile in the TCGA database were identified using a Venn diagram. Then, the R package clusterProfiler 24 was used to address the top 20 functional enrichment pathways of these common DEGs. 25 The pathways with the most significantly enriched genes were selected for LASSO model establishment.
The LASSO model establishment
A LASSO regression model was used to determine the most powerful prognostic markers for overall survival in HCC patients. 26 “glmnet” and “survival” packages were used for LASSO model establishment with family equals to “cox” and alpha equals to 1. 27 The model was validated with five-fold cross-validation. Both “lambda.1se” and “lambda.min” were used to assess the coefficient of parameters. 27
Nomogram model establishment
Parameters significantly associated with OS in HCC patients in the multivariate Cox model were included in the risk prediction model by nomogram with the “rms” package in the R program. Based on the Cox proportional hazards model, the “survival” package in the R program was used to calculate the cumulative risk of death. To calculate the concordance index and its 95% confidence intervals (CIs), the “survcomp” package was used. The bootstrap method was used for repeated sampling for internal verification of the model. A calibration plot was presented to evaluate the performance of the nomogram, which was also established in the “rms” package in the R program.
Statistical analysis
Descriptive statistics for the gene expression levels were presented as mean ± standard deviation (SD). Differences in gene expression levels between the individual groups were analyzed using Student’s t test for normally distributed continuous data and the Mann–Whitney test for non-normally distributed continuous data. When the number of groups is greater than or equals to three, one-way ANOVA was also considered for comparing differences. Parameters screened significance for OS in HCC patients by the LASSO model in GSE14520 were included in univariate and multivariate Cox regression. Associations between candidate genes and OS in HCC patients were also validated in TCGA-LIHC dataset by Cox model. The results were reported as hazard ratios (HR) with 95% CIs. The Kaplan-Meier method was used to compare OS between different groups, and the log-rank test was used to estimate the significances in survival between groups. Stata software version 16.0 (Stata Corp LLC, Texas, USA) was used for other statistics. P < 0.05 (two-tailed) was considered significant for all tests.
Results
Common genes identification and enrichment
DEGs of GSE14520 and GSE101685 and LIHC in TCGA profiles were identified, and common genes were calculated by Venn diagram. Two tumor samples (GSM2712021 and GSM2712027) in GSE101685 were deleted from the DEG analysis process based on the quality assessment of the RLE and NUSE methods (Supplemental Figure S1). Finally, 653 common DEGs were included (Figure 1(a)). Using the clusterProfiler package in the R program, Kyoto Encyclopedia of Genes and Genomes (KEGG) pathways of these 653 common genes were investigated in GSE14520. The top 20 functional pathways of these common genes enriched were presented in Figure 1(b), and the significant genes enriched in the top 20 functional pathways were summarized in Table 2. As described in Figure 1, the most significant genes (n = 65) were enriched in metabolic pathways (p = 0.001 and adjusted p = 0.048, Figure 1(c)).

In GSE14520, LIHC and GSE101685, 653 differential expressed genes (DEGs) were screened using Venn diagram (a), top 20 KEGG functional pathways were enriched by clusterProfiler package in R program (b), and the significances of metabolic pathways with most significant genes enriched (c).
Significant genes enriched in the top 20 functional pathways.

Identification of potential candidates for OS in HCC
In GSE14520, parameters including age, gender, alanine aminotransferase (ALT), cirrhosis, main tumor size, multinodular status, TNM staging, Barcelona Clinic Liver Cancer (BCLC) staging, Cancer of the Liver Italian Program (CLIP) staging, AFP and 65 significant genes enriched in metabolic pathways were included in the LASSO model (Figure 2(a)). To assess the coefficient of these parameters, BCLC staging and TNM staging were recruited when lambda.1se was used. After five-fold cross-validation, variables including HMGCS2 (3-hydroxy-3-methylglutaryl-coenzyme A synthase 2), UGP2 (UDP-glucose pyrophosphorylase), BCLC staging and TNM staging were screened to be linked to OS in HCC patients when λ took the minimum value (Figure 2(a)). The regression coefficient plot of factors by LASSO is shown in Figure 2(b).
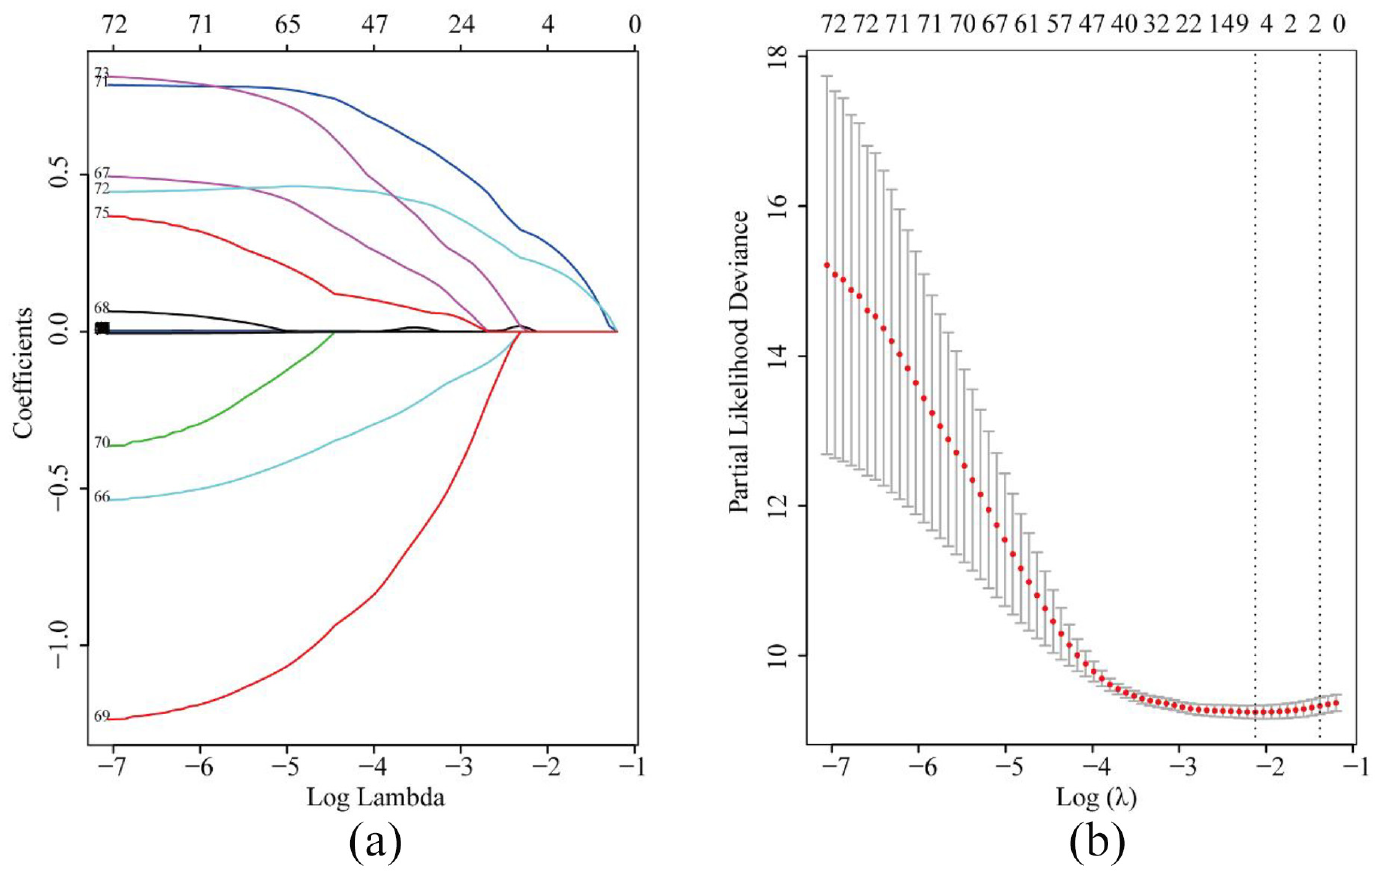
Parameters including significant genes in metabolic pathways and clinical data selection through LASSO regression (a) and elucidation of LASSO coefficient profiles for selected factors (b).
As shown in Table 3, HMGCS2 (median cut-off), UGP2 (median cut-off), BCLC staging and TNM staging were all potential parameters associated with OS in HCC patients (all p < 0.05, Table 3). When these variables were included in the multivariate Cox model, high HMGCS2 levels in tumor tissues might contribute to favorable OS in HCC patients after adjusting for BCLC staging and TNM staging (HR = 0.57, 95% CI = 0.34–0.94, p = 0.029, Table 3). In TCGA-LIHC dataset, univariate Cox regression indicated that HMGCS2, UGP2, AJCC staging, and vascular invasion might be factors correlated with OS in HCC patients (all p < 0.05, Table 3). After adjusting for AJCC staging and vascular invasion conditions, HMGCS2 showed potential protective impact on OS in HCC patients in multivariate Cox model (HR = 0.63, 95% CI = 0.39–1.0, p = 0.05, Table 3). Unfortunately, UGP2 showed no significance for OS in HCC patients in the multivariate model, both in GSE14520 and TCGA-LIHC datasets (p = 0.844 and p = 0.279, respectively, Table 3).
Cox regression models for identification of parameters associated with OS in HCC patients in GSE14520 and in the TCGA.

Only variables significantly associated with OS in HCC patients screened by univariate Cox regression were presented and included in the multivariate model.
Variables including HMGCS2, UGP2, age, gender, body mass index, family history of cancer, risk factors, pathological grade, AJCC stage, vascular invasion, child-pugh stage, AFP, hepatic inflammation, and Ishak scores were included in the univariate Cox regression.
Associations between HMGCS2 and OS in HCC patients
HMGCS2 mRNA was significantly decreased in tumor tissues compared to nontumor tissues in multiple GEO series (all p < 0.05, Figure 3(a)). Moreover, HMGCS2 mRNA was also downregulated in PBMCs in HCC patients compared to that in non-HCC patients (chronic hepatitis B patients and healthy individuals) in GSE58208 (p < 0.0001, Figure 3(a)), while no difference of HMGCS2 from PBMCs between healthy individuals and HCC patients were observed in GSE49515 (p > 0.05, Figure 3(a)). In the HPA database, the antibody staining of HMGCS2 protein was high in 6/9 healthy individuals and 3/14 HCC patients (chi-square p = 0.03, Figure 3(b)).
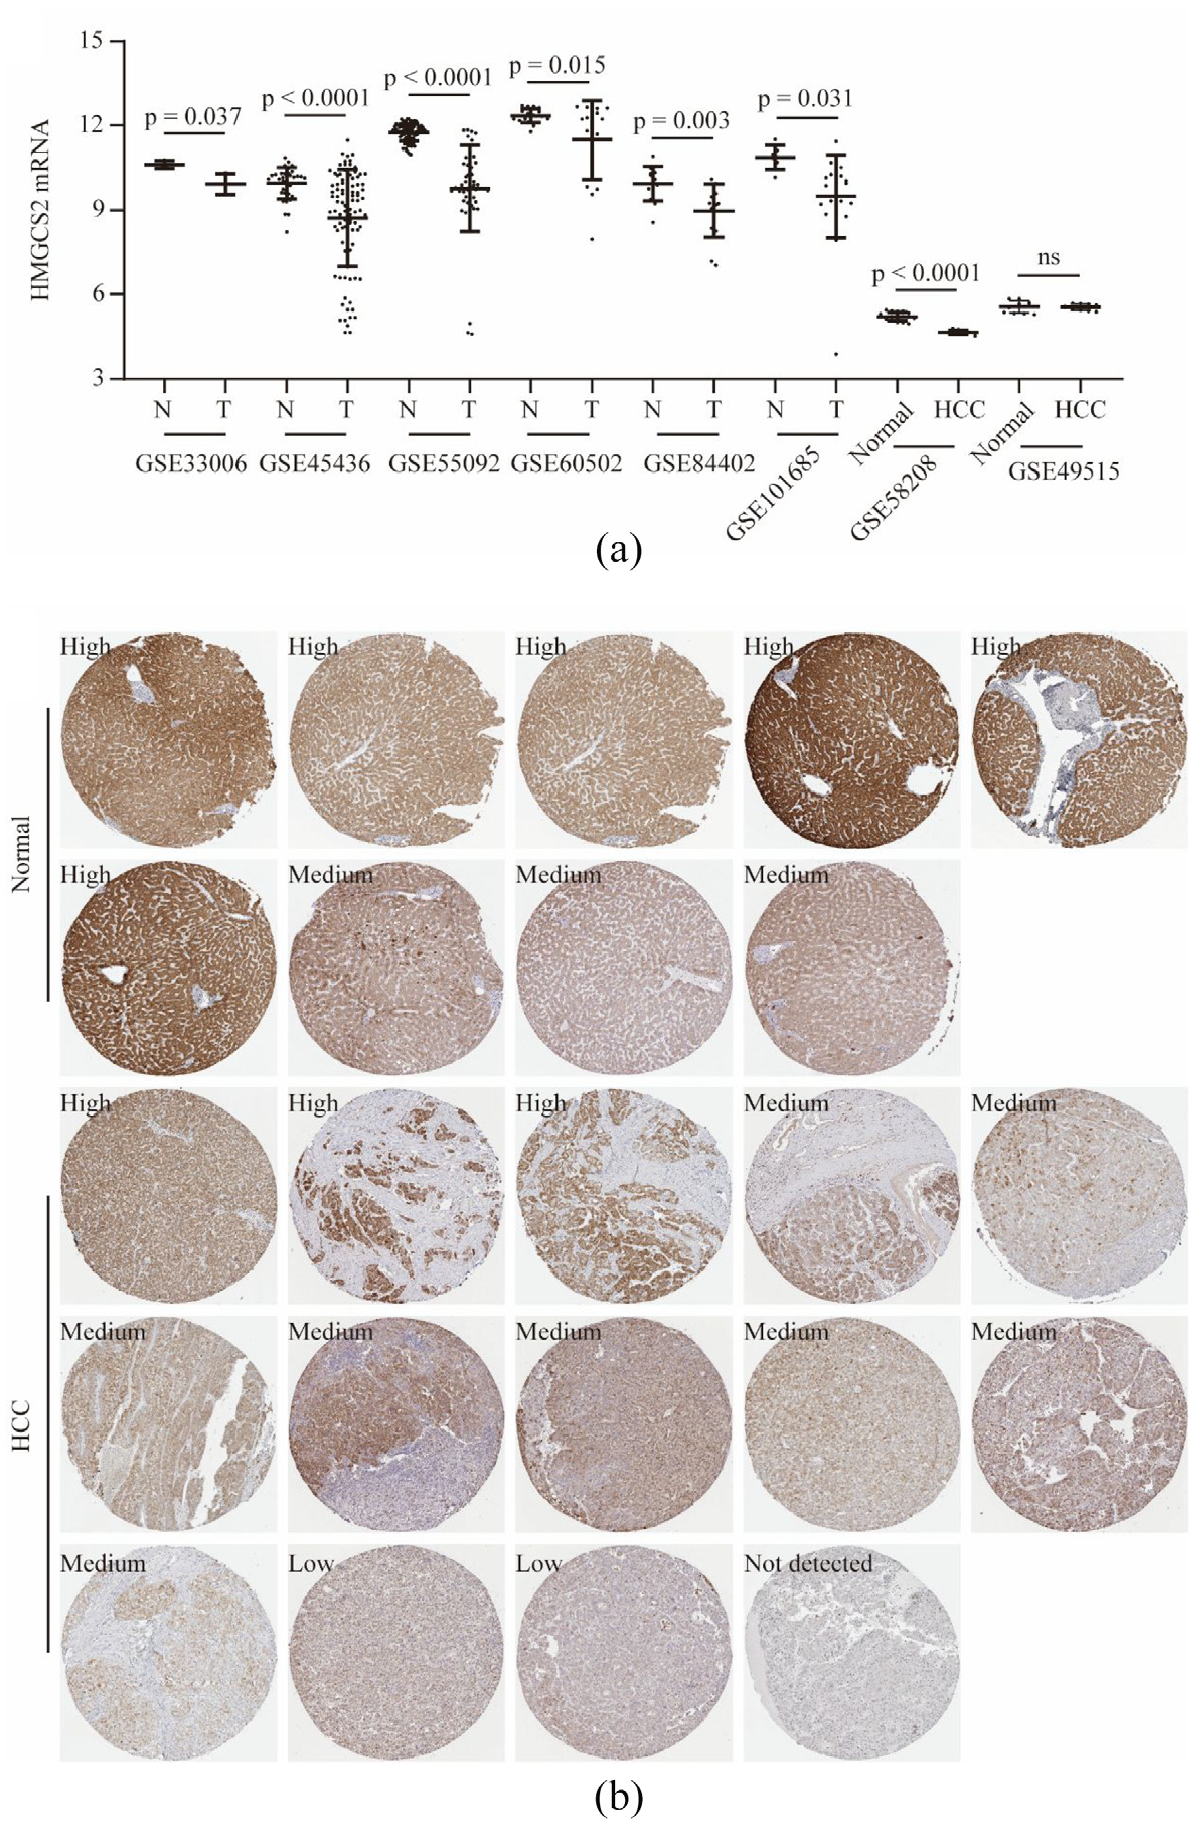
HMGCS2 mRNA was significantly lower in tumor tissues compared to that in nontumor tissues in HCC patients in GEO series, namely, GSE33006, GSE45436, GSE55092, GSE60502, GSE84402, and GSE101685 (all p < 0.05, a). In GSE58208, HMGCS2 mRNA was significantly downregulated in peripheral blood mononuclear cells (PBMCs) in HCC patients (p < 0.0001, a), while no significance was found in GSE49515 (p > 0.05, a). In the HPA database, the antibody staining of HMGCS2 protein was high in 6/9 normal livers and 3/14 HCC cases (chi-square p = 0.03, b).
In the GSE14520 dataset, HMGCS2 mRNA was significantly downregulated in tumor tissues compared to that in nontumor tissues (p < 0.0001, Figure 4(a)). Kaplan–Meier analysis revealed that HCC patients with low expression of HMGCS2 mRNA in tumors had unfavorable OS compared with those with high HMGCS2 (p = 0.0001, Figure 4(b)). In addition, we validate these findings in TCGA dataset. As shown in Figure 4(c), HMGCS2 mRNA expression was significantly lower expressed in HCC tumors than that in nontumors in TCGA dataset (p < 0.0001, Figure 4(c)). Survival analysis with the log-rank method also indicated that HCC patients with low HMGCS2 expression in tumors had significantly worse OS than those with high HMGCS2 expression (p = 0.0002, Figure 4(d)).
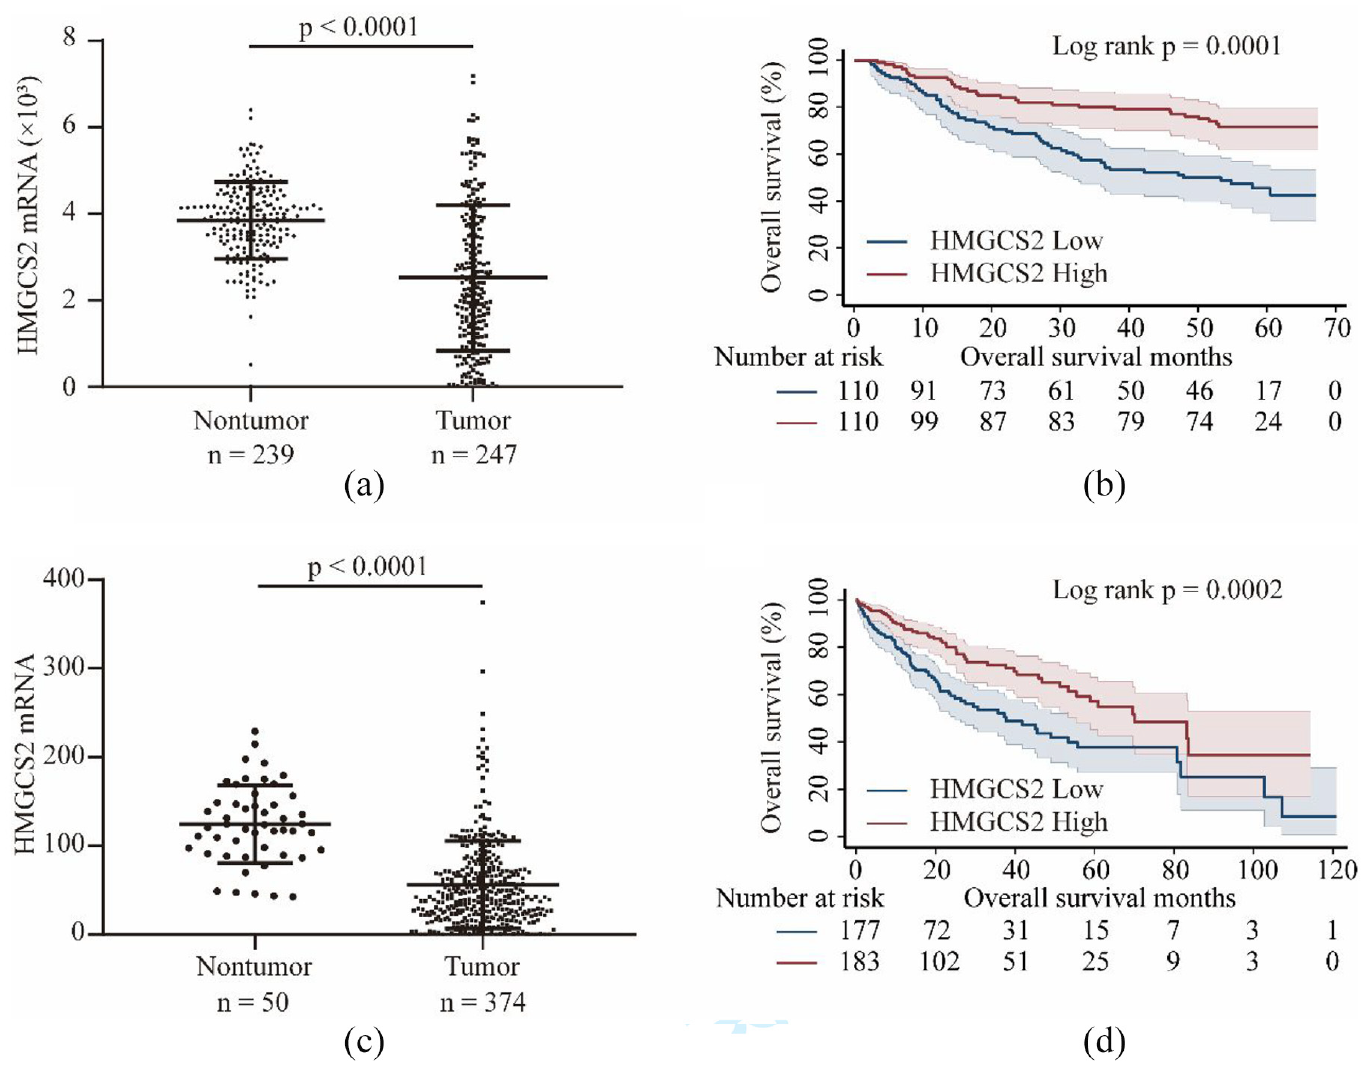
In GSE14520 dataset, HMGCS2 mRNA was significantly downregulated in tumor tissues than that in nontumor tissues (2521.42 ± 1683.83 vs 3846.15 ± 887.40, p < 0.0001, a) and low HMGCS2 levels in tumors contributed to unfavorable overall survival (OS) in HCC patients (b). In TCGA-LICH profile, HMGCS2 mRNA was also significantly lower in HCC tumors than that in nontumor tissues (56.17 ± 49.39 vs 124.52 ± 44.06, p < 0.0001, c) and was associated with worse OS (d).
A nomogram model was established according to independent parameters including HMGCS2, BCLC staging and TNM staging (Figure 5(a)). According to the upper scale of each independent risk factor (−0.4 to 0.7), the corresponding score of this risk factor could be determined. The total score was obtained by adding the scores of each factor. Projecting downward from the total score, the corresponding mortality risk prediction probability value could be obtained. For example, in a patient with TNM stage III, BCLC stage 0–A and low HMGCS2, his/her total score was 0.685, and his/her mortality risk at 1-year, 3-year, and 5-year was 0.187, 0.492, and 0.634, respectively (Figure 5(a)). The concordance index of this model was 0.70 ± 0.03 (95% CI = 0.64–0.76). Calibration curves of 1-year, 3-year, and 5-year for internal verification of this nomogram with bootstrapping are described in Figure 5(b) to (d), respectively. The calibration curve displayed a good consistency between actual OS and predicted OS in 1-year, 3-year, and 5-year (Figure 5(b) to (d)).

Screened by Cox regression model, TNM staging, BCLC staging, and HMGCS2 were included in competing risk model with nomogram for OS from HCC patients in GSE14520 (a), calibration curves for prediction 1-year (b), 3-year (c), and 5-year OS (d) in HCC patients in GSE14520.
Associations between HMGCS2 and clinicopathological features in HCC patients
In GSE14520, HMGCS2 mRNA expression was compared by clinicopathological features. As shown in Figure 5, HMGCS2 mRNA was significantly downregulated in HCC patients with AFP >300 ng/ml, main tumor size >5 cm and/or multinodular (p = 0.013, p = 0.01, and p = 0.002, respectively, Figure 6(a) to (c)). Moreover, HMGCS2 mRNA was significantly lower in HCC patients with BCLC staging B and C than in those with BCLC staging 0–A (p = 0.006 and p = 0.017, respectively, Figure 6(d)). Similarly, HMGCS2 mRNA was significantly decreased in HCC patients with CLIP staging 1 and ≥2 compared to those with CLIP staging 0 (p = 0.002 and p < 0.001, respectively, Figure 6(e)). Additionally, HMGCS2 mRNA was significantly decreased according to the increase in TNM staging in HCC patients (all p < 0.05, Figure 6(f)).

In GSE14520, HMGCS2 expression comparison by clinico-pathological features. HMGCS2 mRNA was significantly downregulated in HCC patients with AFP >300 ng/ml (a), main tumor size >5 cm (b), multinodular status (c), advanced BCLC staging (d), advanced TNM staging (e), and advanced CLIP staging (f).
Discussion
Metabolic reprogramming has been considered a hallmark in the cancer process. 28 Activation of oncogenes and loss of tumor suppressor genes enhanced metabolic reprogramming in human malignancies, leading to increased nutrient consumption, which could provide energy and promote biosynthetic pathways. Impaired metabolic pathways involved in cell proliferation and tumorigenesis progression,29−31 are consistently reprogrammed by mutations in MYC, TP53, Ras-related oncogenes, and the LKB1-AMP kinase (AMPK) and PI3 kinase (PI3K) signaling pathways. 32 Our results based on three datasets also indicated that metabolic pathways were a vital mechanism in the development of HCC.
HMGCS2 expression in human cancers is different. Upregulated HMGCS2 was found in estrogen receptor-negative breast cancer and apocrine carcinoma in the breast,33,34 whereas downregulated HMGCS2 was observed in poorly differentiated colon cancer. 35 Our results indicated that HMGCS2 was significantly downregulated in tumor tissues and expressed at lower levels in HCC patients with advanced pathological characteristics and clinical staging. While the expression of HMGCS2 mRNA in PBMCs from HCC patients was not verified. HMGCS2 downregulation in tumors contributed to unfavorable survival in HCC patients. These findings were in line with previous reports.36,37 In clinical practice, a low level of HMGCS2 in tumors was correlated with poor tumor differentiation, vascular invasion, higher pathological grades and clinical stages as well as worse survival in HCC patients.36,37 Wang et al indicated that ketogenic diet feeding could inhibit HCC tumor growth by increasing the HMGCS2 protein expression, while knockdown of HMGCS2 could enhance the cell growth ability in HCC cells. A reverse correlation was also observed between HMGCS2 expression and tumor size. 38
From an experimental perspective, HMGCS2 silencing could promote cell proliferation, migration, and xenograft tumorigenesis by enhancing the epithelial-mesenchymal transition process, activating the c-Myc/cyclinD1 and ERK/c-Jun pathways, and suppressing the caspase-dependent apoptosis pathway.36,37 HMGCS2 knockdown decreased ketone production, whereas HMGCS2 overexpression increased the level of intracellular ketones, resulting in the inhibition of cell growth and migration. 37 Moreover, a ketogenic diet strategy significantly inhibited liver cancer cell growth in mice. 37 In the hepatoma cell line HepG2, HMGCS2 could induce fatty acid β-oxidation (FAO) and ketogenesis. Additionally, RNAi-induced HMGCS2 downregulation abolished the PPARα-mediated FAO process. Moreover, HMGCS2 activation specifically induced fibroblast growth factor 21 expression. 39 Tumors from HMGCS2 knockdown HCC cells showed increased lipid synthesis-related markers expression and increased lipids amount (fatty acids, triglycerides, and cholesterol), which were correlated with tumor weight. 38 Taken together, HMGCS2 might function as a tumor suppressor mainly through involvement in the regulation of ketone body signaling and interaction with the PPARα pathway. 39
Additionally, HMGCS2 was significantly decreased in colorectal cancers and correlated with microvessel density, which indicated that HMGCS2 might negatively regulate tumor angiogenesis. In rectal cancer received neoadjuvant concurrent chemoradiotherapy, HMGCS2 overexpression was significantly associated with advanced tumor or nodal status and lower tumor regression grade and indicated poor prognosis for disease-free survival, local recurrence-free survival, and metastasis-free survival. 40 Knockdown of HMGCS2 contributed to endothelial cell tube formation in HT-29 cells. 41 Conversely, a report by Chen et al indicated that higher HMGCS2 levels were significantly associated with advanced TNM stage, lymph node metastasis and tumor recurrence and poor survival in colorectal cancer patients and in oral squamous cell carcinoma patients. 42 In prostate cancer, low HMGCS2 expression was significantly associated with advanced tumor pathological grade, distant metastasis and shorter disease-free survival and recurrence-free survival. 43 In esophageal squamous cell carcinoma (ESCC) patients, HMGCS2 downregulation occurred and was correlated with tumor cell differentiation, Pt status, and TNM stage. Downregulation of HMGCS2 contributed to a poorer OS and relapse-free survival in ESCC patients. 44
Even though controversial findings of HMGCS2 exist in colon cancer,35,41,42 a consensus has been reached that HMGCS2 is downregulated in HCC tumors and contributes to cancer aggressiveness and unfavorable outcomes in HCC patients. However, our research has some limitations. Firstly, no experiments were performed to address the effects of HMGCS2 on hepatoma cellular functions. Secondly, our follow-up data of HCC patients were not available, and our results from TCGA and GSE14520 datasets were not verified by prospective cohorts. Thirdly, all HCC patients in GSE14520 were HBV related, the extrapolation of this study needs further investigation. Hence, we suggest that well-designed studies with large samples for investigating the predictive value of HMGCS2 are essentially needed.
In addition, our univariate Cox regression model revealed that a low level of UGP2 in tumor tissues might be a risk factor for OS in HCC patients. However, no significance was found in GSE14520 and the TCGA datasets when adjusting for cancer staging and HMGCS2 expression in the multivariate model. Recently, a single gene-centered study showed that UGP2 mRNA and protein were significantly downregulated in HCC tumors, and low UGP2 contributed to advanced tumor staging, aggressive cancer clinicopathology, and unfavorable survival in HCC patients. 45 Our findings were partly consistent with previous literature; however, the roles of UGP2 in HCC development still need to be elucidated in the future.
Supplemental Material
sj-docx-1-sci-10.1177_00368504211031749 – Supplemental material for HMGCS2 in metabolic pathways was associated with overall survival in hepatocellular carcinoma: A LASSO-derived study
Supplemental material, sj-docx-1-sci-10.1177_00368504211031749 for HMGCS2 in metabolic pathways was associated with overall survival in hepatocellular carcinoma: A LASSO-derived study by Rongrong Ding, Tianyou Chen, Yuan Zhang, Xiaorong Chen, Liping Zhuang and Zongguo Yang in Science Progress
Footnotes
Declaration of conflicting interests
The author(s) declared no potential conflicts of interest with respect to the research, authorship, and/or publication of this article.
Funding
The author(s) disclosed receipt of the following financial support for the research, authorship, and/or publication of this article: This work was supported by the National Natural Science Foundation of China (81803901 and 81903986). The funders had no role in study design, data collection and analysis, decision to publish, or preparation of the manuscript.
Ethics statement
This study is a secondary analysis based on public datasets. As declared in the original datasets, every subject provided verified informed consent. The informed consents and study protocol were reviewed and approved by Institutional Review Board of the participating institutes.
Data availability
Datasets of the current study are available from The Cancer Genome Atlas (https://portal.gdc.cancer.gov/) and the NCBI Gene Expression Omnibus (![]() ). The combined datasets were available from corresponding authors with reasonable request.
). The combined datasets were available from corresponding authors with reasonable request.
Supplemental material
Supplemental material for this article is available online.
Author biographies
References
Supplementary Material
Please find the following supplemental material available below.
For Open Access articles published under a Creative Commons License, all supplemental material carries the same license as the article it is associated with.
For non-Open Access articles published, all supplemental material carries a non-exclusive license, and permission requests for re-use of supplemental material or any part of supplemental material shall be sent directly to the copyright owner as specified in the copyright notice associated with the article.