
Abstract
To investigate the characteristics of pressure ulcer microcirculation in SCI patients with pressure ulcer, and to provide evidence for the treatment of pressure ulcer in patients with SCI. Group 1 (n = 12) SCI patients with pressure ulcer, 23 pressure ulcers were included. Group 2 (n = 15) SCI patients without pressure ulcer and the control group (n = 16) healthy adults. The application of laser Doppler perfusion imaging system (Moor FLPI) detector to the microcirculation perfusion of the sacrum area of the control group, the observation group 2 and the pressure ulcer site of the observation group 1, record the microcirculation perfusion (PU), The data of microcirculation perfusion (PU) were compared and analyzed. The correlation between microcirculation perfusion and healing time of pressure ulcer was analyzed. (1) The microcirculation perfusion was highest in the pressure ulcer center. (2) SCI patients and healthy adults had no significant difference of microcirculation perfusion at sacrococcygeal skin. (3) The lower the microcirculation perfusion of the pressure ulcer center, the longer the healing time of pressure ulcer. The healing time and the microcirculation perfusion of pressure ulcer center was negatively correlated. Microcirculation perfusion detection is a noninvasive and effective method for the determination of the scope of pressure ulcer, detection and direction judgment of pressure ulcer sinus tract, monitoring and guidance of pressure ulcer treatment, and prediction of the healing time of pressure ulcer.
Introduction
Spinal cord injury (SCI) is a structural and functional impairment of the spinal cord with a variety of causes, resulting in impaired motor, sensory, sphincter, and autonomic dysfunction. SCI is a highly disabling disease. There are 15–40 people suffering from SCI per million people per year worldwide. 1 In 2017, the incidence and prevalence of traumatic SCI in China were 9.51 per 100,000 and 340.10 per 100,000, respectively. 2 SCI brings a heavy burden to patients, families, and society. Pulmonary infections, autonomic nerve reflexes, urinary tract infections, venous thrombosis of the lower extremities, neuropathic pain, spasms, heterotopic ossification, pressure ulcer, and neurogenic bladder complications may occur during each course of SCI.3,4
Pressure ulcer is one of the most common complications in hospitalized patients, especially long-term bedridden patients. The reported incidence of a pressure ulcer in hospitalized patients is 3.1%–14.1%, and the incidence of pressure ulcer in elderly patients is 11.0%–26.0%. The mortality rate also increases by six times,5–9 and mechanical ventilation in patients with pressure ulcer has a rate of 15.5%. 10 Common pressure ulcer sites include the sacrococcygeal region, hip and buttocks. Domestic data show that the incidence of pressure ulcers in patients with spinal cord injury is up to 25%–85%. 11 Foreign investigations have shown that within 1 year after spinal cord injury, 28.1%–41% of patients will develop pressure sores of varying degrees.12–14 Pressure ulcer is the most common complication of chronic SCI patients, and the sacrococcygeal region is the most common site.
Microcirculation is refers to the circulation system between micro artery and vein in the part of typical microcirculation of arteriole, after before the arterioles and capillaries sphincter, true capillaries, the blood capillaries, move—venous anastomosis and micro vein, the microvascular diameter <0.3 mm. The fundamental function of microcirculation is to carry on the material exchange between blood and tissue, its role includes: before the arterioles and capillaries sphincter of tube wall smooth muscle of the ingredients, made after the opening of the true blood capillary, thereby to local tissue and blood flow perfusion plays a decisive role.
Microcirculation has the characteristics of rhythmic movement, some scholars compared it to “second heart” or “muscle pump,”5–8,12 and its movement has two-way communication, may the arteriole, capillary perfusion with regulation function of advantage. Therefore, microvessels regulate blood circulation. The maintenance of vascular function is important.
Pressure ulcers occur in the skin and/or potentially subcutaneous soft tissue damage. Pressure causes local blood circulation problems. Literature showed that local skin blood perfusion significantly decreased after 2 h of skin compression. 9
Laser Doppler microcirculation detection can clearly shows microcirculation perfusion with the advantages of high temporal resolution and dynamic detection of blood microcirculation perfusion, as well as non-invasive and simple operation. Its working principle is: the transmission laser by host, widely scattered to skin tissue is detected, the stationary state organization reflected back to laser wavelength is changeless, and the movement of blood cells reflected back to part of the laser wavelength change (i.e. the Doppler shift effect). The frequency distribution and extent of the change in the wavelength are related to the speed and amount of blood cells moving, and the information is converted by signal, that is, the amount of blood perfusion in the skin.
Sacrococcygeal pressure ulcer is the most common site in patients with SCI, followed by the ischial tuberosity, calcaneus, and other parts of the bone. In this study, Moor FLPI laser Doppler scanning speckle full frame real-time imaging system was used to detect the microcirculation in the site of pressure ulcer and the sacrococcygeal region both of patients with spinal cord injury and healthy adult.
Material and methods
Material
Inclusion and exclusion criteria
Observation group 1 Inclusion criteria: observation group 1: patients with spinal cord injury and pressure ulcer. Observation group 2: patients with spinal cord injury without pressure ulcer. Control group: healthy adults.
Exclusion criteria: Patients with severe cardiovascular and cerebrovascular diseases, deep venous thrombosis of lower limbs, diabetes, lupus erythematous, malignant tumors, and other diseases were excluded locally. Patients taking drugs that affect blood circulation. Partial skin damage and infection (observation group 2 and control group). People with fever. Patients over the age of 70.
China’s ministry of finance supports this project. The project number is 2015CZ5.
All participants signed informed consent.
Observation group 1
According to the inclusion and exclusion criteria, 12 patients with SCI and pressure ulcer, including 11 males and 1 female aged 19–61 years, with an average age of 39.8 ± 11.74 years, who admitted in our inpatient ward were enrolled. Total pressure ulcer was indicated in 23 cases, of which 4 occurred in-hospital, the remaining 19 cases were occurred outside the hospital. Stage of pressure ulcer was evaluated according to the latest guidelines for pressure ulcer (in 2016) (Table 1).
Basic information.

Is the comparison of the injury degree composition ratio between the two groups under the control of injury level.
Is the comparison of the injury level composition ratio between two groups under the control of injury degree.
Observation group 2
According to inclusion and exclusion criteria, 15 patients with spinal cord injury were enrolled in this study. There were 2 females, aged 25–54 years, with an average age of 39.5 ± 9.89 years.
Control group
According to inclusion and exclusion criteria, 16 healthy adults were selected. There were 10 males and 6 females, aged 24–48 years, with an average age of 29 ± 6.18 years.
Methods
This is a prospective study.
Braden Scale
Patients in observation groups 1 and 2 with SCI were scored using the Braden Scale (6–23 points) to assess the degree of pressure ulcer risk using the following criteria: Very High Risk: Total Score of 9 or less. High Risk: Total Score of 10–12. Moderate Risk: Total Score of 13–14. Mild Risk: Total Score of 15–18. No Risk: Total Score of 19–23. 13
Microcirculation detection equipment and methods
The Moor FLPI laser Doppler microcirculation scanner speckle full-frame real-time imaging system (Moor, UK) was used to evaluate pressure ulcer in patients with pressure ulcer sites and SCI in patients with sacrococcygeal (pressure ulcer sites) as well as in healthy adults using sacrococcygeal real-time microcirculation testing.
The Moor FLPI laser Doppler microcirculation scanner speckle full-frame real-time imaging system parameters were as follows: (1) Scan speed of 25 frames per second, dynamic video performance of blood flow perfusion changes. (2) Laser parameters: 785 ± 10 nm solid-state laser transmitters. (3) Scanning range: 0.5 cm2 × 0.7 cm2–8 cm2 × 12 cm2. (4) Scanning distance: 15–45 cm. (5) Measuring depth: 5 mm. The local pressure test was performed before at least 1 h. The microcirculation detections were carried out in the testing room under standard conditions with relatively constant temperature and humidity. Determine the room temperature before testing, adjust the amount of natural light with curtains according to the intensity of indoor light, and close the artificial light source at the same time. The subjects’ body temperature was measured before the test, and the subjects with normal body temperature could be tested for laser Doppler microcirculation perfusion.
Connect the USB data interface and 1394 interface of the scanning head to the computer, adjust the scanning head perpendicular to the measured surface, and ensure the distance between the scanning window and the measured surface is between 20 and 45 cm. When the scanning head is powered on, run the FLPI3.0 software and enter the measuring interface. Click the setting button on the toolbar of the button to enter the software-setting interface.
Watching the interface of real-time laser image, adjust the position the parts under test in the real-time infrared image middle, clockwise rotation control device, the laser image to adjust to the brightest state, adjust the scan head image magnification to maximum Zoom knob; Then adjust the Focus knob to make the image display the most clear. Adjust the Zoom knob again, adjust the image to the appropriate size, and finally rotate the adjusting device clockwise again to adjust the laser image to the darkest. In the software setup interface, click the “Enable intensity overlay” selection box in the lower right corner to see blue and red spots on the laser images. Check the Gain value automatically, after being instrument is stable, the most clear and laser detection area in the image boundary image just a few red spots for instruments and equipment and the subjects were stable, select “repeat imaging” Settings, imaging number is set to 10, imaging interval to 4 s. The test time was 3–5 min to record the microcirculation blood perfusion volume (PU).
Selection and Moor laser Doppler blood flow perfusion to speckle image matching moorFLPI—2 ReviewV4.0 analysis software, the amount of microcirculation perfusion open laser Doppler scanning image file, data analysis into the interface. Set the square area of interest (Range of Interesting, ROI), click the data statistics button, open the data statistics window, and get the mean value of microcirculation blood perfusion in different parts, in Perfusion Unit (PU).
Observation group 1 set the following three square ROI areas (see Figure 1): the pressure ulcer center (ROI 1), pressure ulcer edge (ROI 2), and site away from the pressure ulcer (ROI 3). Observation group 2 and the control group also set up the following three ROIs (see Figure 2): coccygeal tip (ROI 1), away from the coccygeal tip at 3 cm (ROI 2) and away from the coccygeal tip at 10 cm (ROI 3). The detection time to record microcirculation perfusion (PU) was 3–5 min.
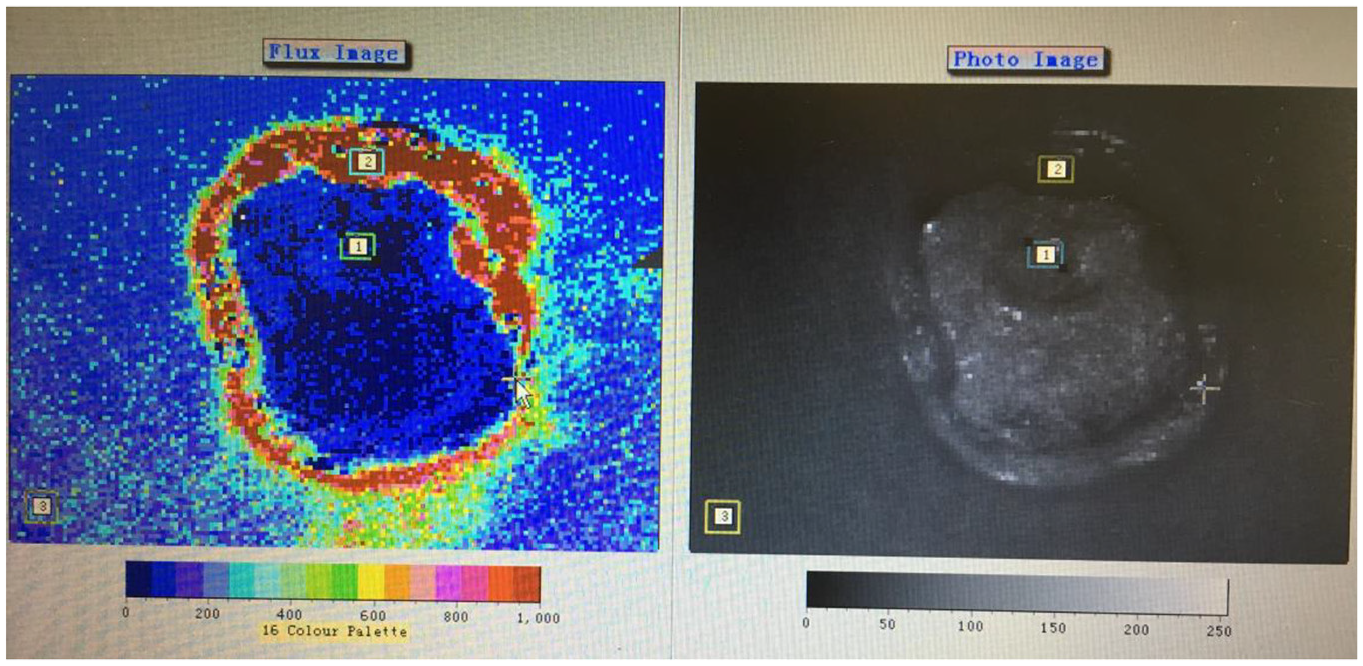
Microcirculation detection of a grade IV pressure ulcer. 1, 2, 3 shows three square ROI areas: the pressure ulcer center (ROI 1), pressure ulcer edge (ROI 2) and site away from the pressure ulcer (ROI 3).
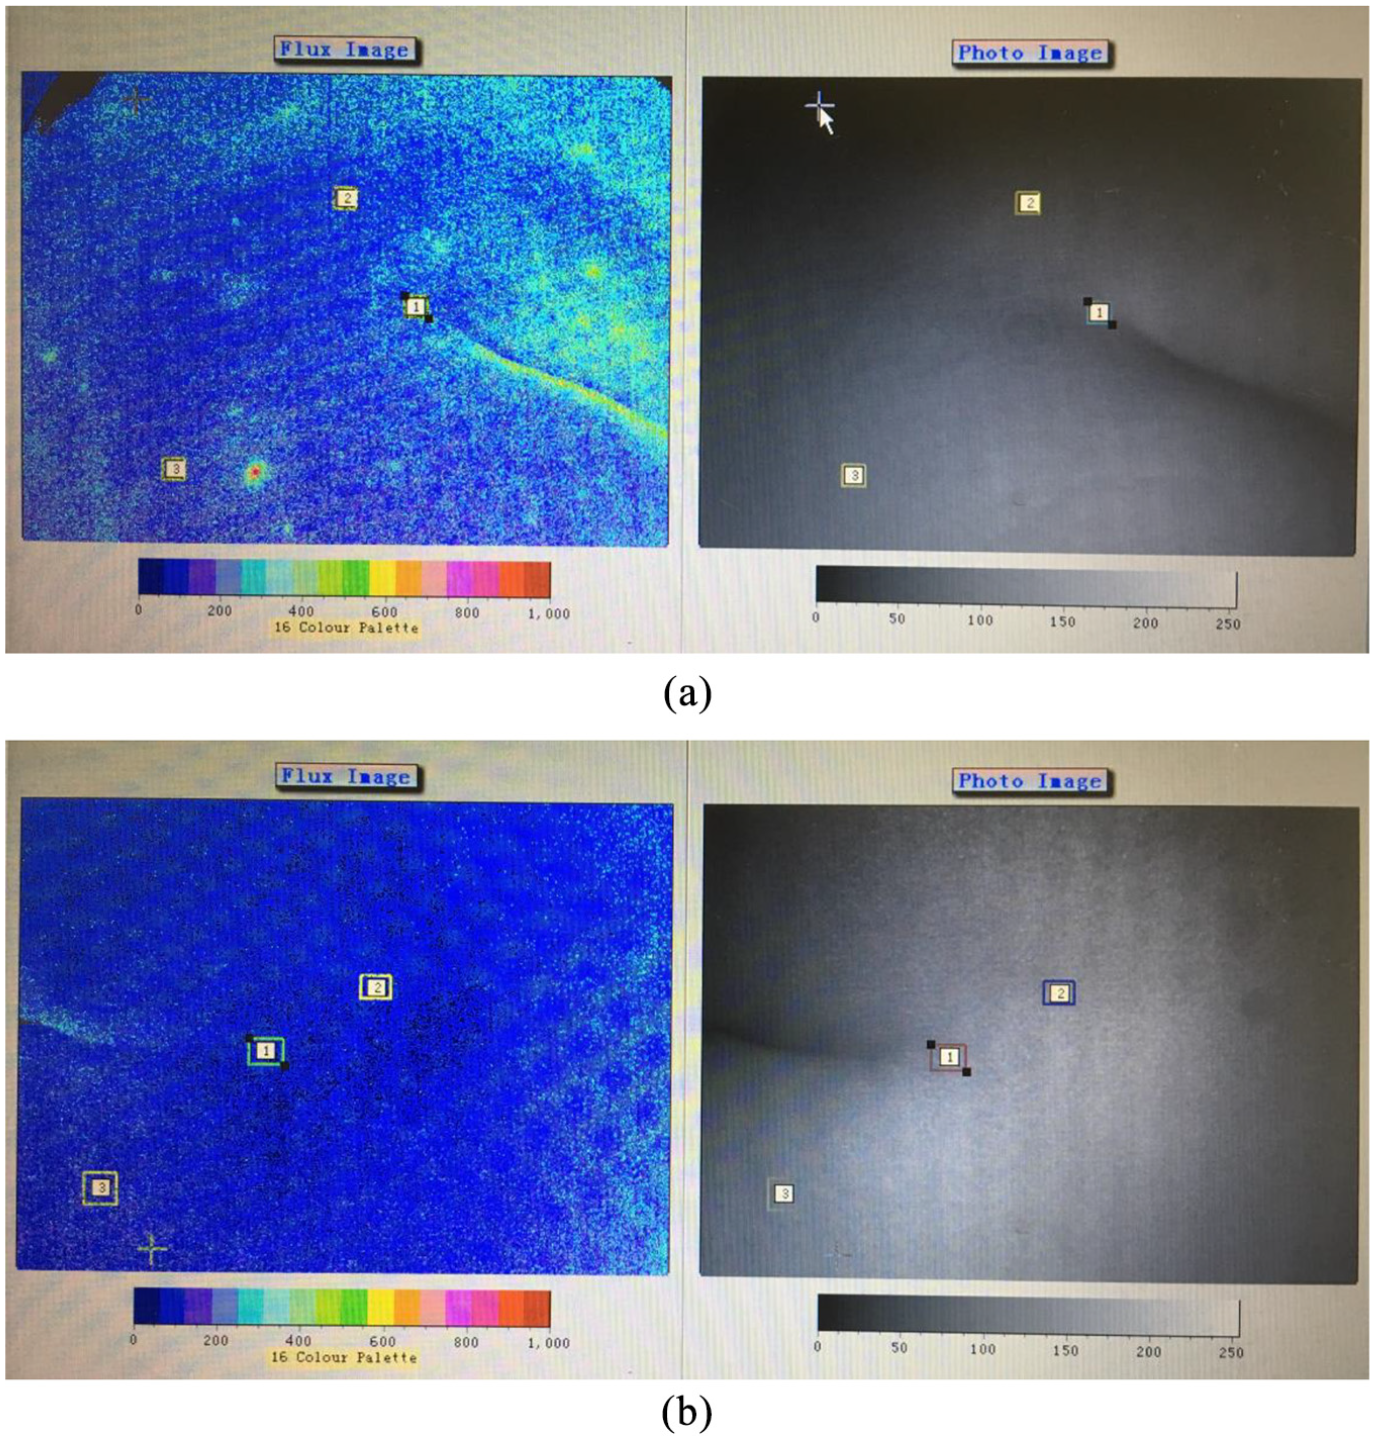
(a) Microcirculation detection of a SCI patient without pressure ulcer. 1, 2, 3 shows three square ROI areas: coccygeal tip (ROI 1), away from the coccygeal tip at 3 cm (ROI 2) and away from the coccygeal tip at 10 cm (ROI 3). (b) Microcirculation detection of a SCI patient without pressure ulcer. 1, 2, 3 shows three square ROI areas: coccygeal tip (ROI 1), away from the coccygeal tip at 3 cm (ROI 2) and away from the coccygeal tip at 10 cm (ROI 3).
Selection of two cases of spinal cord injury patients with grade III pressure ulcer, pressure ulcer in dynamic observation of the healing center (ROI 1), the borders of stress injury (ROI 2), and away from the pressure ulcer (ROI 3) amount of microcirculation perfusion (PU).
Operators have passed the training and testing of microcirculation detection equipment manufacturers.
Statistical analysis
Statistical analysis was carried out using SPSS 22.0 statistical software (IBM, New York, USA).
The Braden scores in observation groups 1 and 2 are expressed as the mean ± standard deviation. The K–S normal distribution test between groups was compared using an independent sample t test. Microcirculation perfusion measurement data are expressed as the mean ± SD, and each ROI blood flow perfusion within the group was analyzed using univariate ANOVA analysis and Bonferroni correction. The ROI blood flow perfusion in the observation group was tested by binary ANOVA. The healing time of the pressure ulcer was calculated each day and is expressed as the mean ± SD. The relationship between the ROI blood flow perfusion and healing time in observation group 1 was tested by Pearson’s linear regression analysis. P < 0.05 was considered statistically significant.
Results
Braden score comparative analysis in the observation groups
The Braden Scale is widely used to predict the risk of pressure ulcer because of its simplicity and easy operation. The Braden scores of two observation groups are shown in Table 2. The Braden scores of patients in observation group 1 were 8–16 points (9.57 ± 2.52 points), and those in observation group 2 were 8–16 points (12.4 ± 2.56 points). The Braden scores of the two groups were normally distributed according to the K–S test. The Braden scores of the two groups were measured using an independent t test, and the p-value was 0.002 (<0.05), indicating a significant difference. The Braden scores in observation group 1 with pressure ulcer were significantly lower than those in observation group 2 without pressure ulcer and the risk of pressure ulcer was also significantly increased.
Braden scores of the observation groups.

Microcirculation perfusion detection analysis
The results of microcirculation perfusion (PU) the pressure ulcer center (ROI 1), the pressure ulcer edge (ROI 2), and the region away from the pressure ulcer site (ROI 3) in observation group 1. And the results of microcirculation perfusion (PU) at coccygeal tip (ROI 1), 3 cm away from the coccygeal tip (ROI 2), and 10 cm away from the coccygeal tip (ROI 3) are shown in Table 3.
Microcirculation perfusion (PU).

Microcirculation perfusion analysis in patients with pressure ulcer
Observation group 1 microcirculation perfusion at ROI 1 (pressure ulcer center), ROI 2 (pressure ulcer margin), and ROI 3 (away from the pressure ulcer site) were measured by univariate ANOVA with Bonferroni correction. The p values of ROI 1, ROI 2, and ROI 3 were all <0.000, and the p values were all <0.05, showing significant statistical significance.
Microcirculation perfusion showed ROI 1 (1020.54 ± 640.36) > ROI 2 (920.27 ± 570.96) > ROI 3 (207.29 ± 86.53). The results showed that the microcirculation perfusion at the central of the pressure ulcer was the highest. The microcirculation perfusion at the central of the pressure ulcer and the pressure ulcer margin were significantly higher than those in the part away from the pressure ulcer (Figure 3).

Microcirculation perfusion of observation group 1.
Microcirculation perfusion analysis in patients with SCI
Observation group 2 microcirculation perfusion ROI 1 (coccyx), ROI 2 (3 cm away from the coccygeal tip), and ROI 3 (10 cm away from the coccyx) were measured by one-way ANOVA. Statistical p values of ROI 1 and ROI 2 were 0.010, ROI 1 and ROI 3 were <0.000, ROI 2 and ROI 3 were 0.002, and all p values were <0.05, showing significant statistical significance.
Microcirculation perfusion followed the order of ROI 1 (305.76 ± 114.03) > ROI 2 (217.59 ± 61.76) > ROI 3 (181.93 ± 61.90). The results showed that the cortical bone in patients with SCI at the cortical tip of the microcirculation had the highest blood flow perfusion. When the distance away from the coccyx tip increased, microcirculation perfusion decreased (Figure 4).

Microcirculation perfusion of observation group 2.
Microcirculation perfusion in healthy adults
Microcirculation perfusion in the control group ROI 1 (coccyx), ROI 2 (3 cm away from the coccyx), and ROI 3 (10 cm away from the coccyx) were measured by one-way ANOVA and Bonferroni correction. The statistical p values of ROI 1 and ROI 2 were 0.002, ROI 1 and ROI 3 were 0.001, ROI 2 and ROI 3 were 0.005, and all p values were <0.05, showing significant statistical significance.
Microcirculation perfusion followed the order of ROI 1 (271.04 ± 102.85) > ROI 2 (228.14 ± 82.49) > ROI 3 (170.62 ± 51.02). The results showed that the control group had the highest cortical microcirculation perfusion at the tip of the coccyx, which gradually decreased with an increase in distance away from the coccyx tip (Figure 5).

Microcirculation perfusion of the control group.
Microcirculation perfusion in patients with SCI and healthy adults
In observation group 2 and the control group, the microcirculation perfusion of each ROI interacted according to two-way ANOVA. The p value between groups was 0.449, and the p value of microcirculation perfusion in each part was <0.000 (p < 0.01). The results revealed no significant difference in microcirculation perfusion of the sacrococcygeal skin among patients with SCI and healthy adults. Both groups had the highest cortical microcirculation perfusion at the coccygeal tip. Microcirculation perfusion decreased gradually with increasing distance from the coccyx tip.
In observation group 2 and healthy adults, microcirculation perfusion of ROIs were measured by one-way ANOVA, and the p values were >0.05 in each group. The results showed that there was no statistically significant difference of microcirculation perfusion between patients with spinal cord injury at the same site and healthy adults (Figure 6).
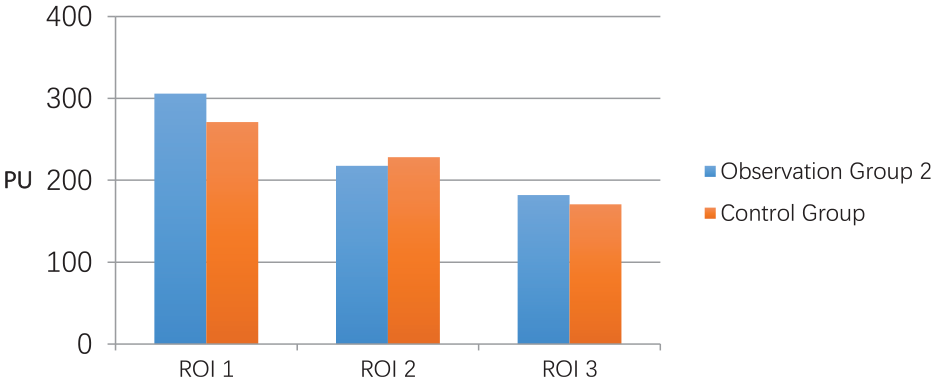
Comparison of microcirculation in observation group 2 and the control group.
Dynamic observation of microcirculation perfusion during the healing process of pressure ulcer
2.3.1 Case 1: male, 51 years old, T9 spinal cord injury (grade A), 6 cm2 × 6 cm2 grade III pressure ulcer of sacral area, healing time 54 days.
2.3.2 Case 2: male, 33 years old, C5 spinal cord injury (grade A), 5 cm2 × 5 cm2 grade III pressure ulcer of sacral area, healing time 49 days.
Can be seen from the Figure 7(a) and (b) curve in the patients with severe pressure ulcer (grade III), microcirculation flow perfusion at ROI 3 shows no obvious change, and microcirculation flow perfusion trends at ROI 1 and ROI 2 are basically identical.
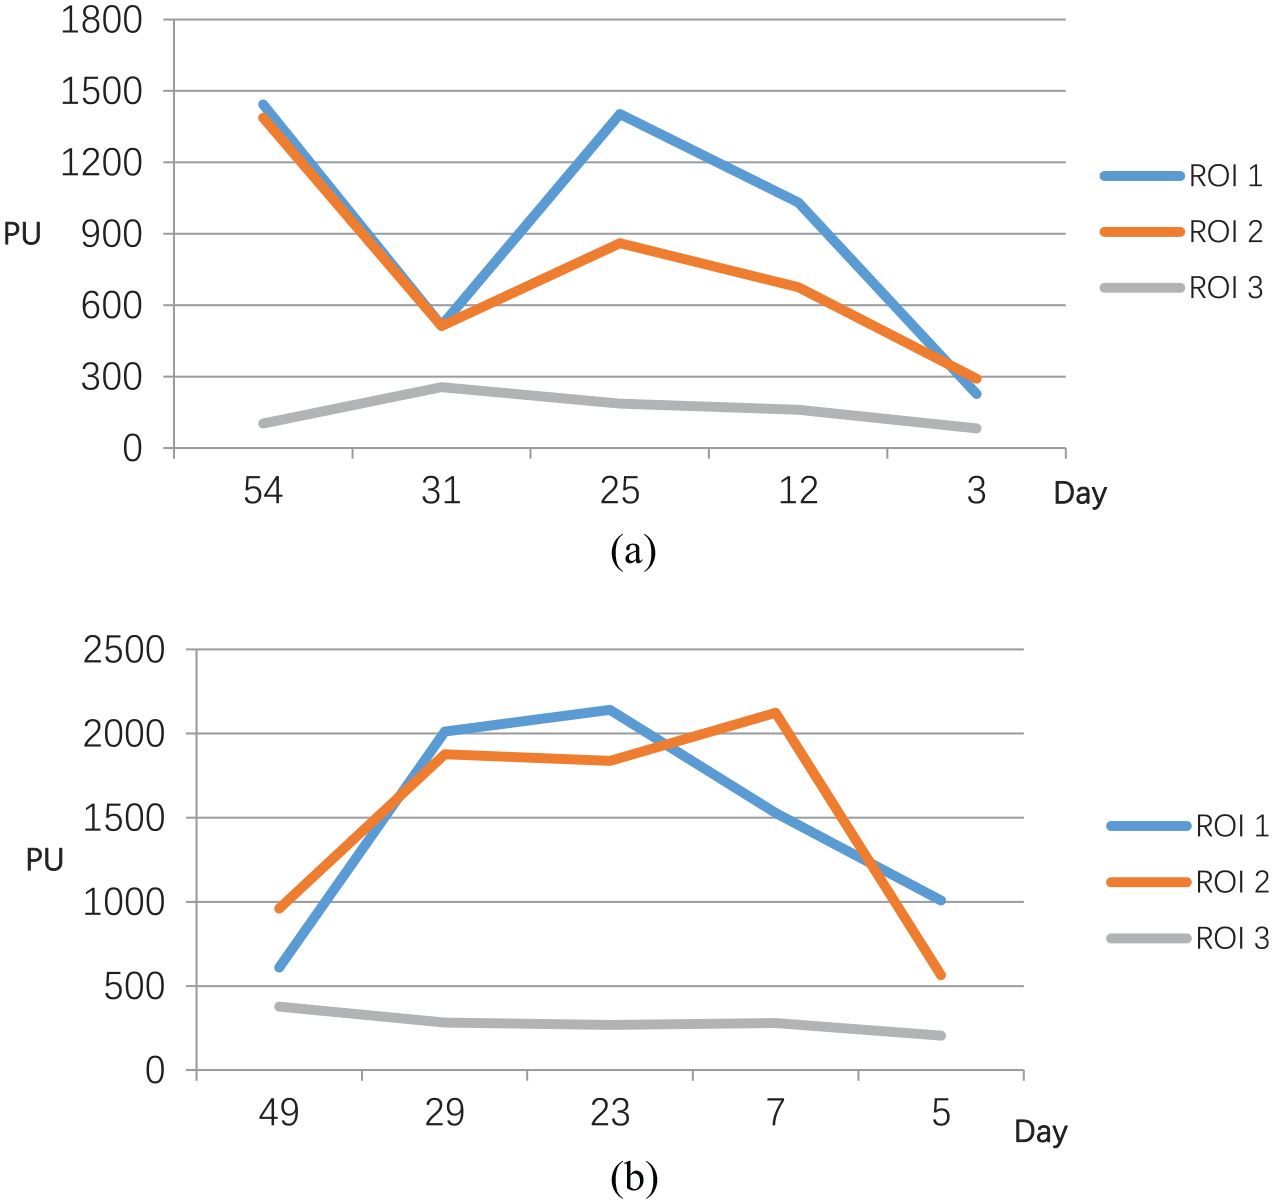
(a) Grade III pressure ulcer healing time and microcirculation blood perfusion volume and (b) Grade III pressure ulcer healing time and microcirculation blood perfusion volume.
Microcirculation perfusion and pressure ulcer healing time
Of the 23 cases with pressure ulcer, 5 cases underwent myasthenia flap transfer or debridement + VSD surgery. One case was discharged without healing. The remaining 17 cases underwent debridement with a wet dressing. The average healing time after treatment was 30.12 ± 17.34 days.
Pearson linear correlation analysis showed that there was a significant correlation between microcirculation perfusion at ROI1 and the healing time of pressure ulcer, and the correlation coefficient was 0.020 (<0.05), showing a negative correlation. The correlation coefficients of microcirculation perfusion at ROI2, ROI3 and the healing time of pressure ulcer were 0.193 and 0.189, respectively.
Pressure ulcer healing time was negatively correlated with microcirculation perfusion at the center of the pressure ulcer (i.e. the lower the perfusion amount of microcirculation, the longer the healing time of pressure ulcer) (Figure 8).

The relationship between microcirculation perfusion of ROI 1 and healing time in observation group 1.
According to the above results, observation group 1 was divided into the followings three groups according to the healing time of pressure ulcer: group A healing time <14 days (2 weeks), group B healing time 14–30 days and group C healing time more than 30 days, with mean microcirculation perfusion values of 1598.275, 1012.183, and 493.386 U, respectively. After the homogeneity test, univariate ANOVA was used to compare the microcirculation perfusion in the central part of the pressure ulcer of the three groups, and the data of the three groups were statistically different (Table 4).
ROI 1 microcirculation perfusion grouping analysis of observation group 1.

Through statistical analysis, the following formula can be obtained: pressure ulcer healing time (days) = pressure ulcer center (ROI 1) microcirculation perfusion (PU) × (−0.014) + 46.82 (R2 = 0.330).
Pressure ulcer range and direction of the sinus tract
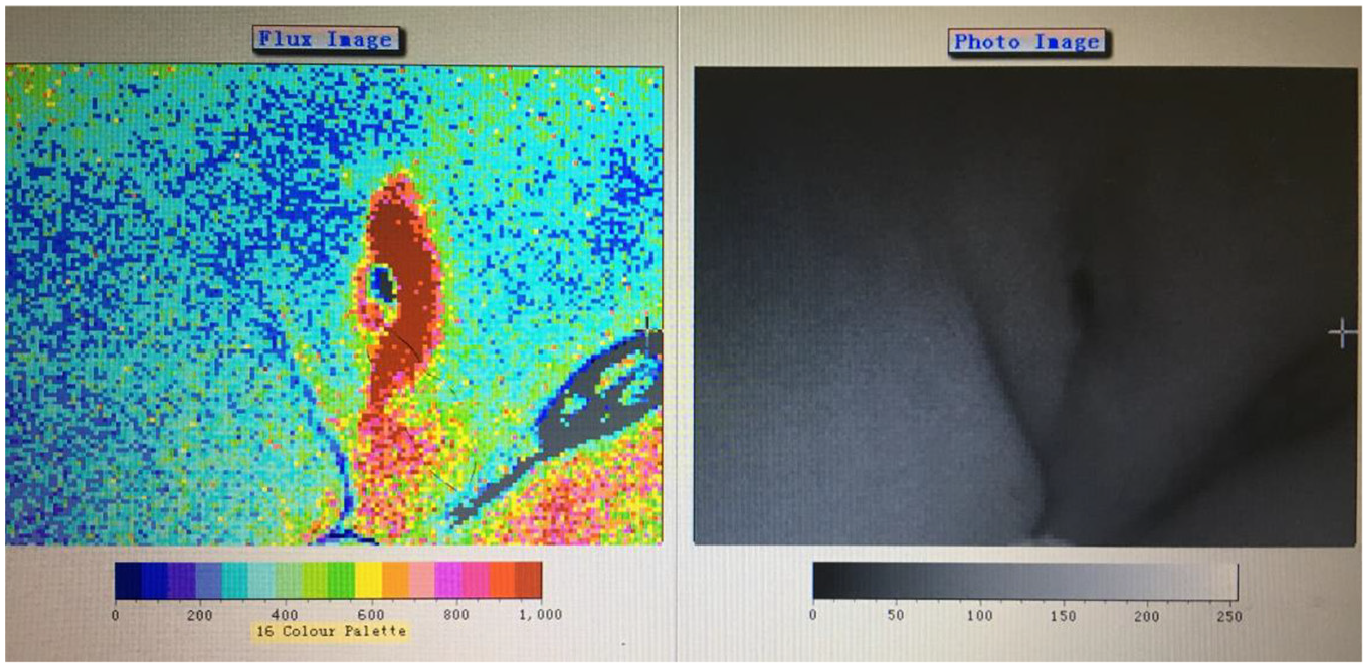
The actual lesion range of pressure ulcer is often larger than that of visible wound. The detection of laser Doppler microcirculation perfusion can determine the lesion range of pressure ulcer (Figure 9), which has the advantage of non-invasive examination.

Microcirculation detection of a grade 4 pressure ulcer. The flux image shows that the damage area of pressure sore tissue is larger than that visible to the naked eye.
The direction of the sinus tract can be determined by detecting the perfusion of the laser Doppler microcirculation (Figure 10), which is of great significance for guiding the treatment of pressure injuries such as dressing change.
Microcirculation detection of a grade 3 pressure ulcer with sinus tract. The flux image shows the direction of sinus tract.
Discussion
Braden Scale
The Braden scale is a tool for predicting the risk of pressure ulcers. Its effectiveness has been widely reported in the literature, especially in elderly, ICU, coma, immobilized, cerebrovascular disease, and spinal cord injury patients. 15 In our study, the two observation group showed statistical differences in Braden scores. A lower score in the patients with pressure ulcer was associated with a higher risk, which is consistent with what has been reported in the literature. For patients with spinal cord injury, Braden scores should be performed periodically according to changes in their condition.
Mechanism of pressure ulcer
Relevant studies have shown that the characteristics of vascular dysfunction after SCI include the decreased perfusion volume.16–19 Degenerative changes in blood vessels occur within 30 min after SCI,20–22 and their number continues to decrease within the first 3 days after injury,23–25 further exacerbating ischemia.
The reasons of pressure ulcer include: (1) Patients with SCI had a long bedtime and local skin was compressed for a long time without adequate decompression; (2) The study on the relationship between the pressure and the compression time showed that the sacrococcygeal pressure was the highest in the semi-sitting position. Most of SCI patients adopt the supine and semi-sitting posture; (3) Sensory disturbance exists in patients with spinal cord injury, making them unable to perceive local skin discomfort, resulting in the occurrence of pressure ulcer; (4) Patients with SCI are often associated with malnutrition, anemia, and hypoalbuminemia, which are also serious risk factors for pressure ulcer and directly affect the healing of pressure ulcer; (5) Patients with SCI also combined with neurogenic bladder and intestinal dysfunction, which can be manifested as fecal incontinence, resulting in perineal and sacrococcygeal region skin dirty and moisture, which is also one of the causes of pressure ulcer. (6) In patients with SCI, especially tetraplegia patients, blood pressure was lower than before, while low average arterial pressure can aggravate skin hypo perfusion and ischemia, increase the risk of pressure ulcer.26,27
Local pressure can cause skin microcirculation disorders, microvascular network collapse. Relevant studies have shown that the disintegration of the microvascular network and the necrosis of endothelial cells will lead to the occurrence of local bleeding centers, which will generate a large number of oxygen free radicals and increase the activity of lipolytic enzymes while decrease the antioxidant activity, thus causing the occurrence of oxidative stress,28,29 which together lead to the subsequent apoptosis of affected cells.30,31
Application of laser Doppler microcirculation blood perfusion in the study of pressure ulcer in patients with spinal cord injury
Skin is the largest organ of the human body. Skin microcirculation system, is an important part of the body microcirculation system. Studies have shown that there is no statistical difference in skin microcirculation was found in 20–69 years-old people, and no statistical differences in different body parts except forearm and fingertip in different BMI groups. 32 So we excluded patients over the age of 70 years in our study.
There are few studies on the application of laser Doppler microcirculation in the detection of bone process skin showed the microcirculation perfusion decreased significantly as the compression time increased. There was no literature showed the application of laser Doppler microcirculation detection of pressure ulcer in patients with SCI, so this study is innovative. In this study, it was found that laser Doppler microcirculation detection could directly and quantitatively reflect the microcirculation perfusion of at the site of pressure ulcer in patients with SCI, with advantages of simple operation and non-invasive. Therefore, it can be used as a feasible and reliable method for the detection of microcirculation perfusion in the area of pressure ulcer in patients with SCI.
Microcirculation characteristics of pressure ulcer
Pressure ulcer occurs due to both exogenous factors, such as pressure, shear stress, friction, and a humid environment, and endogenous factors, such as sensory disturbances, nutrition, fever, infection, complications and soft tissue conditions.31,33–35 Literature reports suggest that pressure is the most important factor for the occurrence of pressure ulcer. The 70 mmHg of sustained pressure for 2 h can cause irreversible skin damage.36,37 Continued pressure caused by local skin, soft tissue blood circulation disorders, ischemia and hypoxia can cause deep subcutaneous tissue, muscle, skin, and epidermal damage. Therefore, decompression is the most important factor in the prevention of a pressure ulcer.
Our study showed no significant differences in microcirculation perfusion of sacrococcygeal regions between SCI patients without pressure ulcer and healthy adults. Therefore, timely decompression can restore local microcirculation perfusion to the level of healthy adults in spinal cord injury patients. However, different microcirculation perfusion values were observed at different sites. Microcirculation perfusion of ROI3 in three groups showed no significant differences, indicating that a pressure ulcer is a localized injury. Laser Doppler microcirculation detection was operated with decompression for at least 30 min. It was also found that muscle contraction would increase the skin microcirculation perfusion in our preliminary experiments, so participants in control group were required to relax during the measurements to avoid muscle contraction (Patients with spinal cord injury rarely have sacrococcygeal spasms. In observation group 1, there are two cases have pressure ulcers at lower limbs without spasm).
From the real-time image of laser Doppler microcirculation detection, the microcirculation perfusion in the whole area of the pressure ulcer is significantly increased, and the reasons may be as follows: (1) The absence of skin barrier will directly affect the local nutritional status and then affect the healing of pressure ulcer. (2) Local skin damage may cause skin microcirculation disorder and collapse of microvascular network. (3) Neovascularization is the most important process in wound healing, as well as in the healing process of pressure injuries. (4) There is an obvious inflammatory response at the site of pressure ulcer. The inflammatory response will lead to the increase of local microvascular diameter, vascular dilation and tissue exudation, which is mediated by various inflammatory response factors.38–40 This also supports the results of this study, which show that the microcirculatory perfusion in the whole area of pressure ulcer is significantly increased.
Relationship between pressure ulcer healing time and microcirculation perfusion
It has been reported that 50% of pressure ulcers can heal within 4 weeks, and all of pressure ulcers can heal within 12 weeks, while the rate of pressure ulcer healing in patients with SCI reaches only half the number of days.41,42 In this study, microcirculation perfusion measurement of pressure ulcer sites suggested that microcirculation perfusion in the central and the edge part of the pressure ulcer increased significantly compared with the surrounding skin. For the central part of the pressure ulcer microcirculation perfusion and the healing time analysis, we got a statistically significant correlation.
The reason why microcirculation perfusion of pressure ulcer center is negatively correlated with pressure ulcer healing time may be: (1) The severe pressure ulcer with deep tissue injury, severe infection, and more secretion, even bone exposure. As a result, the number of local micro vessels is small, and the microcirculation perfusion is low, which also directly leads to the long healing time. (2) The microcirculation perfusion obtained by the laser Doppler microcirculation perfusion detector reflects the product of blood cells and their flow rates in the detected area, while the number of blood cells can indirectly reflect the number of micro vessels in the detected area. Therefore, the number of micro vessels in the central part of pressure ulcer is more, the perfusion volume of microcirculation is higher, the material exchange is more complete, and the healing time is shorter.
According to the analysis of microcirculation perfusion in the center of pressure ulcer and healing time, they have a statistical correlation, and the healing time can be roughly determined according to the microcirculation perfusion of pressure ulcer center.
The following formulas were obtained by statistical analysis: The healing time of the pressure ulcer was calculated as follows: (days) = the center of the pressure ulcer (ROI 1) microcirculation perfusion (PU) × (−0.014) + 46.82 (due to the small sample size of this study, this formula needs to be confirmed by a large sample size measurement).
Pressure ulcer microcirculation staging
There were significant differences in microcirculation perfusion in the center of the pressure ulcer between groups with different healing times. Therefore, we propose that the pressure ulcer should be staged according to the microcirculation perfusion in the central part.
Pressure ulcer microcirculation stage (by standard treatment):
Stage I, the microcirculation perfusion in the central part of the pressure ulcer >1500 U. The pressure ulcer can heal within 14 days.
Stage II, the microcirculation perfusion in the central part of the pressure ulcer 1000–1500 U. The pressure ulcer can heal within 30 days.
Stage III, the microcirculation perfusion in the central part of the pressure ulcer <1000 U. The healing time of pressure ulcer requires more than 30 days.
Stage IV, the microcirculation perfusion in the central part of the pressure ulcer <500 U. The pressure ulcer is still difficult to heal, which is the proposed surgical intervention.
Due to the small sample size and the in- and exclusion criteria of this study, this stage needs to be confirmed by a large sample size measurement.
Guiding significance of microcirculation perfusion detection in the treatment of pressure ulcer
This study showed that the laser Doppler microcirculation perfusion detection has the advantages of simple operation and non-invasive for the microcirculation detection of pressure ulcer. Its advantages are also shown in the following aspects: (1) By detecting the microcirculation perfusion, the lesion scope of the pressure ulcer can be detected larger than the visual range, so as to determine the whole tissue damage of the pressure ulcer. (2) For the pressure ulcer with the sinus tract, such as the pressure ulcer of the ischial tubercle, the direction of the sinus tract can be determined by the laser Doppler microcirculation perfusion detection, which can be the guidance of treatment. (3) The healing time of pressure ulcer can be roughly calculated by the value of microcirculation perfusion in the central part. (4) The laser Doppler microcirculation perfusion detection can also be used to monitor the treatment effect during the treatment of pressure ulcer.
Conclusion
The most important factor for the occurrence of pressure ulcer is pressure. After adequate decompression, the microcirculation perfusion of sacrococcygeal region can be restored to the level of healthy adults. There was no significant difference in sacrococcygeal region microcirculation perfusion between spinal cord injury patients and healthy adults. However, the healing time of pressure ulcer in patients with SCI was significantly longer than that of other patients. The healing time of the pressure ulcer was negatively correlated with microcirculation perfusion in the central part (i.e. the lower the microcirculation perfusion in the center of the pressure ulcer, the longer it took for the pressure ulcer to heal). The laser Doppler microcirculation perfusion detection is a noninvasive and an effective method to determine the tissue damage range, to find and determine the direction of the sinus, to monitor and guide the treatment and to predict the healing time of the pressure ulcer.
Footnotes
Declaration of conflicting interests
The author(s) declared no potential conflicts of interest with respect to the research, authorship, and/or publication of this article.
Funding
The author(s) received no financial support for the research, authorship, and/or publication of this article.