
Abstract
Many published models can be used to analyse the sealing performance of rotary lip seal. The surfaces are normally assumed to be periodic variation. However, the quasi-randomness of surface height distribution should be considered, especially the non-Gaussian distribution. Hence, a mixed elastohydrodynamic lubrication model with non-Gaussian surfaces is proposed and used to analyse the effects of sealed fluid pressure on the seal performance in this paper. Based on digital filter and Johnson’s translator system, a rough surface simulation method is introduced to simulate non-Gaussian rough surface. Based on this method the mixed lubrication model with non-Gaussian surfaces is built. The proposed model is verified by comparing the simulation results to experimental observations. Furthermore, it is hardly to find the research focused on the effects of sealed pressure. Hence, the effects of sealed fluid pressure on the seal performance is focused.
Introduction
Rotary lip seal is commonly used due to its simple structure and good sealing performance. Figure 1 shows the main structure of a typical rotary lip seal, including a metal skeleton, a garter spring and a rubber sealing ring. The most important part, rubber sealing lip, is characterized by two angles, air side angle α and liquid side angle β. Usually the liquid side angle is bigger than the air side angle to have an asymmetric pressure distribution and asymmetric tangential deformation, therefore a net pumping flow will be generated from air side to liquid side. 1
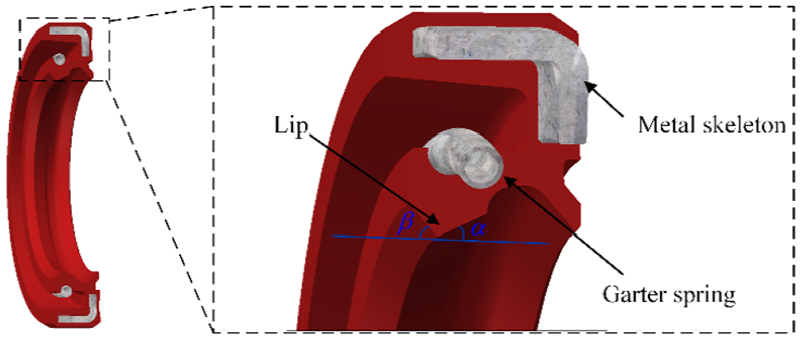
Rotary lip seal.
Rotary lip seals have been used about 80 years. Many researches on the sealing mechanism of rotary lip seal have been carried out. 2 From 1965, Hirano, 3 Brink 4 and Kawahara 5 have carried out a series of experimental studies and found out many important phenomena, including the lubrication film of sealing zone between sealing lip and rotary shaft, the asymmetric tangential deformation of sealing lip, the pumping action and etc. On the basis of these findings, Gabelli6,7 have studied the rotary lip seal numerically, and found a very important factor affecting sealing performance, the surface microstructure of seal. Salant8–13 have built a numerical elastohydrodynamic (EHD) lubrication model, and carried out a series of studies on the rotary lip seal. Finally, several important factors affecting the sealing performance have been determined and expressed in the model, including mean size and direction angle of the asperities on the sealing pair surfaces. The sealing lip surface is about ten times as roughness as shaft, so in his studies, it is assumed that the shaft surface is absolutely smooth, as well as it is the best way to avoid transient of lubrication model.
However, according to the latest research findings, the microstructures of shaft surface have important influence on the sealing performance. Horve 14 has mentioned in his book that ‘if the shaft is too rough or too smooth, the rotary lip seal will leak’. Özperk and Temiz 15 has confirmed this statement by experimental study, and the influence of shaft surface microstructure on the friction torque is also analysed. Slant have established the first lubrication model considering both sealing lip and shaft surface microstructure, 16 but this model neglects the deformation of rubber seal lip and the contacts between two surfaces asperities. Then the two-dimensional rubber elastic deformation model and Greenwood-Williamson contact model were introduced to analyze the sealing performance, and a numerical mixed two-dimensional elastic deformation EHD lubrication model was established.17,18 Gadari et al. 19 has built a thermal elastohydrodynamic (TEHD) lubrication model, considering the effect of sealing lip temperature on liquid viscosity. The contacts between the two surfaces are ignored in this model. The experimental verification and analysis were carried out, and the influence of the shaft roughness on the sealing performance was studied, including leakage rate and friction torque.
Most of these EHD lubrication models assume that the surface microstructures of seal lip and shaft are periodic variation and in the form of cosine function. Nevertheless, sealing lip and shaft surface height are quasi-randomly distributed, so this kind of periodic rule structures cannot accurately describe the microstructures of these surfaces. Moreover, in the above researches only the sealing performance in different rotary velocities with different sealing lip or shaft surfaces roughness is analysed. But the influence of sealed pressures is not taken into account. Generally, the change of sealed pressure is very obvious and cannot be ignored for different operating conditions. Hence, it is necessary to discuss the sealing performance in different sealed pressures when analysing the seal performance.
To resolve above problems, this paper proposes a mixed EHD lubrication model with non-Gaussian surfaces. The distinguished features of this paper are as follows. First, the quasi-randomness of non-Gaussian rough surfaces height distribution is considered. Second, based on Johnson’s translator system and digital filter, a rough surface simulation method is introduced and applied in the proposed model. Finally, the model is utilized to analyse the sealing performance under different operating conditions, especially the sealed pressure.
Numerical generation of non-Gaussian rough surface
Statistical parameters of rough surface
Random variable z expresses heights of a rough surface. p(z) indicates the corresponding probability density function (PDF). For a rough surface, the mean height

The second moment is the surface height variance

The third moment is skewness Ssk, which expresses the symmetry of the PDF and can be given by

For Gaussian distribution, Ssk = 0, which means that the PDF is symmetry, as shown in Figure 2(a). When the skewness Ssk is negative, the ratio of height above mean value is greater than ratio of height below mean value, according to Figure 2(b). When the skewness Ssk is positive, the ratio of height below mean value is greater than ratio of height above mean value.

(a) Probability distribution and (b) height distribution for different skewness.
The fourth moment is kurtosis Sku, which is one of the most important statistical parameters for rough surface and can be given by

The surface height distribution kurtosis Sku represents the sharp degree of the PDF. The kurtosis is greater, the PDF is more acute and the height distribution is more sharp, as shown in Figure 3. For Gaussian distribution, Sku = 3.

(a) Probability distribution and (b) height distribution for different kurtosis.
Numerical generation of rough surfaces
One of the most important surface features is autocorrelation function. 20 For a random sequence η(k, l), the output sequence z(k, l) can be obtained through the two-dimensional digital filtering sequence h(k, l) as flows
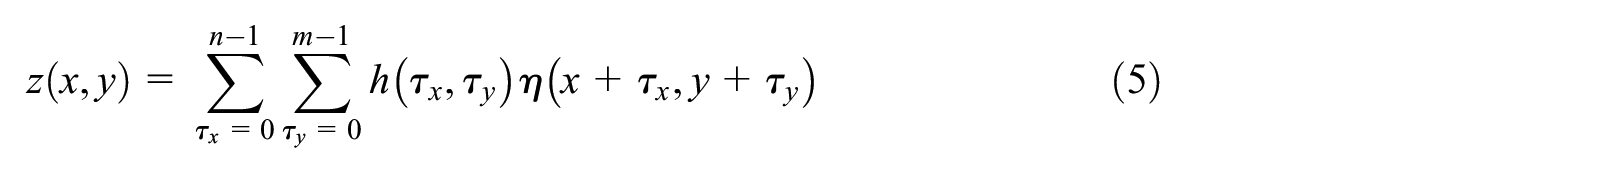
where h(k, l) means the filter function.
After Fourier transform

where Z(ωx, ωy) and A(ωx, ωy) are Fourier transforms of output series z(x, y) and input series η(x, y), respectively. H(ωx, ωy) is Fourier transform of filter function h(k, l) and called transfer function.
The relationship between the transfer function and the autocorrelation function can be given by

where C(ωx, ωy) represents power spectral density of input series, C(ωx, ωy) is a constant for Gaussian random sequence. Gz(ωx, ωy) indicated power spectral density of output series and can be obtain from autocorrelation function by Fourier transform.
Therefore, in order to generate a rough surface series which has a designated autocorrelation function, the transfer function can be given by

Hence, a quasi-random surface height distribution z(k, l), which has a given autocorrelation function, can be obtained from a random Gaussian sequence η(k, l) filtered by digital filtering sequence h(k, l), inverse Fourier transform of transfer function H(ωx, ωy).
According to experimental results, the surface profile of most engineering surfaces has an exponential autocorrelation function. 21 In the presented research, the exponential autocorrelation function is used, as

where σ the is the roughness of the surface, λy means the correlation length in y direction and λx means the correlation length in x direction.
After filtered, the skewness and kurtosis of series will be changed. The relationship of the skewness and kurtosis between the input and output series can be given by Bakolas 22


where Ssη is skewness of input series, Ssz is skewness of output series, Skη is kurtosis of input series and Skz is kurtosis of output series.
Johnson series generation
Non-Gaussian series is indispensable when generating non-Gaussian surface. Selecting the proper form of frequency curve, lognormal, unbounded and bounded, the Johnson series Z is obtained based on equation (12). The parameters, γ, ξ, λ and ε, can be obtained based the first four moments of the non-Gaussian series. 22

where Z is standard normal distribution series and

Generation procedure
Given the autocorrelation function R(τx,τy), skewness Ssz and kurtosis Skz, the non-Gaussian rough surface can be obtain based on the procedure shown in Figure 4.

The flowchart of the non-Gaussian surface generation.
Numerical model
Figure 5 shows a schematic diagram of the sealing zone at a given circumferential location. In Figure 5, U is the rotary velocity of the shaft, z means radial coordinate, y means axial coordinate, x means circumferential coordinate, ps is the sealed pressure and Pe is the environmental pressure. Before we continue to establish the mixed lubrication model, the following assumptions are made: 18 (1) The sealing zone is defined as the static contact zone. (2) The air side is assumed to be filled with fluid to calculate the reserve pumping rate. (3) The effects of microscopic asperities on the macroscopical deformation of the seal can be neglected.

Schematic of the sealing zone.
Fluid mechanics analysis
Because the surfaces of sealing lip and shaft are not absolutely smooth, the sealing zone of sealing lip is supported by hydrodynamic pressure. Average Reynolds equations with flow factors is one kind of the widely used approaches in fluid flow analysing for interface between rough surface, due to the smaller calculation efforts.23,24 While it is normally based on the assumption of a Gaussian distribution of surface heights, so this kind of approaches are not suitable in the presented research. Hence, the traditional Reynolds equation is used to obtain hydrodynamic pressure and film thickness distribution in the sealing zone, as given by

where pf is hydrodynamic pressure, U is velocity, and μ is viscosity. h is the film thickness and given by

where hshaft is the shaft surface height distribution. hseal is the sealing lip surface height distribution. δx and δz are elastic deformation in the directions of x and y. havg is the initial average liquid film thickness. It should be noted that the shaft roughness and sealing lip roughness are reflected by the shaft surface height distribution and sealing lip surface height distribution, respectively. Furthermore, the transient of Reynolds equation is on account of roughness shaft. 18 In addition, all the above parameters are time-varying except for havg.
Cavitation will occur when the hydrodynamic pressure is smaller than the pressure of dissolved gas, while equation (14) is only applicable when the sealing zone is filled with fluid. Therefore, in order to consider the influence of cavitation on lubrication, the modified Reynolds equation presented by Shen and Salant 17 is applied, as
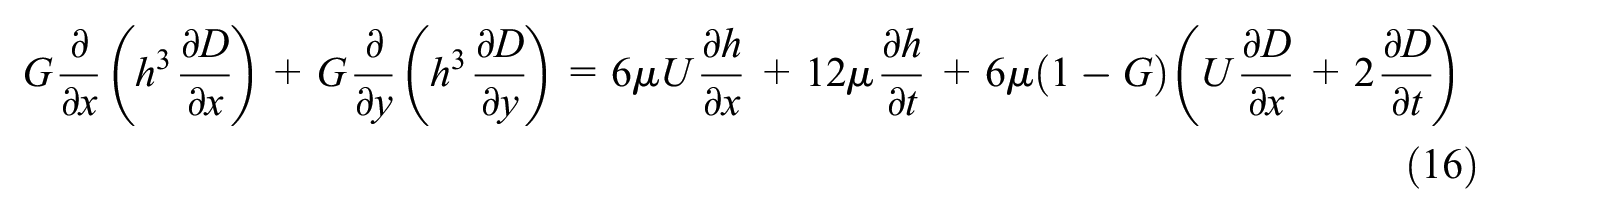
where D is universal variable, G is cavitation index, and

where pcav is the cavitation pressure.
The boundary conditions are

where b is the width of the sealing zone in axial direction.
The relationship between viscosity and temperature can be given by Guo et al. 25

where the fluid viscosity is μ0 at temperature T0 and μ at T.
The pumping rate and viscous shearing stress are given by


Contact mechanics analysis
Greenwood and Williamson contact model (G-W model) is applied to calculate the contact stress. 26 Real contact area Ae and contact pressure pc are given by


where ηe is the equivalent asperities density on the nominal contact area An, Ee is the equivalent elastic modulus, Fc is the total contact pressure,
In this paper, it is considered that both the sealing lip and the shaft surfaces are rough, so the radius of asperities curvature Re can be obtained by

where Rseal is the mean radius of asperities curvature on the sealing lip and Rshaft is that of the shaft.
Equivalent elastic modulus Ee is calculated based on

where Eshaf is the elastic modulus of the shaft, Eseal is the elastic modulus of the seal, vshaft is the Poisson’s ratio of shaft and vseal is Poisson’s ratio of the sealing lip.
If surface height of sealing lip and shaft both follow Gaussian distribution, the PDF ϕ(z) can be given by
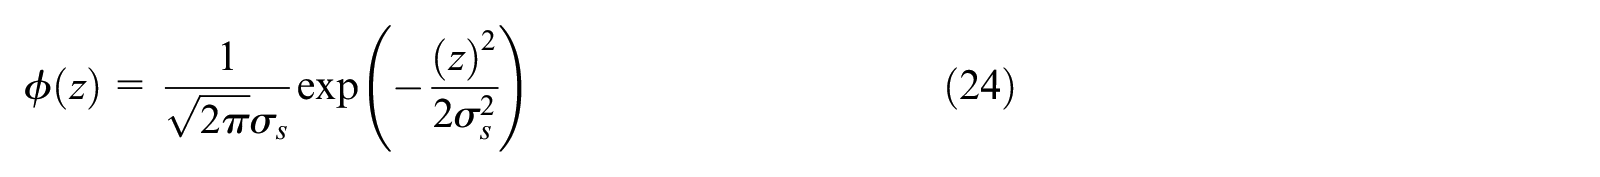
where equivalent standard deviation of asperity heights σs can be calculated by

However, it should be noted that the non-Gaussian distribution of the rough surfaces height is considered in the presented research. As argued in Leighton et al., 27 the effects of the non-Gaussian distribution can not be neglected when calculating the contact load of rough surfaces. Hence, the PDF of the rough surfaces height distribution transformed by Johnson’s translator system is used in G-W model. Namely, the PDF of height distribution can be given by Bakolas 22

where the parameters, γ, ξ, λ and ε, depend on statistical parameters of the non-Gaussian rough surfaces.
Contact shear stress can be given by

where μc is the dry friction coefficient.
Deformation mechanics analysis
Seal deformation is analysed based on finite element (FE) method, as shown in Figure 6, where δ is the shaft-seal interference and F is the pre-tightening force. By solving the above FE model of rotary lip seal, the contact width b and static contact pressure distribution can be obtained.
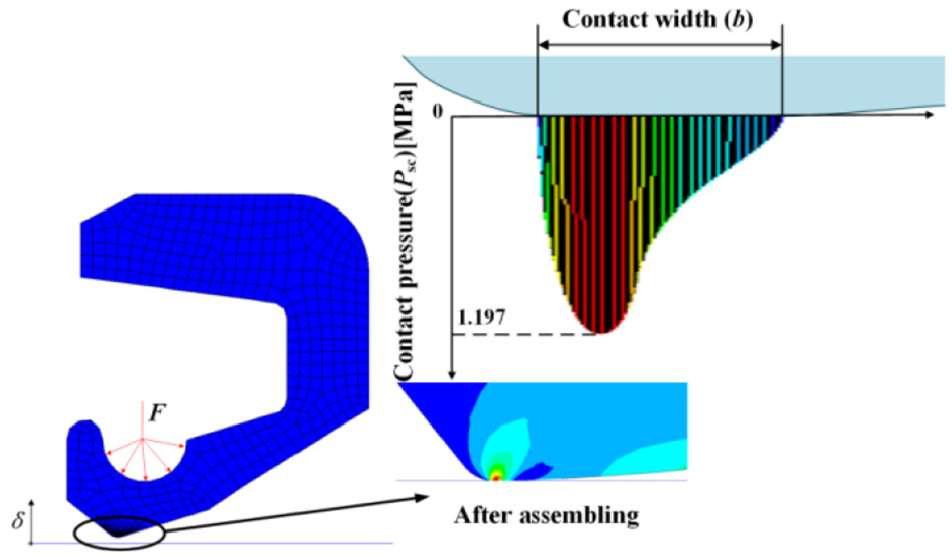
The finite element model.
The relationship between the sealing lip deformation and load is described based on a two-dimensional influence coefficient method. The formula for the normal deformation and shear deformation of any node on the sealing lip surface are given by


where psc is the static contact pressure. Influence coefficient matrix (Iz) ik means the normal displacement at the i-th axial node caused by a unit normal load at the k-th axial node of lip surface with pre-tightening force and rigid imposing. Similarly, (Ix) ik means the shear displacement at the i-th axial node caused by a unit shear load at the k-th axial node of lip surface.
Thermomechanics analysis
A global thermal analyzing approach is used to calculate the temperature of sealing zone fluid. Thermal balance method, equation (30), is used where the heat Φ, including viscous dissipation and friction dissipation, is transferred to liquid circulation by convection and surrounding fluid by shaft. 28

where hc is the fluid heat transfer coefficient, L is the shaft length, R is the radius of the shaft, T is the average temperature of the sealing zone fluid, Qρ is the reverse pumping rate, Tref is the ambient temperature, and Cp is the specific heat of the fluid.
The generated heat is given by

where A is the simulation space.
Procedure of simulation
The solution scheme for the presented mixed lubrication model is a strong coupling solution process. Finite difference method is applied to handle the Reynold equation. The coupling relation is solved by an iteration algorithm, and the sealing performances in different operating conditions are obtained. Figure 7 shows the flow chart of the solution method. First, the seal parameters and operating condition are set, the viscosity is calculated, then the film thickness and deformation are initialized. Second, the rough surfaces are generated for the shaft and the seal. Finally, for each condition, the deformation mechanics, the contact mechanics and the fluid mechanics are solved numerically, then the calculation results for different operating conditions are obtained.
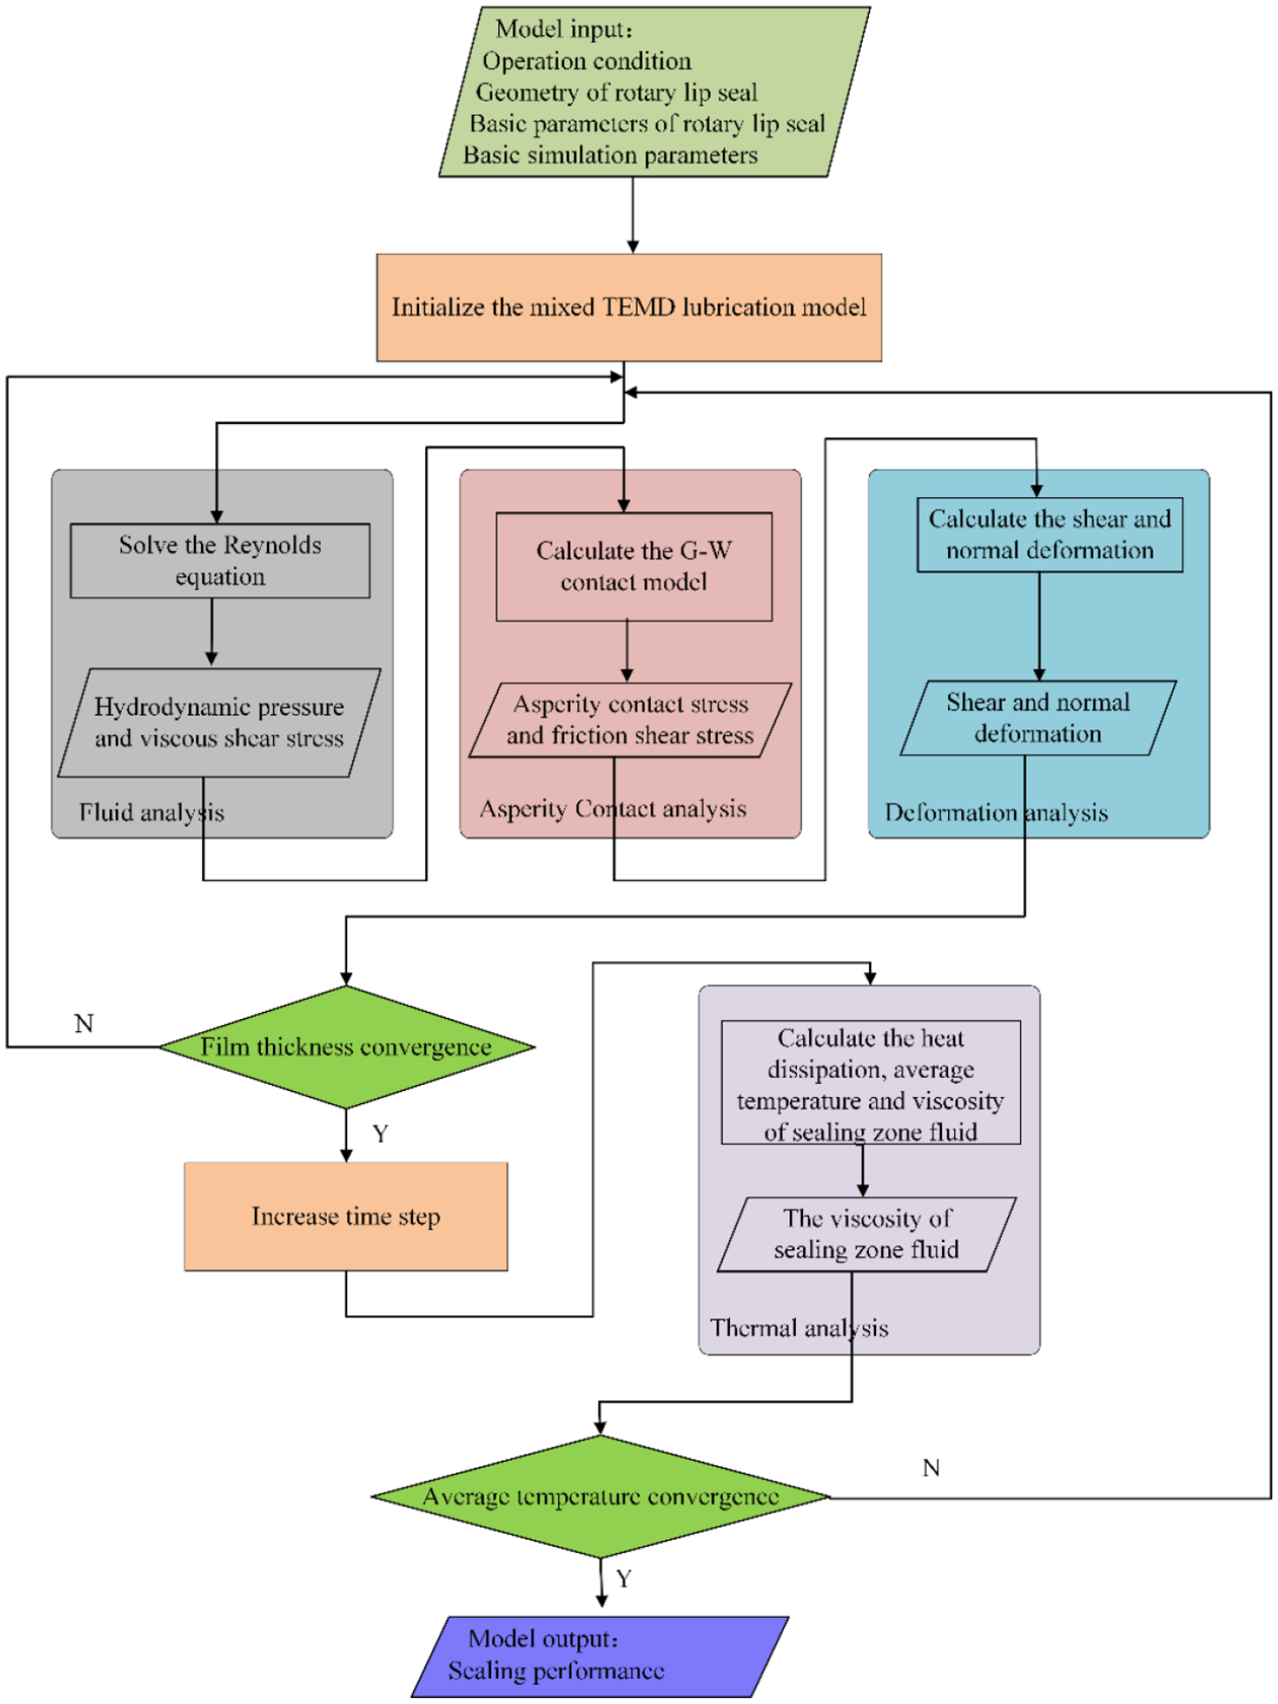
Procedure of sealing performances simulation based on the proposed mixed lubrication model.
Validation of the proposed mixed lubrication model
Experimental approach
The measured surface profiles of the sealing lip surface and the shaft surface are shown in Figure 8. Sealing lip surface: roughness is 1.2514 μm, λx = 13.7 μm, λy = 29.6 μm, skewness is 1.9644, kurtosis is 8.191. Shaft surface: roughness is 0.1217 μm, λx = 121.1 μm, λy = 26.9 μm, skewness is 1.0327, kurtosis is 1.088. It can be seen that both seal and shaft surface are non-Gaussian distribution surfaces.

(a) Sealing lip surface and (b) shaft surface.
Based on nonlinear least squares method and the measured results, Table 1, the parameters of equation (17) are estimated.
Relationship between the viscosities and temperatures.

In the test bench, as shown in Figure 9, there are shaft, torque sensor, motor from bottom to top. The shaft speed is controlled by controlling the motor. Between the motor and shaft, a torque sensor is installed to measure the friction torque. There are two rotary lip seals between the shaft and tank. It should be noted that, only the bottom one is the test sample. The friction torque of test sample is difference between the total torque after the test sample is installed and that before the test sample is installed. The sealed fluid pressure and temperature are controlled by adjusting the velocity of oil flow in and out.

(a) Schematic of the test approach and (b) photograph of the test bench.
Numerical versus experimental comparison
The experimental tests have been carried out step by step, the increasing step is 250 rpm and from 500 rpm to 2500 rpm. It must be mentioned that, the leakage rate is very small and it is difficult to be measured, so the leakage rate is not presented in this paper. The proposed method is compared to a previously published mixed EHD model with Gaussian surfaces in Huang et al. 2 It can be seen that, the simulation results are accordant with the experimental results (Figure 10). Furthermore, the proposed method is more accurate then the previously published mixed EHD model with Gaussian surfaces. Namely, it is necessary to consider the non-Gaussian surfaces in rotary lip seal analysis.

Comparison of the simulation torques and experimental torques.
Simulation and discussion
Values of the simulation parameters are shown in Table 2. The pumping rate is one of the most important sealing performances. As discussed above, it is necessary to discuss the relationship between sealed pressure and sealing performances, such as average film thickness Havg, average friction torque Tavg, reverse pumping rate Q and average contact ratio λ. Hydrodynamic pressure is affected by the relative sliding velocity, roughness of shaft and seal lip surfaces, and hydrodynamic pressure affects the seal performances, so analysis of how the seal performances impacted by above factors is also carried out. Additionally, it should be noted that the performance parameters are time average values because the proposed model is time-varying.
Values of the simulation parameters.

Surface roughness influence
The discussion of the effects of surface roughness on lubrication and leakage has been an important issue for many years. As argued in Qu 29 and Kozuch et al., 30 the surface roughness is important for the lubrication of the sealing zone. Furthermore, the asperities on the shaft surface have an important influence on the sealing performance, while it is hardly to find related research focused on this issue. Hence, this section presents liquid film thickness distribution and hydrodynamic pressure distribution at different shaft surface forms, smooth and rough surface, as shown in Figures 13–16. Film thickness distributions for smooth shaft and rough shaft are shown in Figures 11 and 12, respectively. Maximum liquid film thickness for smooth shaft is 2.489 µm, while for rough shaft it is 2.572 µm. Figures 13 and 15 are hydrodynamic pressure distributions for smooth shaft and rough shaft. The zero hydrodynamic pressure regions are cavitation zones, indicating that cavitation cannot be neglected. The maximum hydrodynamic pressure for smooth and rough shaft are 1.763 MPa and 1.904 MPa, respectively. Moreover, the maximum pressure locations are different for smooth and rough shaft. It is obvious that the rough shaft surface can provide higher hydrodynamic pressure than smooth shaft, hence the lubrication for rough shaft surface will be better.

Film thickness distribution for smooth shaft.

Film thickness distribution for rough shaft.

Film thickness distribution for two-dimensional cosine function surface.
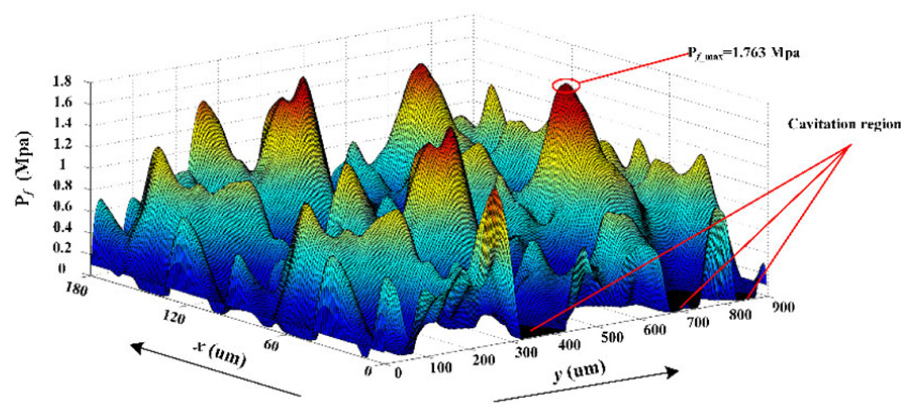
Hydrodynamic pressure distribution for smooth shaft.

Hydrodynamic pressure distribution for rough shaft.
Figures 13 and 16 show the film thickness distribution and hydrodynamic pressure distribution with cosine form surfaces as equation (32), 15 respectively. According to Figure 13, the film thickness distribution is cosine-shaped, as surface form. Trough and peak alternately appear three times in y direction. Furthermore, the same film thickness distribution repeats three times in the range of 180 µm along y direction. As shown in Figure 16, the situation is similar for the hydrodynamic pressure distribution. That is to say, no matter how many surface cycles of peaks and troughs are placed along y direction, only one cycle is valid. On one hand, this result is too ideal to analyse sealing mechanism. On the other hand, it is difficult to improve the simulation accuracy by increasing the width of the simulation space. While the results of the proposed mixed lubrication model are not regularly distributed, which is closer to the real situation compared with the cosine function form surface, and it is consistent with the quasi-randomness of surface formation. Furthermore, using the proposed model, we can increase the width of the simulation space to improve the simulation accuracy. Namely, the proposed mixed lubrication model is more reasonable than the mixed EHD lubrication models with cosine form surface.

where Nx is the number of peaks roughness in x direction and Ny is the number of shaft peaks in y direction.

Hydrodynamic pressure distribution for two-dimensional cosine function surface.
Parametric study of sealed fluid pressure
In the following context, the effects of sealed fluid pressure on the average film thickness, contact ratio, friction torque and pumping rate are studied. The asperities on shaft surface are one kind of the most important factors affecting the sealing performance. Sealed fluid pressure influence on sealing performance under different shaft roughness is analysed. The simulation results are shown in Figure 17. According to Figure 17, it can be concluded that lubrication performance will also increase, average friction torque and reverse pumping rate will decrease when shaft surface roughness increases. Except for the reverse pumping rate, the shaft surface is rougher, the performance is better. The reason why rougher shaft surface leads to the decrease of reverse pumping rate is that rougher shaft surface causes higher hydrodynamic pressure and bigger film thickness, and the smaller mean dry friction shear stress. Then a weaker pumping effect will occur.
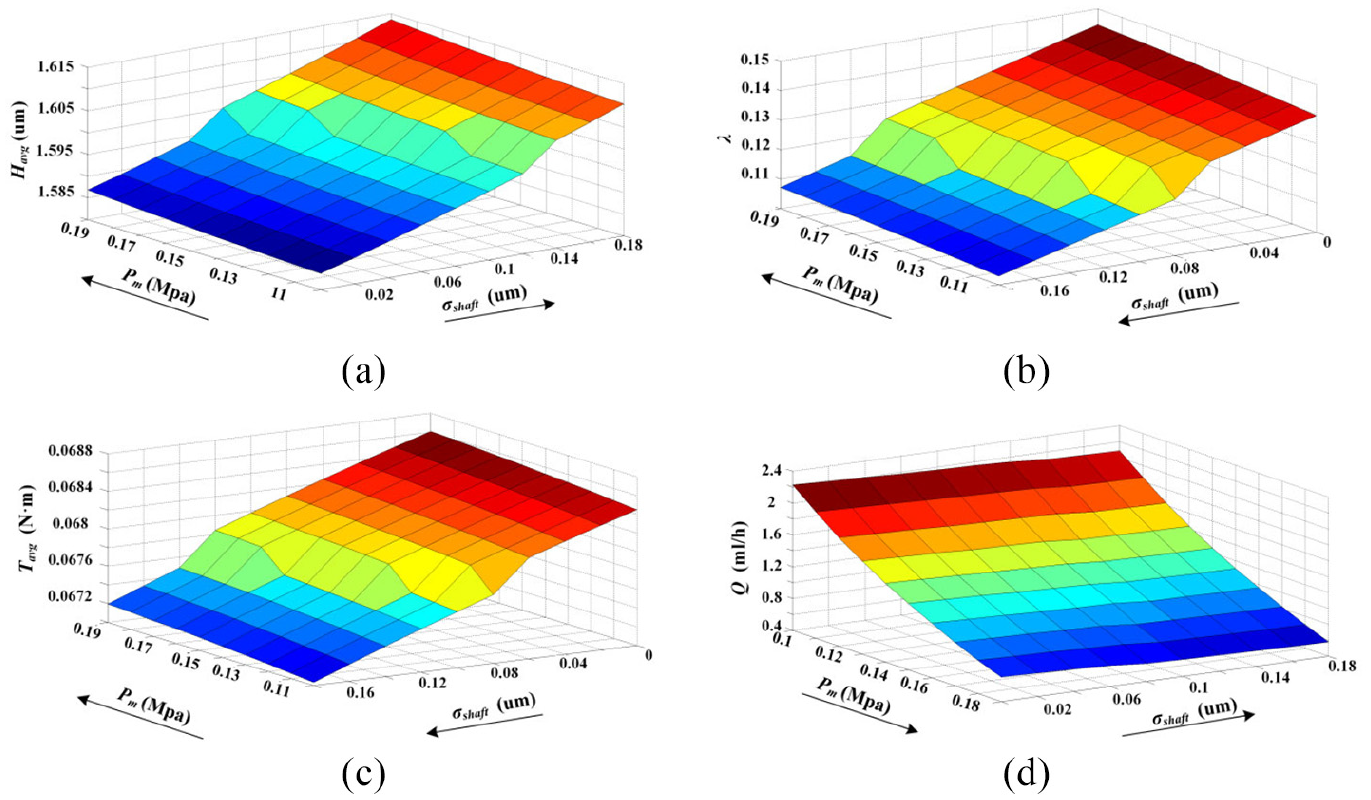
Sealed fluid pressure influence under different shaft roughness: (a) average film thickness Havg, (b) average contact ratio λ, (c) average friction torque Tavg, and (d) reverse pumping rate Q.
Considering the sealed fluid pressure influence, the film thickness and friction torque will increase, but contact ratio and pumping rate will decrease when the sealed pressure increases. Compared with shaft roughness, the impact of sealed fluid pressure on film thickness, contact ratio and friction torque is pretty weak. However, the impact of sealed fluid pressure on pumping rate is extremely strong.
For the effect of the seal lip roughness on the lubrication and sealing performance under different sealed pressures, the seal lip roughness from 0.1 to 1 µm is considered. The simulation results are shown in Figure 18. The increase of roughness results in the increase of hydrodynamic, bringing about a higher liquid film thickness. But lubrication will be worse, and contact ratio will increase, leading to bigger friction torque. Then the dry friction shear stress will increase, and the shear deformation of seal lip would be more obvious. Finally, the reverse pumping effect will be enhanced.

Sealed fluid pressure influence under different seal lip roughness: (a) average film thickness Havg, (b) average contact ratio λ, (c) average friction torque Tavg,, and (d) reverse pumping rate Q.
Compared with the seal lip roughness, the sealed pressure has very limited influence on the indicators of sealing performance and lubrication except for reverse pumping rate. It can be seen from Figure 18(d), that the increase of sealed pressure will lead to the decrease of reserve pumping rate, and the capacity of the weakening pumping action will increase with the increase of sealing lip roughness.
To study the effect of relative velocity, the movement velocity of shaft from 0.5 to 1.4 m/s is considered. The simulation results are shown in Figure 19. When the velocity increasing, friction torque, film thickness and reverse pumping rate increase, and contact ratio decrease. It can be concluded from the above analysis that, the influence of velocity is more obvious than the sealed fluid pressure, the roughness of shaft and seal. Sealed pressure and velocity influence on pumping rate are at the same level, while sealed pressure influence on film thickness, contact ratio and friction torque is very small and can be neglected compared with velocity.
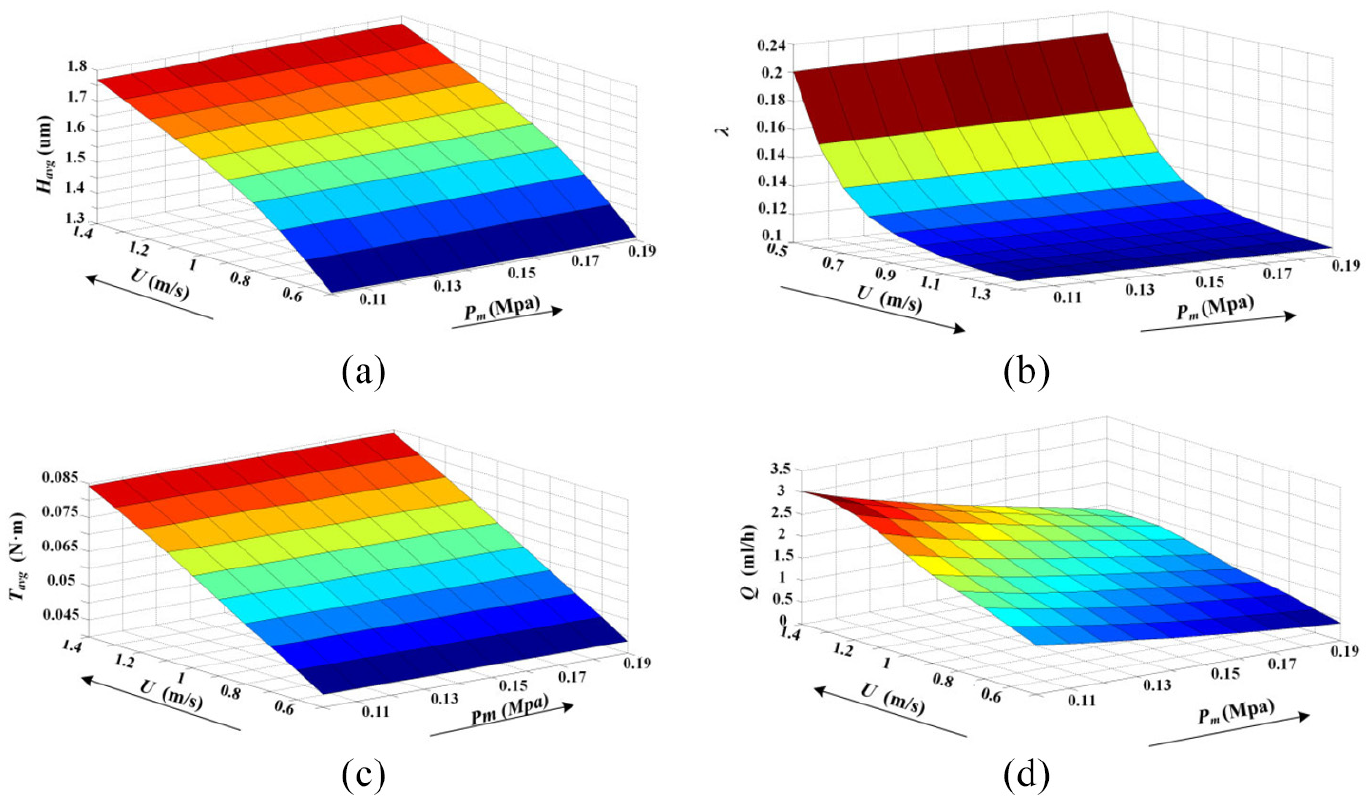
Sealed fluid pressure influence under different relative velocities: (a) average film thickness Havg, (b) average contact ratio λ, (c) average friction torque Tavg, and (d) reverse pumping rate Q.
Conclusions
This work presents a mixed lubrication model with non-Gaussian rough surface to simulate the rotary lip seal performance. The proposed model has been verified by comparing comparing the simulation results to experimental observations. Quasi-random rough surfaces with different parameters are generated by numerical simulation. The effects of operating conditions, especially the sealed fluid pressure, on sealing performance are studied.
It can be seen that the non-Gaussian rough surface is more reasonable than the cosine function form surface to describe the microstructures of seal and shaft surfaces. The simulation results show that rougher shaft surface can provide higher hydrodynamic pressure and then better lubrication, while rougher surface sealing lip has the opposite effects. However, the reverse pumping rate will decrease with the increase of shaft roughness and will increase when seal lip becomes rougher. Furthermore, the effects of sealed fluid pressure on the lubrication are limited. However, the sealed pressure is critical for reverse pumping rate, which is one of the most important sealing performances.
The presented work provides insight into the effects of the sealed pressure and shaft roughness on the seal performances. The presented work lays a foundation for engineers to select the shaft under different operating conditions, including sealed pressure and shaft speed. Future work will focus on the several major improvements: effects of unstable operating conditions, effects of shaft’s out-of-roundness.
Footnotes
Appendix
Declaration of conflicting interests
The author(s) declared no potential conflicts of interest with respect to the research, authorship, and/or publication of this article.
Funding
The author(s) disclosed receipt of the following financial support for the research, authorship, and/or publication of this article: This study was co-supported by the National Natural Science Foundation of China (51620105010, 51575019) and China Postdoctoral Science Foundation (2020M680289).