
Abstract
High pressure common rail system can precisely control the injection time and injection pressure to improve the thermal efficiency of the engine. The injection characteristics of the system can affect the combustion and emission process of the engine. Injection stability is defined as variation characteristics of injection. This could have an unignored influence on combustion and engine output, while few study has been published. The primary objective is to establish evaluation systems and methods for injection stability. Then to study injection stability of the high pressure common rail system. Firstly, several parameters that have an important influence on the emission and combustion are identified. Based on the characteristics data obtained, it is verified that the stability parameters are in accordance with the normal distribution. Then, the five characteristic stability parameters of close speed of injection, cycle injection mass, injection delay, maximum injection rate and open speed of injection were quantitatively analyzed by using range, relative range, kurtosis and variance. It is found that the close speed of injection is greatly depend on injection pressure, the range of close speed varies from 1.8 to 5.1 mg/ms when rail pressure varies from 60 MPa to 160 MPa at 0.6 ms energizing time. The stability of injection mass depends on energizing time, the relative range in short energizing time can be four times than long energizing time. The maximum injection rate has similar characteristics with injection mass, it is also depends on energizing time. The range of maximum injection rate is reduced from the average of 0.6–0.7 mg/ms to 0.3 or even 0.2 mg/ms with the increase of energizing time. The injection delay and open speed of injection seems to be greatly affected by pressure fluctuation, since the observed data present complex rules. Pressure fluctuation in common rail can affect injection stability a lot.
Keywords
Introduction
The high-pressure common rail system can realize flexible control of injection pressure and injection time, and has the unparalleled advantages of other fuel supply systems. It can optimize a series of indicators through time and pressure control such as fuel injection characteristics of combustion characteristics, thus becoming one of the most widely used and most practical fuel injection systems at present day.1–6 There are high pressure oil pipes and a large number of control valves in the high pressure common rail system, which is difficult to avoid pressure fluctuation during the working process.7–11 The pressure fluctuation will affect the fuel injection characteristics of the system, resulting in the problem of injection stability of the fuel supply system. 12 Injection stability refers to the differences in the fuel injection characteristics during each cycle injection.
At present, there is relatively little research around the injection stability. Bai et al.13–15 have studied the injection stability. The main parameter they pay attention to is the cycle injection quantity. The main factors affecting the cycle fluctuation quantity are analyzed by the combination of experiment and simulation, and the correction method is proposed. Herfatmanesh et al. 16 studied the characteristic of pressure wave in common rail system, it is found that the pressure wave in the common rail has a significant influence on the subsequent injection.
They studied the fluctuation characteristics of the cyclic injection quantity because it reduces the control stability of the economy, vibration and noise of the diesel engine especially in mutiple injection. For a diesel engine equipped with a post-treatment device, the fluctuation of the injection quantity of multiple injection cycles causes the exhaust gas temperature to be unstable, which reduces the conversion efficiency of the catalyst and reduces the emission uniformity of the diesel engine. 12 In fact, not only cycle injection quantity, but also the shape of the injection timing and the shape of the fuel injection rate will affect the atomization, combustion and emission characteristics of the diesel engine.17–19 Fuel injection strategies like injection pressure and injection rate shaping are proved to reduce emissions and improve performance.20–22 Juneja et al. 23 study the effect of fuel injection rate shape on spray development and emissions by simulation methods. Their research focused on the fuel injection rate curve. It was found that the larger initial injection rate can make the fuel atomization effect better, and the air entrainment amount becomes larger, so that the first ignition point is far away from the nozzle, and the subsequent flame floats and the length becomes longer, resulting in a decrease in soot content and an increase in NOx. Abdullah et al. 24 study the flame structure and combustion characteristics under different injection rate shaping, it is founded that inversed-delta injection exhibits slightly faster combustion than that of rectangle injection in fixed injection duration cases. Ramírez et al. 25 study the emission characteristics affect by injection rate profiles and find that slower initial rate of injection reduced the NOx emissions and increases the soot emission.
It is concluded that the injection rate curve plays an important role in atomization, combustion and emission characteristics according to above analyses. The injection stability can affect the injection rate curve of the system. While there is no quantitative study about stability of injection rate curves. Therefore, there need research on the injection stability based on the injection rate curves. This paper selects close speed of injection, fuel injection delay, cycle injection mass, maximum injection rate and open speed of injection in order to achieve a comprehensive study on fuel injection stability. According to the repetitive randomness of selected injection parameters, it is first proved that the characteristic parameters of the injection stability accord with the normal distribution, and secondly, variance, range of extremes and kurtosis of each parameter are used to analyze the performance of the injection stability.
Experiment setup
Figure 1 is a sketch diagram of the fuel injection profile measuring device. The experimental measurement system is mainly composed of several parts. High pressure common rail system: including high pressure oil pump, common rail pipe, fuel injector, low pressure oil pump, fuel filter, etc. Auxiliary system: fuel heating system, fuel injection rate test system, etc. Electronic control system: mainly controls the fuel injection and pump system and the fuel injection rate test system to complete data acquisition and work bench control. The Table 1 shows the key equipment and model parameters of the test bench. The test bench model is EFS ITV34/C. The fuel injection measuring device is EFS 8420 provided by EFS, which measures the fuel injection amount and fuel injection profile according to the pressure change in the chamber with a configurable back pressure. An oscilloscope is externally connected during the experiment to monitor the current of the solenoid valve of the injector. The control of the injector and the control of the common rail system are all realized by the EFS 8427 injector drive box. The injector is Delphi DFI2, which is a six-hole injector with 0.15 mm diameter and 150° injection angle with balanced valve structure. During the experiment, 50 repeated experiments are performed for each working condition, and the rail pressure fluctuation don’t exceed 5 Mpa each injection circle.

Sketch diagram of experiment measurement system.
Specifications of major experiment apparatus.

Definition of parameters
In this paper, the injection stability of the high pressure common rail system is studied by experiment method. Several statistics is conducted for describing the data distribution. These statistics and parameters will be introduced in this section (Figure 2).
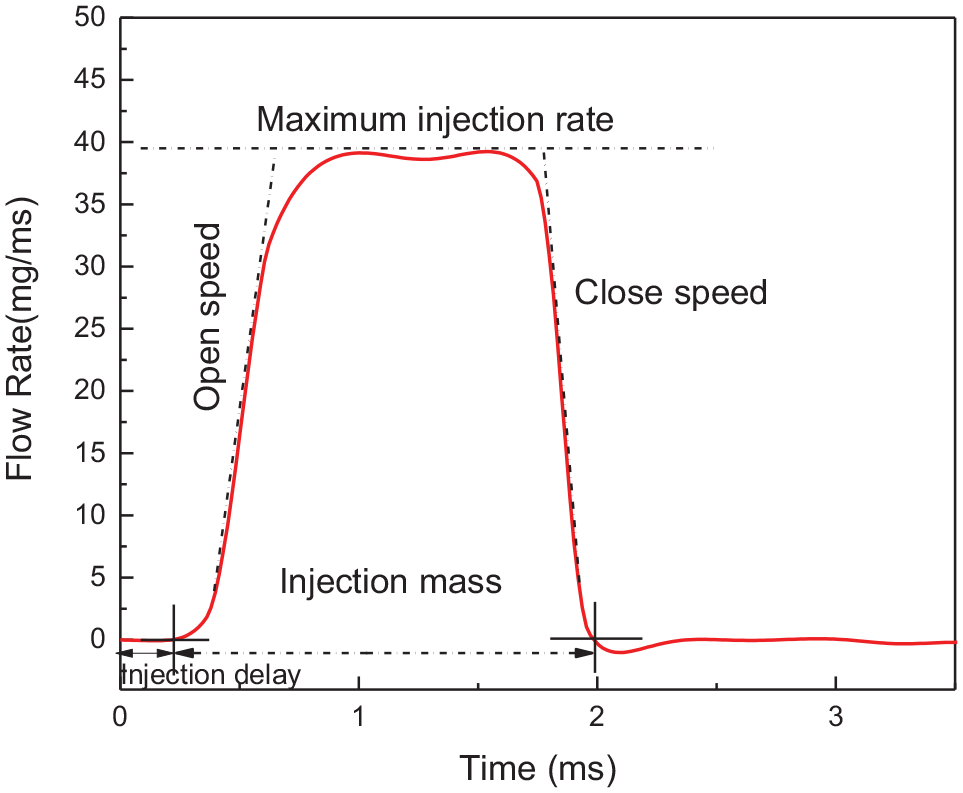
Sketch diagram of characteristic parameters for injection stability.
Through the research on the injection stability, it is known that the research on the injection stability is only limited to the amount of circulating fuel injection. In fact, the parameter that affects the emission and heat release rate of engine is not only the amount of circulating fuel injection. Thus it is necessary to define new parameters to characterize injection stability. The parameters defined here mainly include injection delay, open speed of injection, maximum injection rate, close speed of injection and cycle injection mass.
Injection delay is the time between the energizing signal and the injection rate signal. On operating, the system high pressure oil circuit will generate pressure fluctuations during repeated opening and closing of the valve which would affect injection delay. It has been proved that early injection provides lower soot, HC and CO emissions. 26
Open speed of injection is defined as the maximum slope corresponding to the injection rate in the rising phase. Similar to fuel injection delay, open speed of injection is also affected by pressure fluctuations in the system. The slow rise in the initial phase of the fuel injection profile can reduce NOx emissions. 27
Maximum injection rate is the maximum injection rate that the injection rate can achieve whole injection process. Instant vapor penetration rate is closely related to instant injection rate thus affect atomization and combustion. 28
Close speed of injection is the maximum rate of reduction that the fuel injection rate curve can achieve during the descent, which affect emission characteristics a lot. 29
Cycle injection mass refers to the total mass of fuel injected by the oil supply system in a single injection cycle, which affect the noise of engine a lot. 30 Figure 2 shows these characteristic parameters.
Several statistics is defined according to. 31 The range is the difference between the maximum and minimum values data which is defined as expression 1.

Relative range is defined as expression 2. As the working conditions change, the mean value of the sample changes, and the description using range is incomplete. Therefore, the concept of relative range is defined to describe the stability.

The variance is used to describe the degree of dispersion of the stability characterization parameters during the injection process, defined as expression 3.

The kurtosis is the features that characterize the peak height of the probability density distribution at the mean, defined as expression 4.

Skewness is the degree of deviation of the position where the maximum probability density occurs, which is defined as expression 5.

Results and discussion
Normality test for characteristic parameters
The injection stability problem is mainly for the difference between the various cycles in the system fuel injection process. The experiment study is conducted using Delphi DFI2 injector. The experimental conditions are shown in Table 2.
Main injection characteristic parameters for single injection using Delphi DFI2 injector.

As repetitive, random data, stability characterization parameters are likely to obey a certain form of distribution. In order to verify its distribution, it is draft this type of data to obey the normal distribution. Based on the above 110 experimental conditions, kurtosis and skewness is adopted to test the sample. The main theoretical basis is that the normal distribution density curve is symmetrical and steep and moderate.32,33 Therefore, if the data tested comes from normal distribution, the empirical distribution function cannot be skewed too much, and it cannot be oversupplied. Definition of skewness and kurtosis can be found in third section. Bs is skewness, bk is kurtosis, and close speed of injection, cycle injection mass, injection delay, maximum injection rate and open speed of injection are tested as the main parameters describing injection stability. The results are shown in Figure 3.
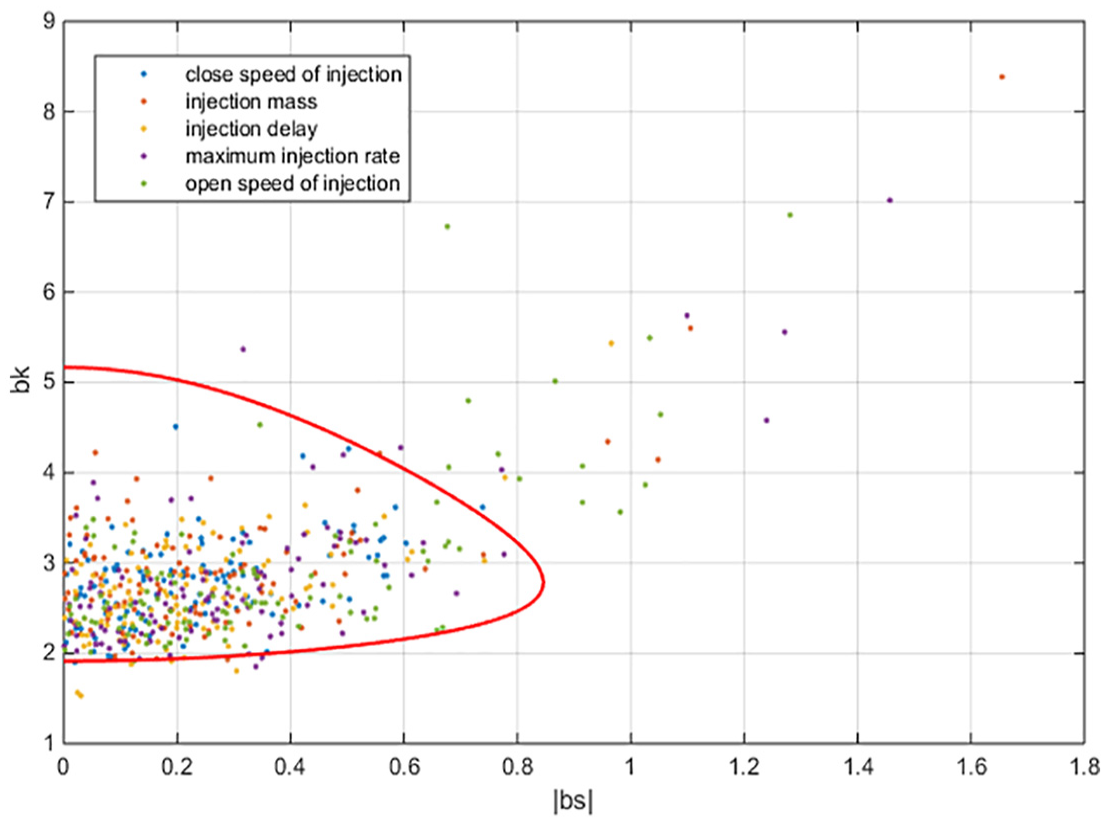
Normality tests for five characteristic parameters of injection stability.
When the tested results conform to a normal distribution, the observed statistics will be concentrated in a specific area. According to the experiment, the number of repetitions is 50, and the confidence level is 0.05. The distribution interval is the inner area of the red line above. Each characterization parameter contains 110 different experiment condition thus 110 points for each parameter in above figure. Close speed, injection mass, injection delay, maximum injection rate, open speed respectively has 1,5,7,9,13 points outside the curve, and most of the observation data are located in the curve. It can be concluded from the distribution that these parameters are in accordance with the normal distribution.
Injection stability under various working conditions
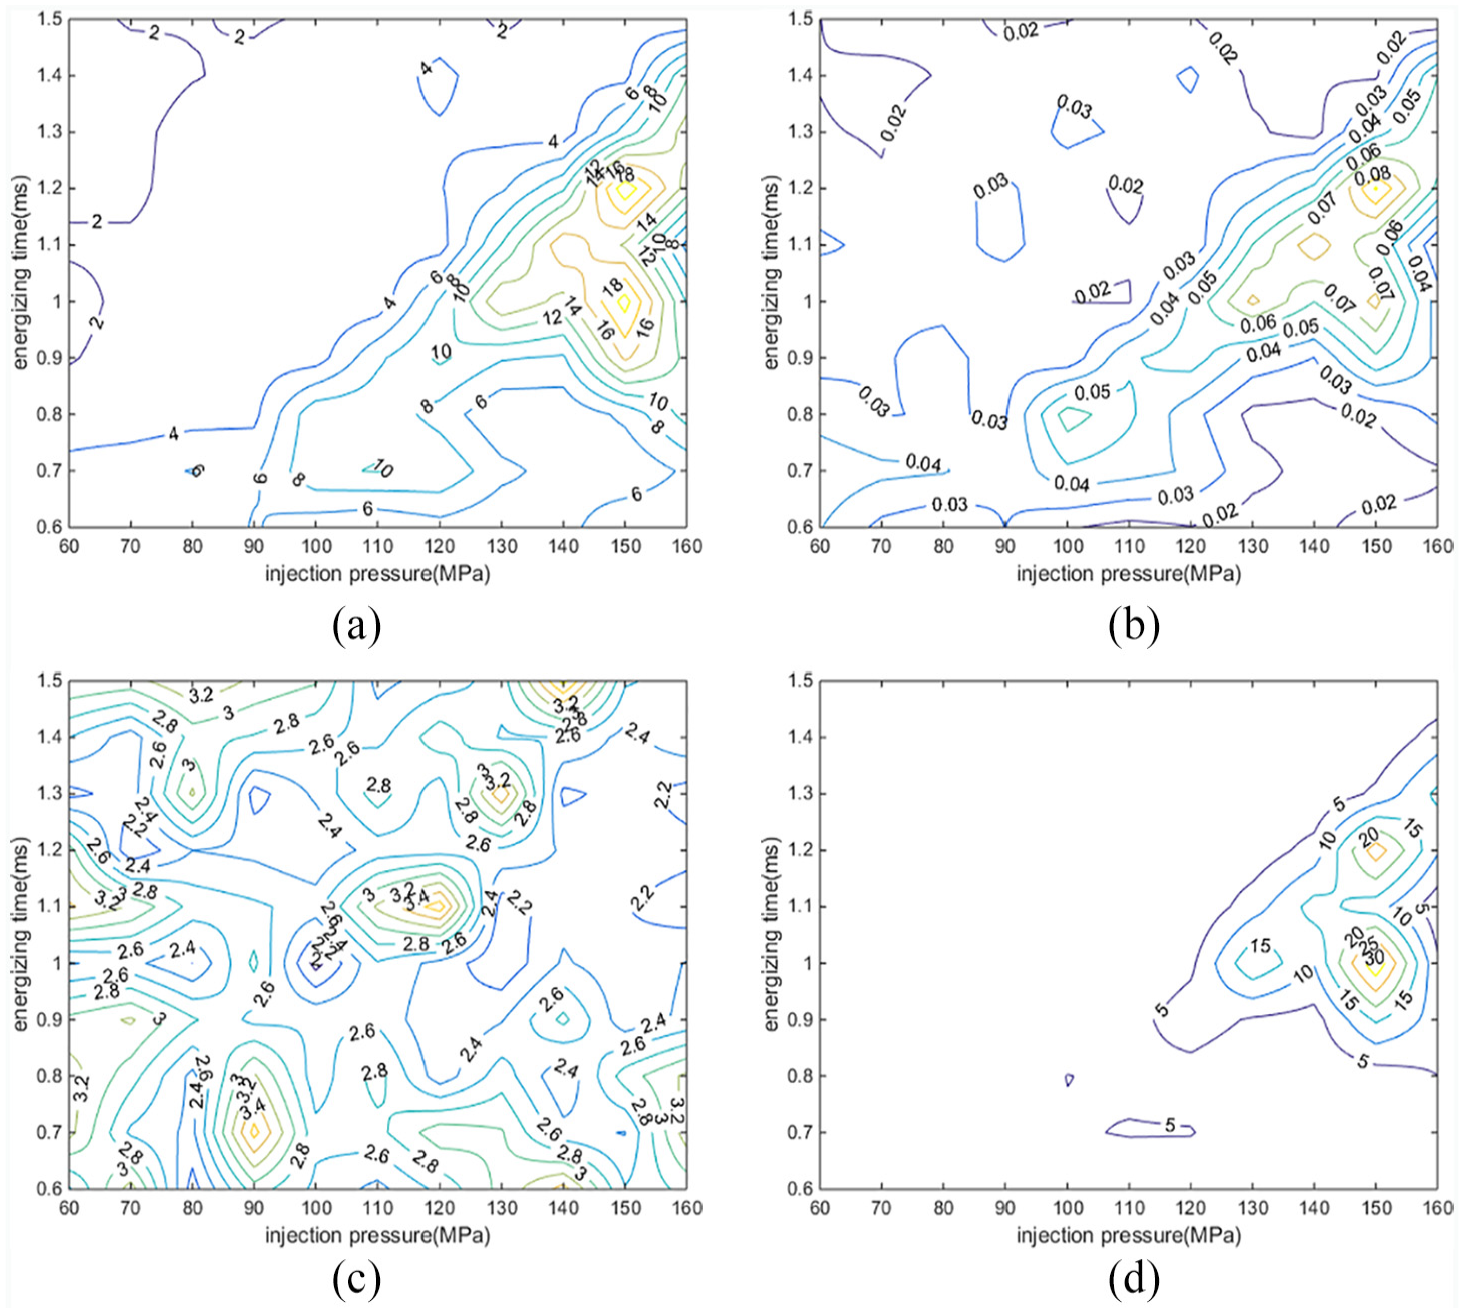
Injection stability distribution of close speed is shown in Figure 4. Close speed is the maximum change rate of the injection rate curve during the closing of the needle valve. The higher the injection pressure, the greater range close speed fluctuation has. From the injection pressure increase from 60 Mpa to 160 Mpa, the fluctuation of the close speed is increased from 2–3 mg/ms to 4–5 mg/ms. Therefore, it can be concluded that the injection pressure increases and the amplitude of the close speed fluctuation. It should be noted that the increase in the fluctuation amplitude may be due to the increase in the injection rate under high injection pressure conditions. It can be seen from Figure 4 that the relative fluctuation range of the close speed is between 0.01 and 0.015 regardless of the high injection pressure or the low injection pressure. The relative fluctuation range is smaller in short energizing times. That might because of pressure fluctuation exist in system. It is more likely to be affected by pressure fluctuation for close speed in short energizing times. From the perspective of the variance (Figure 4(d)), the overall trend is consistent with the trend of the fluctuation amplitude. Under the condition of high injection pressure, the data is more dispersed, and the kurtosis is not much different from other working conditions, and the variance is large. It can be concluded that the increase in fluctuation of close speed is mainly caused by the increase of the injection pressure.

Injection stability distribution of close speed: (a) close speed range, (b) close speed relative range, (c) close speed kurtosis, and (d) close speed variance.
Injection stability distribution of injection mass is shown in Figure 5. Injection mass is the total amount of fuel injected in a single injection cycle. The injection mass exhibits a large fluctuation range under the low energizing time, and the relative fluctuation range is also large. From the 1.5 ms energizing time to the 0.6 ms energizing time, the relative range difference of the injection mass is changed from 0.01 to 0.03–0.04, which is 3–4 times the original. In combination with the fuel injection rate curve, when the energizing time is about 0.6 ms, the injection rate under each injection pressure has not reached the maximum stable state, that is, the injector needle is not fully opened at this time. In this case, the pressure fluctuations in the system will have a great impact on the fuel injection process, because the pressure fluctuation will affect the opening of the needle valve, which in turn will result in different fuel injection duration and fuel injection rate, thus greatly affecting the injection mass. For the longer energizing time, the kurtosis values of each working condition are relatively stable, and the variance value is relatively small. From the perspective of injection mass, it has better injection stability under these conditions.

Injection stability distribution of injection mass: (a) injection mass range, (b) injection mass relative range, (c) injection mass kurtosis, and (d) injection mass variance.
Figure 6 shows the injection stability distribution of injection delay. Injection delay is the time difference between the energizing signal and starting to detect the injection rate. From the range of fuel injection delay fluctuation, there are mainly two large areas with low stability, which are 60–70 Mpa, 0.6–0.9 ms, and 0.8–0.9 ms of 110 Mpa. When combined with kurtosis and variance, the kurtosis value of the first region is high, indicating that the data distribution is relatively concentrated. But at the same time, there are large variance values and extreme differences, indicating that there are some observations far from the average. These observations may be caused by experimental errors. High range, low kurtosis and high variance at various pulse widths of 110Mpa, explain that the injection delay is highly dispersed at these operating points, that is, there is weak stability of injection delay.

Injection stability distribution of injection delay: (a) injection delay range, (b) injection delay relative range, (c) injection delay kurtosis, and injection delay variance.
Figure 7 shows the injection stability distribution of maximum injection rate. The maximum injection rate is the maximum that the injection rate can reach during the injection process. Under the condition of low rail pressure, the range of maximum injection rate is reduced from the average of 0.6–0.7 mg/ms to 0.3 or even 0.2 mg/ms with the increase of energizing time. At a relatively high rail pressure of 160 MPa, the range is reduced from an average of 0.7–0.8 mg/ms to 0.4–0.5 mg/ms with the increase of energizing time, and the fluctuation range is also reduced. Overall, the maximum fuel injection rate decreases with the increase of the energizing time, and the fluctuation range increases with the increase of the injection pressure. The fluctuations are mainly due to a larger injection rate under high pressure conditions from the perspective of relative range. From the kurtosis and variance distribution, the maximum injection rate is dispersed under the high pressure low energizing time conditions, and the worst stability is observed at 150 Mpa and 0.6 ms. At this condition, the maximum fuel injection rate observed has not only a large fluctuation range, but also a maximum degree of dispersion. From the perspective of the fuel injection frequency and the internal pressure fluctuation frequency of the system, it can explain why 160 Mpa express a higher stability than 150 Mpa. The injection frequency is equal under each working condition, but there is a difference in the pressure wave propagation speed in high pressure common rail system, which leads to the difference of the pressure fluctuation frequency in the system under different working conditions. Under the injection pressure of 150 Mpa, there is a relationship between the injection frequency of the system and the frequency of repeated superposition. This relationship enhances the instability of the injector during the injection process.

Injection stability distribution of maximum injection rate: (a) maximum injection rate range, (b) maximum injection rate relative range, (c) maximum injection rate kurtosis, and (d) maximum injection rate variance.
Figure 8 shows the injection stability of open speed under different condition. Open speed of injection is the maximum injection rate slope that the injection rate can reach during the opening of the needle valve. This is also the most special set of observation, open speed of injection is far greater than the close speed of injection. Especially in 150 Mpa around 1.0–1.2 ms, which neither the maximum energizing time nor the maximum injection pressure. The fluctuation of open speed in this area is also much greater than the fluctuation of other operating conditions. The fluctuation of other operating conditions is between 2–5 mg/ms, while this area has a maximum fluctuation of 18 mg/ms. The reason why there is such a large range of fluctuations may be due to the particularity of the parameters. The process of opening the needle valve to start the fuel injection is the first stage of the fuel injection rate curve. According to the small hole mass flow formula, the flow rate is proportional to the root of pressure difference between the two sides. The open speed of injection is the maximum slope of the injection rate, so it is most affected by system pressure fluctuations. The data obtained from a single injection cycle can also prove such a conjecture: Since the injection frequency during the experimental measurement is greater than the frequency of the pressure fluctuations transmitted within the system, in the 50 measurements of the parameter, the observations below the mean and the observations above the mean are continuously consecutive. Therefore, it can be concluded that there is a great impact of pressure fluctuation on open speed.
Injection stability distribution of open speed: (a) open speed range, (b) open speed relative range, (c) open speed kurtosis, and (d) open speed variance.
Conclusion
The fuel injection rate curve of the fuel supply system is an important factor affecting the engine emission characteristics, combustion characteristics and atomization characteristics. In this paper, the fuel supply stability of high pressure common rail system is studied from the perspective of fuel injection rate curve, and the following important results are obtained.
Combined with the research status of injection stability of high pressure common rail system, a new parameter for describing the stability of high pressure common rail system is defined: injection delay, open speed, maximum injection rate, close speed and cyclic fuel injection mass.
Based on the nature of the stability problem, the kurtosis and skewness distribution is used to prove that the stability characterization parameters are all in accordance with the normal distribution.
Based on the normal distribution characteristics of the stability characterization parameters, the stability characteristics of the system under various operating conditions were quantitatively analyzed by using the range, relative range, kurtosis and variance. The range represents the data distribution range, that is, the absolute interval of the stability parameter fluctuation. The relative range is the range divided by the mean, representing the relative magnitude of the fluctuation amplitude. The kurtosis and variance reflect the concentration of the data distribution. Relying on these parameters, the stability characteristics of the Delphi DFI2 injector under various operating conditions are obtained. Results shows that the injection pressure increases, and the close speed fluctuation amplitude increases, but the injection energizing time has little effect on the close speed stability. The injection mass exhibits a large fluctuation range under the low energizing time, and the relative fluctuation degree is also large. The injector exhibits poor stability under conditions of about 110 Mpa for injection delay. The maximum fuel injection rate decreases with the increase of the injection pulse width, and the fluctuation range increases with the increase of the injection pressure. This fluctuation is mainly due to a larger injection rate under high pressure conditions observed from relative range. The pressure fluctuation effect has a great influence on the system open speed of injection, which directly leads to the poor stability of the Delphi DFI2 injector at 150 Mpa.
Footnotes
Declaration of conflicting interests
The author(s) declared no potential conflicts of interest with respect to the research, authorship, and/or publication of this article.
Funding
The author(s) disclosed receipt of the following financial support for the research, authorship, and/or publication of this article: The work was supported by the Fundamental Research Funds for the central Universities (2019YJS165).