
Abstract
The spray formation and breakup process in an open-end swirl injector were studied through experiments and numerical simulations. A high-speed shadowgraph system and a high-speed backlight system were adopted to record the spray. Volume of fluid was used as the interface tracking method to capture the evolution process. The filling process of the liquid film inside the injector was captured. The air core formation process as observed in the experiments differed from that depicted by the numerical simulation results. The results revealed that the spray pattern of the cross-section at the tangential inlets also varied during the filling process. The evolution of the holes on the liquid film and ligaments was observed. It was determined that the liquid sheet repeatedly exhibited thinning, instability, shedding, breakup, and coalescence in the spray formation and breakup process. The spray pattern underwent the distorted pencil stage, onion stage, tulip stage, and fully developed stage with the increased injection pressure drop. The formation process of the open-end swirl injector also underwent these four stages under an injection pressure drop of 0.5 MPa.
Introduction
A swirl injector has the advantages of a simple structure, convenient manufacturing, and good atomization effect. Furthermore, the liquid distribution after primary atomization is uniform, which contributes to enhancing the combustion efficiency. 1 Therefore, it is widely used in liquid rocket engines, gas turbines, internal combustion engines, and other heating equipment. An extensive research on the spray filling, formation, and breakup process is highly important for the further design and improvement of pressure swirl atomizers and validating and refining numerical spray models.
Ramamurthi and Tharakan 2 experimentally studied the shape and disintegration characteristics of a swirled annular liquid sheet. After performing a series of experiments, they summarized that the tulip shape of the sheet transforms into a diverging conical shape when the centrifugal forces at the injector orifice’s exit exceed the surface tension forces by approximately two orders of magnitude. Kashdan and Shrimpton 3 adopted laser Doppler velocimetry (LDV) to measure the tangential velocity of a point in the primary atomization region of a swirl injector. In their research, the tangential velocity rapidly decreased to negligible values (in 2 ms). In the experiment, a high-speed camera was utilized to capture the variation in the spray shape during the spray formation process. Kushari and Barman 4 studied primary atomization by measuring the breakup length and spray cone angle of a swirl injector over a range of the flow Reynolds number. They emphasized the importance of destructive and consolidating forces on the atomization process. Davanlou et al. 1 used a high-speed camera and phase Doppler particle anemometry (PDPA) to investigate the effect of viscosity and surface tension on the breakup and coalescence in a pressure swirl injector. Som and Mukherjee 5 investigated the formation of air core in swirl injectors theoretically and experimentally. They concluded that the ratio of the orifice diameter to the swirl chamber diameter exerted the highest effect on the air core diameter. Lee et al. 6 described the variations in the spray pattern in a swirl injector as a function of the Weber number. In addition, the authors visualized the breakup and formation of the spray in cross-flows. Kim et al. 7 conducted an experimental study on the breakup mechanism of a slurry swirl spray formed by mixing gel fuel and aluminum power. They observed that kerosene gel and slurry swirl spray undergo a breakup process via an aerodynamic mechanism, whereby web-like ligaments are formed. This did not occur for the kerosene because of an increase in its viscosity. Liu et al. 8 investigated the effect of the swirl chamber length and liquid viscosity on air core size. The air core disappears when the swirl chamber length is larger than a critical value or the ejected liquid viscosity exceeds a threshold, with the other parameters remaining constant. Cui et al. 9 experimentally investigated the influence of conical, inclined, and diameter error on the internal flow evolution of a pressure swirl atomizer. They observed that the incline of the nozzle orifice increases the critical point of the air core inception and growth process. Chinn et al. 10 compared the air core formation of a swirl injector having two tangential inlets with that of a swirl injector having eight tangential inlets. The helix number and helix angle were sensitive to the tangential inlet number. Zhang et al. 11 investigated the effect of the injection pressure drop and orifice diameter on spray morphology. They determined the correlation between the spray angle and Reynolds number. Guan et al. 12 analyzed the formation process of a swirl injector by a high-speed camera and Malvern laser particle size analyzer. They investigated the flow coefficient, cone angle of the swirl atomizing spray, breakup length of the spray membrane, and droplet size distribution.
With the advancement in interface tracking methods and computer technology, it is feasible to simulate the formation and breakup of a liquid film. Shim et al. 13 successfully simulated the formation and development process of a vortex in a pressure swirl injector under high ambient pressure by using a hybrid breakup model. They determined that the spray angle and spray tip penetration increased as the ambient pressure increased. Galbiati et al. 14 adopted 30,300,000 cells to investigate the primary breakup mechanism of a pressure swirl injector using the volume of fluid (VOF) model. The velocity vector and spray pattern under four magnitude grids were observed after breakup lengths were compared. The authors concluded that the calculation precision and results were significantly affected by the grid scale. Similarly, Fuster et al. 15 indicated that an unphysical breakup process would be observed with a coarse mesh. The high cost and long simulation time together hinder the investigation of the formation and breakup of the spray by using only numerical simulation.
Presently, researchers are paying attention to the atomization quality of spray in terms of the spray angle, particle size, and velocity distribution.16–19 Although the above studies discussed the dynamic characteristics of an injector (including the liquid filling, breakup process, and spray pattern as mentioned earlier), they were essentially aimed at the classical swirl injector. However, there are many differences between the formation and breakup process of the spray of an open-end swirl injector and that of a classical swirl injector because of their structural differences. In addition, open-end swirl injectors are generally used in modern liquid oxygen (LOX)–kerosene rocket engines such as RD-120 and RD-170 for better stability characteristics.20,21 Therefore, there is a severe deficiency of systematic research on the filling, formation, and breakup process of open-end swirl injectors.
In this study, a high-precision optical measurement method and an effective interface tracking method (VOF model) were combined to systematically study the filling, formation, and breakup process of the liquid sheet in an open-end injector. In addition, the spray patterns under different pressure drops were visualized.
Experimental setup and numerical methods
Experimental setup
The experimental system includes a supply system, a data acquisition system, and an optical measuring system. The spray pattern of the open-end swirl injector was captured using a high-speed shadowgraph system, as shown in Figure 1(a). The formation and breakup process of the open-end swirl injector was captured using a high-speed backlight system, as shown in Figure 1(b). The transparent nozzle was made of acrylic. Distilled water was used as the liquid propellant. A pressurized supply system with a maximum pressure drop of 13 MPa was used to realize a stable injection pressure drop. The expected pressures and flow rate were measured by pressure sensors and a liquid vortex flowmeter, respectively, with a response frequency of 1000 Hz. The pressure sensors had a measuring range of 5 MPa with an accuracy of ±0.1%. The liquid turbine flowmeter had a measuring range of 0.15–1.5 m3/h with a precision of ±0.1%. The high-speed camera is of the SA2 type of FASTCAM, with a shooting frequency of 1000 frames per second. The image size corresponding to an exposure time of 2.7 μs is 2048 × 2048 pixels. The light source of the high-speed backlight system is a 50 × 50 cm LED matrix screen. Four splash boards were installed around the collectors to prevent splashing droplets.

Measurement system. (a) High-speed shadowgraph system. (b) High-speed backlight system.
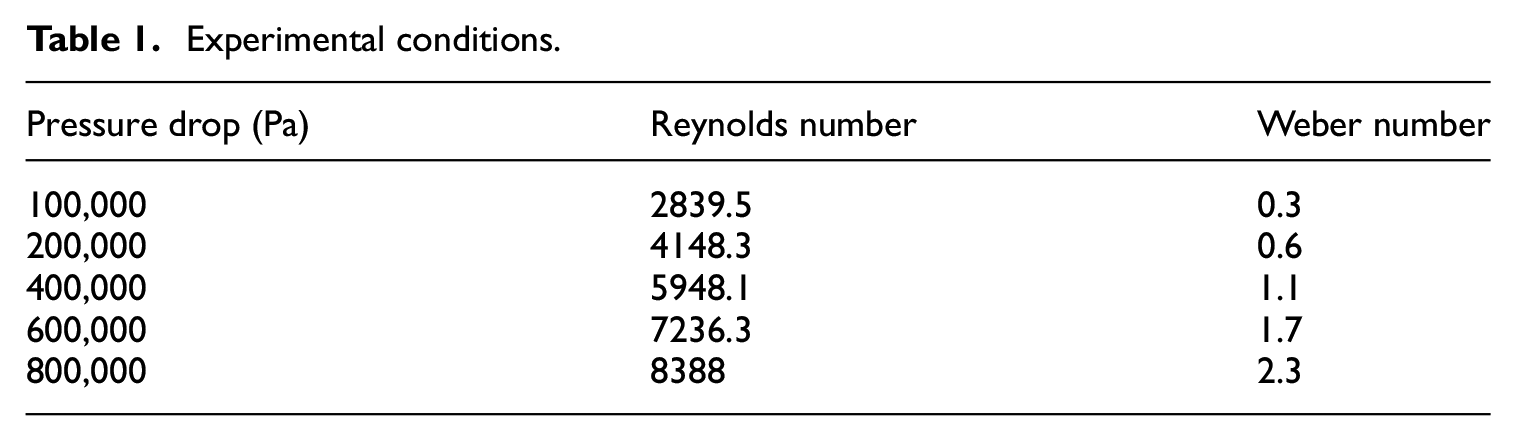
Figure 2 illustrates the geometrical structure of the transparent open-end injector used in the experiment. In Figure 2(b), the joint of the fixture and the injector differ in color, which aids in distinguishing between the two. A test was conducted to adjust the injection pressure drop to the expected value before the formal experiment on the filling and formation process was performed. During the experiment, the pressure was regarded as stable when the pressure fluctuation was below 0.005 MPa in 30 s. The final injection pressure and mass flow rate were the average values of the data on the stable 30-s period. The spray angle was averaged from 100 images, whose relative errors were within 5%. The repetition of the tests was within 5%. The experimental conditions are summarized in Table 1.

An open-end swirl injector. (a) Injector schematic. (b) Transparent injector with fixture.
Experimental conditions.
Numerical methods
Based on the FLUENT platform, the VOF model was adopted as the interface capture method. The VOF method is frequently combined with high-fidelity direct numerical simulation (DNS; or at least large eddy simulation (LES)). Zhang et al. 22 and Liu et al. 23 demonstrated that VOF in a Reynolds-averaged Navier–Stokes (RANS) framework could also yield good simulation results. The RANS method was adopted considering the limitation on the computing resources. Air and water were used as the first and second phases, respectively, in the numerical simulation.
The governing equations are expressed in Cartesian coordinates as


Given the distribution of the flow field and initial volume fraction, the volume fraction of the transport equation is as follows

The average properties of a cell in the mixture region could be expressed as


where
The solution of equations (1)–(3) must be combined with the mass and momentum conservation equations. The pressure staggering option (PRESTO) was used as the discretization scheme for pressure. The turbulence model was a renormalization group (RNG)
The density ratio has to be maintained within a certain limit to ensure numerical stability. Therefore, many methods were adopted to improve the convergence. The CSF model was used to model surface tension. The coupling velocity and pressure equations were solved with the pressure-implicit method of splitting operators (PISO) algorithm. A smaller relaxation factor was selected at the beginning of the simulation.
The grid structure and boundary conditions of the injector are shown in Figure 3. Here, the interface between the tangential inlet and swirl chamber exhibits a raindrop shape. Therefore, whereas the cells in the tangential inlet and at the top of the swirl chamber are tetrahedral, the remaining cells are hexahedral. The injector orifice area was divided into three parts: the central area, inner contour area, and outer contour area. The meshes of the inner contour area and outer contour area, which were near the envelope of the spray cone angle, were refined. The verification of the calculation method is presented in Table 2. Two straight lines were fitted through the edge of the spray during the image processing. The angle between the two straight lines was considered the spray cone angle.24,25 Furthermore, the value of the spray cone angle obtained using the empirical formulas and that from the experimental results display good consistency, with a maximum deviation of 5%.
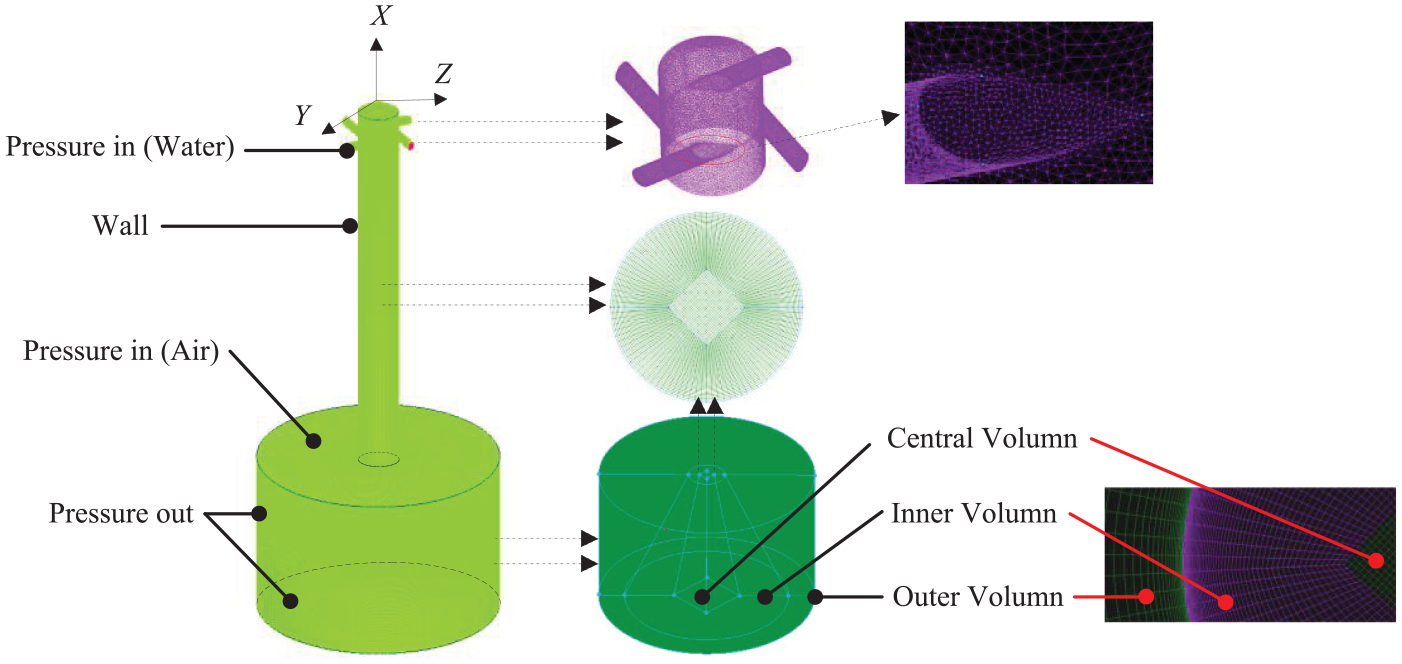
Computational domain and mesh.
Calculation method verification.

CFD: computational fluid dynamics.
The calculation accuracy was controlled effectively by a mesh-independent verification and an appropriate convergence criterion. Figure 4 shows the static pressure in the X-direction and the relative error δ of the mass flow rate between import and export. The static pressure, which is the difference between the absolute and atmospheric pressures, tends to be stable (with a fluctuation of ±15 Pa). δ is less than 1%. Thus, the numerical simulation is considered to have converged.

Validation of the convergence.
Grid 1 (1,250,000 cells), grid 2 (2,390,000 cells), gird 3 (4,760,000 cells), and gird 4 (7,630,000 cells) are used to illustrate the grid independence in Figure 5. Figure 5(a) shows the position of the gas–liquid interface and static pressure distribution along the X-axis. Figure 5(b) presents the distribution of the axial and tangential velocities on the axial plane at X = 30 mm. The calculation results of the four grids display good consistency. The differences in the results among the four meshes are marginal. Figure 6 shows the volume fraction in a median plane for different mesh sizes. Smaller spray angle and liquid film thickness are observed in Figure 6(a). An unphysical breakup processes would be observed using a coarse mesh. Figure 6(b)–(d) presents approximately identical spray images. After considering the computing resources and flow field detail comprehensively, 4,760,000 cells were adopted.
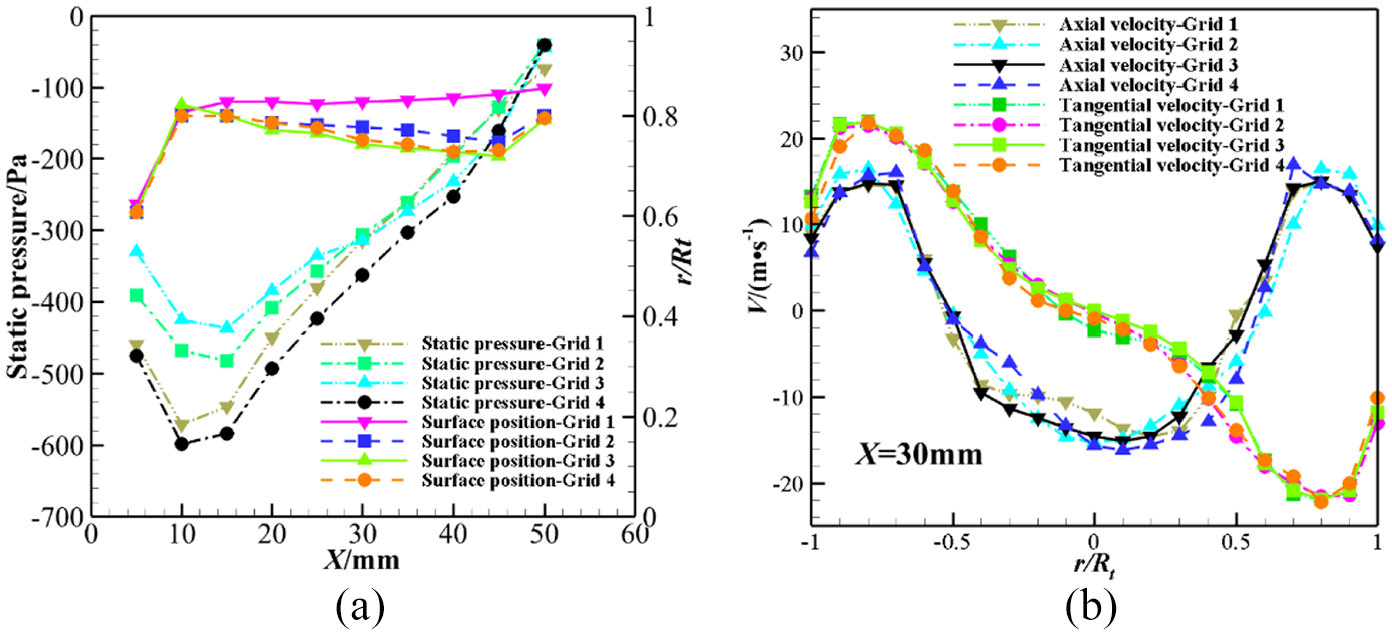
Grid independence study (ΔP = 0.5 MPa). (a) Gas–liquid interface position and static pressure distribution. (b) Axial and tangential velocity.

View of volume fraction in a median plane for different mesh sizes. (a) 1,250,000 cells. (b) 2,390,000 cells. (c) 4,760,000 cells. (d) 7,630,000 cells.
Results and discussion
Filling process of liquid film
Figures 7 and 8 present the experimental and simulation results, respectively, of the filling process of the open-end swirl injector under an injection pressure drop of 0.5 MPa. The tangential velocity in the injector center after the liquid had flown into the injector from a series of tangential inlets was significantly high. Consequently, the pressure in the axial center was low enough for the outside air to be sucked into the swirl chamber to form the air core, as shown in Figure 7.

Filling process of the open-end swirl injector in the numerical simulation. (a) Experiment result. (b) Numerical simulation.

Filling process of the open-end swirl injector in the experiment. (a) 9 ms. (b) 17 ms. (c) 24 ms. (d) 44 ms. (e) 79 ms. (f) 120 ms.
A sequence of letters was used in the experiment rather than the filling time, as shown in Figure 7. It is evident that the liquid filled the swirl chamber in a column because it did not attain a strongly swirling flow. The hollow vortex was induced by a strongly swirling flow after the injection pressure drop attained the expected value. Therefore, the swirl motion caused by the radial pressure gradient and convection caused by the axial pressure gradient eventually formed a hollow vortex from the bottom to the top, as shown in the red square of Figure 8(a)–(c). Large droplets accumulated in the actual combustion chamber application during the initial pressure building process.
The spray pattern of the cross-section at the tangential inlets also varied during the filling process. It could be expressed by the variation in the vortex’s shape, which changed from square to a petal shape and, finally, to circle. This illustrates that the stabilization of the gas–liquid interface also requires time.
Formation and breakup process
Figures 9 and 10 illustrate the formation and breakup process of the spray under an injection pressure drop of 0.5 MPa determined by numerical simulation and experiment, respectively. The recorded time was measured from the instant when the liquid was ejected out of the injector exit.

Breakup process of the open-end swirl injector in the experiment. (a) 26 ms.(b) 30 ms. (c) 31 ms. (d) 40 ms. (e) 41 ms. (f) 42 ms. (g) 43 ms. (h) 44 ms. (i) 48 ms. (j) 51 ms.(k) 54 ms. (l) 64 ms.

Breakup process of the open-end swirl injector in the numerical simulation.(a) 4.2 ms. (b) 4.8 ms. (c) 5.2 ms. (d) 5.8 ms. (e) 6.2 ms. (f) 6.7 ms. (g) 7.2 ms. (h) 8.7 ms.(i) 9.2 ms. (j) 9.7 ms. (k) 10.0 ms. (l) 34.9 ms.
A conical liquid sheet was formed because of the tangential and axial velocities. The liquid sheet spread along the radial direction under the centrifugal force. The spray formed an inward contraction at a point where the centrifugal force was not sufficient to overcome the surface tension. Thus, a liquid sheet bag was formed at 26 ms, as shown in Figure 9.
A Kelvin–Helmholtz (KH) wave was generated by the slip velocity between the liquid sheet and ambient air. As the KH wave developed and the liquid sheet continued to open, the surface tension became insufficient for sustaining the liquid sheet bag at a particular point. Consequently, the liquid sheet broke up, as seen in region A at 30 and 31 ms, respectively. A comparison of region A between 30 and 31 ms revealed that the liquid sheet in certain regions thinned, whereas it broke up directly in others. This indicates that the liquid sheet does not break immediately and must first experience thinning. In addition, disturbance waves gradually appeared on the liquid sheet. The liquid sheet tended to tear away at the crests and troughs at the magnitude of a half- or full-wavelength at the leading edge, when the wave amplitudes attained a critical value.
As the opening process continued, holes appeared on the surface of the liquid sheet at a distance from the exit, such as holes B and C at 40 ms in Figure 8. Holes B and C rapidly grew to result in the formation of an irregularly shaped liquid sheet or ligaments under the effect of the aerodynamic and inertial forces. Following this, other holes on the liquid sheet surface, such as holes D and E, grew until they were crushed to repeat the process of holes B and C. A few holes merged with other holes during this process. Thus, the process of formation, growth, and shedding continued on the surface of the liquid sheet.
At 40 ms, only the spray area became larger. The spray cone angle and breakup length did not vary significantly. A fully developed hollow cone was formed at 64 ms. The larger the distance from the injector exit, the denser was the surface wave. This phenomenon can be explained as follows: the initial disturbance and surface wave amplitude increased gradually to result in a transformation from a long wave with low amplitude to a short wave with high amplitude. 26
The shedding parts contracted under the effect of the surface tension. As their velocities continued to be significantly high, the velocity difference between the shedding parts and downstream air caused them to twist and deform until they shed again under the effect of the aerodynamic force. Therefore, the shed ligaments or large drops continued to break up during the downstream movement. During the breakup process of the shedding parts, they also united with the surrounding small drops, as shown at 42 ms.
In the experiment, three-dimensional physical images were projected onto two-dimensional space. It was challenging to clearly display certain details pertaining to the optical resolution and high flow velocity. Therefore, a numerical calculation was performed to compensate for these defects. Figure 10 shows the numerical simulation results of the breakup process at the injector outlet.
Wrinkles reappeared at the head of the liquid film as the liquid film continued to develop, as shown in region B at 4.8 ms. However, the wrinkles kept growing and did not fall off immediately, as shown in region B at 5.2 and 5.8 ms. The inertial force was not adequate to overcome the surface tension from 4.2 to 5.8 ms. In addition, the expanded liquid film appeared as a closed liquid film package under the contraction of the surface tension during this period. At 6.2 ms, the wrinkles fell off again and finally broke up into small droplets when the disturbance increased to a level adequate to overcome the surface tension, as shown in region B at 4.8 ms. The liquid film package spread gradually to form a hollow tulip shape, and new wrinkles at the head of the liquid film could be observed at 6.7 and 7.2 ms. After the liquid film fell off, the ligaments continued to undergo a re-splitting and crushing process, and aggregated with nearby droplet clusters or small droplets, as shown in region C at 7.2 and 10 ms.
The liquid sheet repeated the stages of thinning, deforming, shedding, breakup, and coalescence during the formation and breakup process. At 10 ms, the big droplet clusters and large ligament in the outer spray cone disappeared. Finally, at 34.9 ms, the flow field at the injector exit appeared as a fully developed hollow cone. As illustrated above, the spray evolved from the complete liquid film zone to the ligament zone and, finally, to discrete droplets.
Spray pattern
Figure 11 shows the variation in the spray pattern with the injection pressure drop. The spray appeared as a distorted pencil at 0.002 MPa. It contracted to a thick liquid sheet at the edge under the effect of the surface tension. At this instant, the inertial force dominated, and the spray was ejected by the liquid column. Similar to the plain injector, the axial velocities of the large drops dominated, which caused them to move downstream vertically.

Images of the spray pattern. (a) 0.002 MPa. (b) 0.005 MPa. (c) 0.015 MPa.(d) 0.02 MPa. (e) 0.03 MPa. (f) 0.1 MPa. (g) 0.2 MPa. (h) 0.4 MPa. (i) 0.6 MPa.
As the liquid sheet spread radically under the centrifugal force, the swirling flow became noticeable after 0.005 MPa. However, the velocity of the liquid sheet decreased under the effect of the aerodynamic and viscous forces along the direction of downstream motion, thereby weakening the centrifugal effect. At a certain point, the centrifugal force was insufficient to overcome the surface tension and viscous force, and the spray contracted to form a liquid sheet bag. Consequently, it acquired an onion shape under the destructive and consolidating forces, and opened at an angle at a distance from the injector exit.
After 0.005 MPa, the shedding large drops spread substantially. The point of balance between the destructive and consolidating forces moved down gradually as the injection pressure drop increased. At 0.1 MPa, the liquid sheet bag opened as the surface tension was insufficient to overcome the destructive force. Furthermore, the destructive force is not sufficiently large to negate the surface tension completely at the leading edge. Therefore, the spray acquired a tulip shape. After 0.2 MPa, the destructive force began to dominate completely, and the curved liquid sheet transformed into a hollow cone. The spray pattern did not vary significantly thereafter, although the spray angle and breakup length increased marginally, as shown in Figure 11. It is evident that the increase in the spray angle slowed down, with a maximum fluctuation of 4%. The spray morphology evolution with the injection pressure drop agrees well with Lefebvre’s theory. 27
The relative velocity between the inner and outer surfaces of the liquid sheet and surrounding air increased with the increase in the injection pressure drop. This enhanced the aerodynamic force accordingly, which further promoted the development of the KH wave. It increased the fluctuation on the liquid sheet surface so that the point of balance between the destructive and consolidating forces moved down. The breakup length reduced as the axial velocity increased, as shown in Figure 12. The breakup length is defined as the distance from the injector exit to the first point where the liquid water content is 0.5. With the increase in the injection pressure drop, the distance between the adjacent peaks reduced, whereas the amplitude of the surface waves increased, particularly under 0.6 MPa.
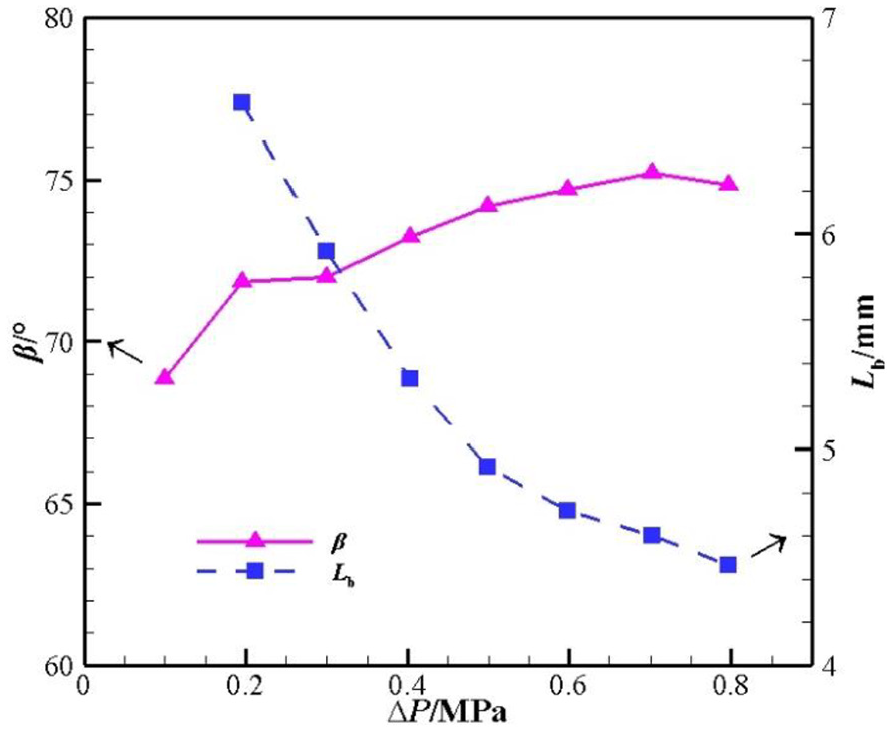
Variation in the spray angle and breakup length at different injection pressure drops.
The variation in spray pattern was caused by the increased injection pressure drop. The formation and breakup process shown in Figure 9 occurred under an identical injection pressure drop. There are numerous similarities in the formation and breakup process shown in Figures 9 and 11. The combined effect of the destructive and consolidating forces induced similarities between the formation and breakup process under a high injection pressure drop and the variation in spray pattern because of the increased injection pressure drop. Lefebvre 27 observed that a spray undergoes several stages with an increased injection pressure drop (Figure 13). The formation process also underwent the distorted pencil stage (4.2 ms), onion stage (4.8 ms), tulip stage (5.8 ms), and fully developed stage (34.9 ms) in turn (Figure 10). This implies that all the spray development stages except the dribble stage were experienced. The dribble stage occurred only under a very low injection pressure drop. Fung 28 also observed this noteworthy phenomenon.

The comparison of spray pattern development stage with that of existing research. (a) Distorted pencil stage. (b) Onion stage. (c) Tulip stage. (d) Fully developed stage.
Conclusion
Experiments and numerical simulations were performed to investigate the formation and breakup process in an open-end swirl injector.
A hollow vortex was formed from the bottom to the top in the experiment. This was different from the numerical simulation.
The stability of the spray pattern of the cross-section at the tangential inlets requires the occurrence of a process. It needs further study through a more elaborate numerical simulation or experiment.
The formation, enlargement, shedding, and polymerization of small holes on the surface of the liquid film continued to occur. The shed ligaments and large droplets also repeatedly underwent deformation, shedding, breakup, and coalescence.
The combined effect of the destructive and consolidating forces induced similarities of variations in spray patterns between the formation and breakup process under a high injection pressure drop and that under a different injection pressure drop. The formation process of the open-end swirl injector also underwent a distorted pencil stage, onion stage, tulip stage, and fully developed stage in turn.
Footnotes
Acknowledgements
The authors would like to express their sincere gratitude for the significant assistance of Mao-xiong Yue for optical measurements.
Author’s Note
Chen Chen is currently affiliated with Key Laboratory of Icing and Anti/De-icing, China Aerodynamics Research and Development Center, P.R. China.
Declaration of conflicting interests
The author(s) declared no potential conflicts of interest with respect to the research, authorship, and/or publication of this article.
Funding
The author(s) disclosed receipt of the following financial support for the research, authorship, and/or publication of this article: This work is supported by the Foundation Research Project of Jiangsu Province (The Natural Science Fund BK20180982) and Open Fund of Key Laboratory of Icing and Anti/De-icing (Grant No. IADL20190310).