
Abstract
Prior safety evaluations of interchange merging areas have mostly focused on traffic conflicts and operating speeds, without considering how these factors can influence the driver workload. Researches regarding the level of driver workload have largely concentrated on urban roads, tunnel sections, and basic freeway segments, without considering the impact of merging traffic flows on safety. Therefore, this study has investigated how merging vehicles can impact through-driver workload and safety. Three independent field experiments were conducted on freeways, involving 18 drivers and 17 interchanges. The results showed that the vehicles merging onto freeway impact driver workload and driving performance, generating potential risk that cannot be ignored. Merging into the mainline traffic flow increases the through-driver workload to a higher level or even exceeds the safety threshold, despite there being better geometrical conditions of interchanges than those of basic freeway segments. When the volume of merging vehicles exceeds 564 pcu/h or the traffic saturation is above 0.485, driver workload rises above the safety thresholds and the driving risk is elevated, which potentially would lead to crashes. This study offers insights for more effective segment division of operating speed prediction, and dynamic risk management with regard to interchange safety.
Introduction
As the volume of traffic has increased, it has resulted in much more congestion at interchanges, especially older ones, which severely impacts interchanges’ efficiency and safety and even leads to crashes. Freeway interchanges are high-risk areas because of their intricate geometric configuration, the demand for lane-changing, and variable driving speeds. 1 Previous studies have found that the rate of crashes per kilometer is much higher in interchange areas than in other freeway segments. 2 According to crash statistics from 2014 to 2016 recorded by the transportation administration department in Jiangsu Province in East China and collected and analyzed in this study, crashes over the three years across the whole province numbered 44,256, with 971 deaths and 4819 injuries. However, 6298 of these crashes occurred in interchange merging areas, accounting for 14.23% of the overall crashes and averaging 17 crashes per day—119 people died and 477 people were injured in these crashes, accounting for 12.26% and 9.99% respectively in Figure 1. This amounts to a tremendous loss of property and rate of casualty. In view of this, the first step that needs to be undertaken is to use safety evaluation methods to determine the current safety level and find out the most dangerous spot or segment of an interchange. Then countermeasures can be taken to reduce the risk.

Crashes at interchange merging areas in Jiangsu Province.
Gu et al. 3 and Li et al. 4 used traffic conflict technology to analyze driver behavior and safety factors in merging areas; multifactorial prediction models were established to evaluate the safety level of merging areas based on Time To Collision (TTC) metrics. Ma 5 measured the free speed of cars in merging areas at 12 interchanges using a chained radar velocimeter; speed models were developed for the gore nose and the end of acceleration lane, which were validated and then used to evaluate the safety of merging areas based on speed consistency. Calvi and De Blasiis 6 found that the behavior of drivers merging onto the mainlane was significantly influenced by the traffic volume in the through lanes and less affected by the acceleration lane length. Ahammed et al. 7 collected the speed and traffic volume data for merging areas, and developed several speed models that related to merging speed, merging distance, and geometric and traffic characteristics. This was then used to establish a safety performance model related to the total collisions in the merging area. Yuan et al. 8 investigated the safety effects of weaving length, traffic conditions, and driver characteristics on drivers’ mandatory lane change behavior by using a driving simulator, and weaving length per lane change for the ingress of managed lanes system was recommended. It was also found that speed harmonization could significantly improve lane change safety in the merging area. Hao 9 found that the curve radius of a ramp was negatively related with increases in people’s heart rate (HR). However, the operating speed and slope grade were found to be positively related with HR increases. A set of methods was therefore established to evaluate driver workload on ramps. Wu 10 found that heart rate variation (HRV) was the most suitable physiological index to represent driver workload, while comparing it to blood volume pulse (BVP), respiratory rate (RR), skin conductivity (SC), and HR. Yuan et al. 11 conducted field experiments in urban road environments, including intersections, ramps, and other types of urban road segments, and found that HRV can effectively indicate driver workload discrepancies for different urban road environments. Mahmoud et al. 12 built scenarios relating to different highway work zones in simulated driving environments to study the relationship between driver workload and HRV; results showed that HRV measures increased with traffic density and could be used to evaluate the driver workload. Zhu et al. 13 conducted field experiments in two extra-long tunnels and explored a driver workload model that was based on an analysis of both HR and HRV. They found that HRV had higher levels of reliability and validity than HR for the calculation of driver workload. De 14 used a driver’s state effort and task effort to divide workload and performance into six regions; HRV was the most sensitive in the A3-region. Jin 15 collected a driver’s electrocardiograph data when driving on a mountainous freeway and analyzed the HRV data. Horizontal curves with a radius smaller than 1000 m had an impact on the HRV and the driver workload increased.
In summary, previous safety evaluation studies of interchange merging areas have chiefly focused on traffic conflicts and operating speed, without considering how these factors can influence the driver workload and performance. The literature that studies driver workload to evaluate safety levels has concentrated on driving environments such as urban roads, highway work zones, tunnel sections, and basic freeway segments. In view of the special traits of traffic flows in merging areas, the study attempts to discover the rules pertaining to driver behavior and workload when drivers pass through merging areas. It also tries to develop a method to evaluate the safety level in merging areas through a series of field tests.
Theoretical basis
When driving on highways in different environments, drivers have to continuously process a variety of road and traffic information and adjust the state of the vehicle correspondingly. However, a driver’s capacity to process information and operate vehicles is limited by human brain. If the conditions are excessively complex, a driver's capacity is overwhelmed and some important information can be overlooked, leading to the feelings of pressure and stress and thus increasing the likelihood of a crash. 16 If the conditions are excessively simple without enough stimulation from the surrounding environment, for instance, when driving on a long straight highway with a boring landscape, the driver workload will reduce and the driver’s attention to the driving task may slacken off, resulting in a slow response to emergency and even falling asleep. 17 The literature on driver safety and driver workload confirms that accident risks and driver workload are strongly associated18,19 and that increasing driver workload can result in a degradation of driving performance. 20 Together, these findings suggest that drivers need a normal workload to be able to respond and operate in a timely and safe way when driving on highways.
Many physiological indicators can reflect the human response to external sources of driving workload and can be used to evaluate its physical and mental characteristics. 14 One of the most common indicators relating to cardiac activity and driving workload is HRV.21,22 HR is expressed as the number of heart beats per some scale of “real” time. HRV is the variation in the time between each heart beat over a successive period, that is, the physiological rhythm within the oscillations of the intervals between consecutive and instantaneous HRs. To determine the HRV, the fluctuations in heartbeats are commonly analyzed across two different domains: the time domain and the frequency domain. LF is a low frequency HRV band (0.04–0.15 Hz) in the frequency domain. This is related to the regulatory activity of the parasympathetic and sympathetic nervous systems. HF is a high frequency HRV band (0.15–0.4 Hz) in the frequency domain. This is related to the regulatory activity of just the parasympathetic nervous system. The LF/HF ratio measures the cardiac balance of the automatic nervous system and basically represents the sympathetic nervous tension and can further indicate the driving workload. 23 To characterize the impact of driving speed on HRV, driver workload can be quantified by equation (1), with the safety levels as shown in Table 1.24,25(LF/HF)m is the HRV baseline for each driver and it is the mode value of (LF/HF)i in real time when maneuvering on a flat straight segment of freeway. Thus, the variations between different drivers and other factors can be minimized, such as age, skill, gender, personality, equipment familiarity, and kind of car (LF/HF)i can be detected successively in real time by electrocardio instruments

where K is the driver workload in real time; HRVi equals (LF/HF)i in real time; HRVm indicates (LF/HF)m, which is the mode value of the heart rate variability during the flat straight segment of freeway; and Vi denotes the driving speed in real time (40 km/h ≤Vi≤ 120 km/h).
Car driver workload classifications and thresholds.

Driver workload varies according to the road geometry on basic freeway segments. When the radius of the horizontal curve is flatter than 930 m and the longitudinal slope is less than 2.5%, the driver workload remains within the safety level.15,17 With the exception of cases where the design speed is 60 km/h, which is rare on Chinese freeways, the geometrical conditions of interchange segments are obviously better than those of basic freeway segments and they usually satisfy the safety level conditions for driver workload, as shown in Table 2. However, interchange segments are still more prone to crashes than basic freeway segments, with there being more traffic conflicts, 4 unpredictable traffic flow, and variable traffic density. 6 This means that the risk at interchanges, rather than being the result of geometrical conditions, is mostly caused by complicated traffic conditions, which increases through-driver tasks and workload. In that case, studies of driver workload at interchanges need to focus on the impact of traffic conditions.
Comparison of geometrical parameters between basic freeway segments and interchange segments in China.

BFS: basic freeway segments; IS: interchange segments.
Methodology
Test segments
To study the impact of traffic conditions on through-driver workload at interchanges, three segments of four-lane freeways with a total of 17 interchanges were selected to implement the experiments. They were as follows: the Beiwu-Nantaiwu segment of the BeiJing-Pinggu Freeway, with eight interchanges, in Beijing; the Luogang-Shanji segment of the Lianyungang-Xuzhou Freeway, with five interchanges, in Jiangsu Province; and the Jurong-Danyang segment of the Shanghai-Ningbo freeway, with four interchanges, in Jiangsu Province. The minimum radius of the horizontal curve is 1700 m and the maximum slope grade is 2% across the freeway test segments, so the impact of the mainline geometric conditions on driver workload can be ignored. None of the geometric parameters of the interchanges violated standard design specifications, 26 such as sight distance, length of the speed-change lanes, width of the lanes, and interchange space. Traffic facilities, including markings, signs, and guardrails, were deployed properly, so the impact of other factors on driver workload was minimized. Monitoring cameras were set at intervals of about 1 km along the freeways. Each experiment was performed independently, on flat and dry pavements under a clear sky.
Participants
To minimize the variations between different drivers and their impact on the test result with regard to age, gender, experience, health, personality, and so on,27,28 six drivers with medium skills were selected randomly for each experiment to represent the typical characteristics of total drivers according to the random sampling theory in math, with a total of eighteen drivers participating in the test. Their ages ranged from 25 to 45 years old (mean = 31.3, variance = 3.6). All the drivers had valid driving licenses and over three years of experience. They were all in good health and had no history of cardiovascular disease. They were instructed to get sufficient rest and abstain from excitement or alcohol 24 h before the tests. Each of these adverse factors can impact the accuracy of the HRV, and should be avoided.
Equipment
The primary equipment included the test car, a global position system (GPS), and a physiological detector, as shown in Figure 2. The dynamic GPS (model: NovAtel DL-V3) was able to record longitude, latitude, altitude, time, and the speed of the car. The data collection frequency was 20 Hz. The dynamic multi-parameter physiological detector (DMPD, model: KF2) was able to record the driver’s electrocardio signal in real time. The detection frequency was 200 Hz. The car digital video recorder (DVR) recorded 1080 p driving videos at the front of the car.

Experimental equipment: (a) test car with GPS and (b) DMPD.
Procedure
All of the participants and research personnel gathered at the experiment base, which was located at the management center of the first interchange. Although merging vehicles (MV) have hardly any impact on drivers passing through an interchange on the inside lane, the through-lane that is adjacent to the acceleration lane (defined as the outermost lane) can be influenced by MV more severely than the other ones, so the drivers were required to pass through the merging area on the outermost lane. The drivers were given detailed information about the objectives of the study, the potential risks and emergency operations, the route, and the chosen lane in the merging area as shown in Figure 3 before each test. Speaking and answering phone calls were forbidden during the test.

Driving route and lanes in the merging area.
The procedures in the experiments were as follows:
The monitoring cameras for the test segment were adjusted in the Freeway Management Department Center to shoot the merging area of the interchanges in advance, and they then recorded videos continuously during the whole experiment.
The GPS was fixed on the roof of the car, and the time of all the equipment was calibrated according to the GPS time, including the DMPD, DVR, computer, and hand-timer. The driver put on the DMPD and sat comfortably to adapt himself to environment in the car.
All the equipment was checked again, while the driver took a rest for about 5 min before driving. Then the experiment started, the start time was noted, and the driver drove onto the freeway.
When the first advance guide sign was seen, the driver maneuvered to the outermost lane and went through the merging area without changing lane, to study how MV influenced their workload and behavior. One km downstream of the entry gore nose, the driver was allowed to maneuver freely.
During the whole test, the accompanying personnel wrote down the time at characteristic points, including the advance guide sign placed at 2 km, 1 km, and 0.5 km in advance of the exit, the beginning point of the deceleration taper, the gore nose at the exit and the entry, and the end point of the acceleration taper. Other events that might also influence the HRV were written down, such as overtaking, changing lane, and speaking and answering phone calls.
When the driver got close to the next interchange, they repeated Steps (4) and (5) until the driver left the freeway at the last interchange. Then the driver turned back and started the other directional test until returning to the experiment base, where the experiment ended and the end time was noted.
All of the equipment on the driver was removed and put onto the next candidate. Then the above steps were repeated until all test drivers finished all cruise.
Results
Data processing
It is seen as one sample that a driver passes through a merging area, so there are 396 raw samples for merging areas. Invalid samples were first discarded before further data process, such as driving through the merging area in the wrong lane, congestion in the merging area, equipment breakdown, speaking and answering phone calls, and unexpected incidents in field test.
The GPS and DMPD data were first processed by the support software. The time and speed were picked out from the GPS data (20 Hz) and the time and LF/HF values were picked out from the electrocardiographic data (200 Hz). Twenty speed values and 200 LF/HF values over 1 s were averaged to a value per second. According to the recorded times corresponding to the speed values, the LF/HF values were established to fill in the corresponding blanks, with each characteristic point being marked in the same way. Thus the speed and LF/HF values and the characteristic points were matched and synchronized. Any missing of speed or LF/HF value was discarded from the final database. A set of big data processing tools was developed, based on Micro Excel VBA, to speed up the raw data processing. (LF/HF)m was the mode value of (LF/HF)i when the driver maneuvered on a flat straight segment of freeway, without overtaking, changing lane, speaking and answering phone calls, and so on. The K value in real time was calculated using equation (1), and part of the processed data in a merging area is shown in Table 3.
Example of the processed data in a merging area.

LF: low frequency; HF: high frequency.
The vehicles in the through-lane (Section 1 in Figure 3) and the on-ramp lane (Section 2 in Figure 3) were counted manually from the monitoring videos captured at the Freeway Management Department Center. The timespan used for measuring the traffic volume was the time taken to drive from the entry gore nose to 1000 m downstream of it. Finally the cross-sectional traffic volume for the through-lane and the on-ramp lane was converted into pcu/h. The traffic saturation (TS) is defined as the ratio of the through volume to the design capacity.
Driving speed
The speeds in the different merging areas (Number: MA01-MA12) were selected randomly from the database to represent the characteristic of total samples, as shown in Figure 4. Drivers were influenced by MV to different degrees when passing through the merging areas under different traffic conditions. When driving away from the diverging areas, most drivers were prone to speed up a little without any impact from the exiting or entering vehicles. The vast majority tended to decelerate in the merging area to keep a safe space headway and avoid rear-end crashes, as the vehicles from the ramp entered the mainline. Even if there was no vehicle in the outside lanes, the drivers still tended to slow down slightly in case of emergencies, for example, MA04, MA05, and MA12. Some were forced to decelerate sharply when the outside vehicles suddenly intruded into the outermost lane when the volume of MV was high, for example, MA01, MA02, and MA06. Generally, the higher the volume of MV, the more likely the drivers would slow down. When the traffic density in the mainline was lower than 7 pch/km/ln, the drivers could maneuver freely in different lanes and accelerate into the inside lane to avoid feeling the impact (e.g. MA09). Thus, the TS along the mainline may also have an effect. When approaching the end of the acceleration lane, the through-lane and the on-ramp drivers adjusted the state of their vehicles accordingly and sped up to the expected speed. Both kinds of traffic flows merged together a certain distance from the downstream taper, at which point, the influence of the merging was over and the drivers kept going along the basic freeway segment, without paying further attention to the MV.
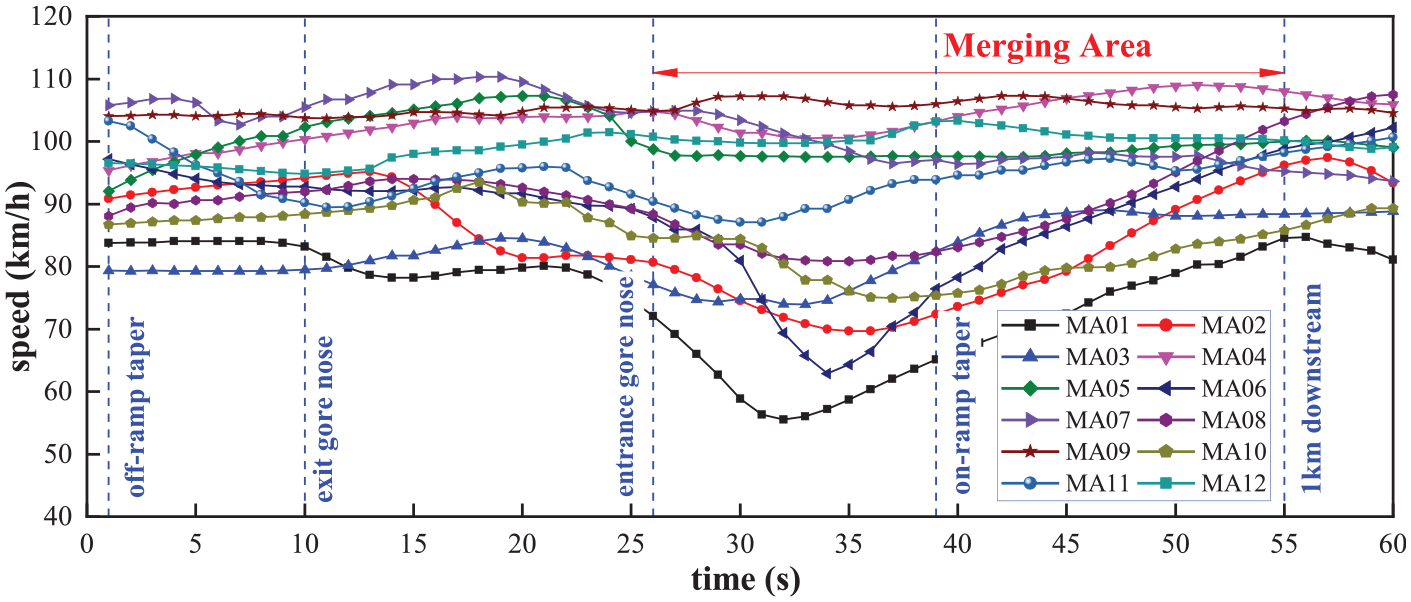
Driving speed in the interchange.
Driver workload
The driver workload (K) for the different merging areas was selected randomly from the database to represent the characteristic of total samples, as shown in Figure 5 (Number: MA01-MA10). This was influenced by the MV when passing through the merging areas under various traffic conditions. Generally, the driver workload (K) was prone to increase in the merging area, meaning that drivers were making a greater mental effort, concentrating their attention on the driving tasks, and preparing to act in case of an emergency. In most cases, the maximum driver workload (K) appeared near the middle of the merging area, because the vehicles merge into the mainline intensively in this segment. If the volume of MV is lower and the space headway is larger, it is easier for the on-ramp drivers to find space to change lane. Here, the through-drivers observed the state of the vehicles in front and slowed down just slightly to provide on-ramp drivers the opportunity to merge. In this case, the merging flow didn’t have much impact on the through-drivers, the driver workload was still at a safe level and the drivers could respond in a timely way and operate effectively, for example, MA04, MA06, MA07, MA08, MA09, and MA10. However, as the volume of MV and TS increased, the space headway was compressed, the through-drivers cannot maneuver freely in different lanes and they had to process more road and traffic information at the same time. This lifted the driver workload close to the danger threshold, for example, MA03, MA04, and MA05. If the volume of MV and TS continued to increase, the reaction time was further reduced, obliging through-drivers to make an even greater mental effort and to manage the state of their surroundings under greater stress. When driver workload exceeds safety thresholds, it is prone to make errors that may result in a crash. The drivers were in a particularly tense state under these conditions and drove cautiously to mitigate the impact of the MV until they had passed through the merging area. At this point, all of the vehicles merged into the mainline and the influence of the MV was over. The level of the driver workload could now gradually drop back to a normal level (MA01, MA02).

Impact on driver workload of merging.
For comparison, the driver workload in eight merging areas without any MV is shown in Figure 6. In these merging areas, the driver workloads remained at a stable level, fluctuated less and kept within a normal range, exactly the same as the workload exhibited on flat straight segment of freeway. This confirms that MV has an impact on driver workload and causes mental stress.

Driver workload without any merging.
Modeling
According to the above analysis, driver workload was related to the volume of MV and TS. While the driver workload varies in real time, the maximum in the whole merging area can characterize the overall driver workload and so this was used for modeling, with the impact of the MV being maximized and all the workload being below this value. The traffic conditions can be characterized by the cross-sectional traffic volume (Sections 1 and 2 in Figure 3) when the driver passed through a merging area. Only 22 merging areas had clear videos from the management center that can be used for calculating traffic volume, and the volumes can be synchronized with the driver workload data. The maximum values for the driver workload (K) in different merging areas for different degrees of TS and the volume of MV were shown in Figure 7.

Scatter-plots for K-MV and K-TS: (a) Scatter plot for K-MV and (b) Scatter plot for K-TS.
The driver workload increased with an increase in the volume of MV and TS as shown in Figure 7. When the volume of MV was less than 564 pcu/h, the impact of the MV on the through-drivers was less and the driver workload remained at a safe level. Beyond this, the driver workload exceeded the threshold and the risk in the merging area increased. When the TS was below 0.485, the through-drivers could maneuver freely and the driver workload was at a safe level. Beyond this, the through-drivers felt nervous and were at risk of inappropriate actions.
According to the results of a Spearman correlation analysis, the correlation coefficient between K and MV was 0.8 and the correlation coefficient between K and TS was 0.85. P≈0, so K was significantly related to TS and DV, with a 95% degree of confidence. A further partial correlation analysis was performed. The partial correlation coefficient between K and MV was 0.80 when TS was controlled, and the partial correlation coefficient between K and TS was 0.79 when MV was controlled. Thus, TS and MV can be used to establish a model of driver workload K. The final regression model was shown in equation (2). The results of a variance analysis were shown in Table 4. R2 = 0.93; reduced χ2≈0; the residual sum of the squares = 0.00157; MV∈[150,800] and TS∈[0.1,0.7]

Analysis of the variance of K.

Discussion
Previous studies suggested that interchanges are a flat straight segment of freeway, with driver workload remaining at a safe level and no additional mental effort for driving tasks being necessary.15,17,29 This study suggests that the effect of MV on driver workload and the risk in merging areas cannot be ignored, even if there are better geometrical conditions at interchanges. The driver workload in merging areas varies as a function of the volume of MV and TS. When the MV or TS reaches a specific value, the driver workload will exceed safe levels.
The whole interchange segment has previously been considered as one unit for speed prediction, and the operating speed has been calculated as a constant value when evaluating the speed consistency for a basic freeway segment. 29 However, this study shows that the speed changes in merging areas under different traffic conditions, so the merging area can be considered as one specific segment. The model for the operating speed in merging area needs further study.
This study confirms that the traffic conditions in merging areas have an impact on driver workload. As the volume of MV and TS increases, the driver workload and driving risk also increase, which is in agreement with previous studies.3,4 This suggests that the risk in merging areas is dynamic, fluctuating with the traffic conditions. When the volume of MV is more than 564 pcu/h or the TS is above 0.485, the risk in merging areas is high and can potentially lead to crashes. The results indicate that it might be useful to have dynamic control of the traffic on ramps in merging areas, for instance, by using traffic lights.
The scenarios in this study were simplified and did not take into account the impact of horizontal curves and longitudinal slopes on driver workload, mainly because the geometric conditions at interchanges are better than those of other segments for the same design speed. However, the coupled effect of geometric and traffic conditions on driver workload at mountainous interchange is worthy of further study. Merging areas with a single acceleration lane were studied because this covers most merging configurations in China, but dual acceleration lanes need to be studied as well, because the higher volume of MV will almost certainly have a greater impact.
Conclusion
This study has shown that driver workload increases and may even exceed safety thresholds in the merging areas of interchanges, despite the geometric conditions of interchange being better. The impact of traffic conditions on the safety of merging areas cannot be ignored. The operating speed changes in merging areas under different traffic conditions, so the merging area can be considered as one specific unit for speed prediction when evaluating speed consistency on freeways.
The driver workload (K) increases with an increase in the traffic volume of MV and TS. When the traffic volume of MV is greater than 564 pcu/h or the TS is above 0.485, the driver workload can exceed safety levels, pushing up the degrees of risk and even leading to crashes.
A regression model was established to predict the driver workload when the traffic volume of on-ramp lane and through-lane has been determined. This can be used to evaluate the safety level of merging areas in terms of driver workload theory.
Footnotes
Declaration of conflicting interests
The author(s) declared no potential conflicts of interest with respect to the research, authorship, and/or publication of this article.
Funding
The author(s) disclosed receipt of the following financial support for the research, authorship, and/or publication of this article: This research was funded by National Key R&D Program of China (Grant No. 2018YFB1600302, 2018YFB1600300), and supported by National Natural Science Foundation of China (Grant No. 61531005) and by Transport Science and Technology Program of Shaanxi (Grant No. 2015-11K).