
Abstract
Urban public transport is a very essential mode for urban residents’ commute travel; however, the unbalanced spatial and temporal distribution of travel demand usually leads to passenger flow congestion risk at certain section and time. Meanwhile, the risk is short of quantified description. Based on the Pressure-State-Response framework, the study puts forward three bus passenger flow congestion risk evaluation indexes including the alternative pressure, the congestion intensity, and the transport efficiency. Then, the evaluation model is proposed based on the entropy method, and the risk is divided into four levels by K-means clustering. The article considers the 3rd Ring Road corridor in Beijing as a case to identify the risk level. The results show that the risk in the peak hours of weekdays is generally about 1.5 times higher than the risk in the weekends. The congestion risk is stable in level 3 during the majority time of morning peak hours. The duration intensity of level 4 risk is less than 0.1 during weekdays, indicating that the highest flow congestion can be quickly evacuated in a short time. The integrated passenger risk identification and evaluation model was proposed to identify the passenger flow risk level and induce the network flow distribution more reasonable. The study also provides technical support for ensuring the public transit system safety.
Keywords
Public transport plays an important role in the travel of urban residents, and the scale of public transport networks is increasing continuously. The travel demand has also increased, and bus passengers pay more attention to safety, convenience, and efficiency of the bus system. However, the bus service still faces some issues, including the high occupancy of bus vehicle and high density of bus stations during rush hours, the difference in levels of monitoring management, and the high frequency of traffic accidents. Meanwhile, the passenger flow increases sharply during holidays, large-scale events, and adverse weather conditions. The monitoring management of passenger flow congestion risk becomes particularly necessary.
Urban road traffic safety evaluation has been conducted in many previous research studies. Zhang 1 carried out deep research on the passenger behavior characteristics; the pedestrian movement simulation model was built to reveal the characteristics. Lan et al. 2 defined the concept of safety risk assessment for large passenger stations and analyzed the whole process of safety risk assessment.
In research on the safety evaluation of railway stations, Jiao et al. 3 built the risk evaluation index system of crowd agglomeration and stampedes based on the management of the railway station. Su et al. 4 built the evaluation system of railway safety based on the human, machine, environment, and management. Pang 5 built the risk control model of operation based on the risk management theories. Su et al. 4 proposed the operation safety management system and built a comprehensive and systematic public transport emergency mechanism. Lu and Han 6 set the passenger flow density, the rate of waiting time at the ticket entrance, and the passage efficiency as input indexes and built congestion warning function and a risk evaluation model.
Few studies focused on the bus passenger’s safety, and related studies paid more attention to the evaluation method of urban road traffic safety. In the latest 10 years, researchers devoted themselves to the methods of passenger traffic safety. Methods such as K-means clustering, accident tree analysis, neural network, and fuzzy mathematics were used to establish the evaluation model. The methods can evaluate different kinds of traffic safety. Hochberg et al. 7 used the risk index and confidence interval methods to analyze different types of risk source function; the methods can evaluate the risk qualitatively and quantitatively. The minimum Euclidean distance was first applied in comprehensive risk assessment. Korea proposed six risk assessment models, including risk identification, risk assessment, hazard definition, situation analysis, accident tree model, and event tree model.8,9 He 10 established an evaluation model of passenger traffic congestion in railway station with K-means clustering.
Previous research studies provide a good reference to study the bus passenger flow congestion risk. Meanwhile, the bus passenger flow congestion has the characteristics of randomness, transitivity, and diffusivity, which makes the work of prevention and disposal extremely hard. The article carries out research from the passenger transport network, then builds the evaluation index system, and gives the calculation method of the key indexes. Next, the evaluation model is built based on the entropy method, and the risk was divided into four levels by K-means clustering. Finally, the article takes the 3rd Ring Road corridor in Beijing as a case to identify the passenger flow risk level.
Evaluation indexes based on the Pressure-State-Response framework
Definition of passenger flow congestion risk
The article focuses on the risk of passenger flow congestion of the whole process on a micro level, and the process includes boarding and alighting in the bus system and during the operation. Combining the characteristics of the bus network and taking the station as a minimum unit, passenger flow congestion risk is defined as, in the process of bus service, the imbalance between supply and demand caused by normal or abnormal events, which leads to high density of passenger flow and low velocity in a certain range. “High density” means the flow beyond a certain service level, leading the flow to concentrate in the service space; therefore, the risk is rising. “Low velocity” means the actual operating speed is low, which contributes to the slow passenger evacuation, and finally, the risk is rising.
Evaluation index based on the Pressure-State-Response framework
The Pressure-State-Response (PSR) framework was first proposed by a Canadian statistician, Anthony feriend. It was first applied in the study of environmental indicators and received extensive support, giving many references for international organizations and academic institutions to carry out similar works. The model has strong adaptability, feasibility, and integrity to the evaluation of the risk category, which provides a good reference for the establishment of the evaluation index. The PSR framework applies to the evaluation of various issues and phenomena related to security. Furthermore, it can provide some effective reference for index classification. With strong integrity, the framework can pay attention to passenger flow congestion risk assessment during the whole process of bus operation (boarding and alighting, in the bus system, during the bus operation process).
Considering the medium- and long-term dynamic evaluation of risk and combining the characteristics in the whole process of transit mode, the article selects the indexes that conform to the PSR framework model. In the evaluation framework, pressure refers to the process of passenger flow increase or decrease in the public transport network, which affects the risk of the whole bus travel process. Alternative pressure of passenger flow is introduced to express it in the article. As is shown in Figure 1 state refers to the passenger flow loading capacity in the network, namely, the risk acceptance capacity, and the passenger congestion intensity can express it. Response refers to the risk taken by the public transport system and the response of risk evacuation; the article introduces the expression of the transport passenger flow efficiency index. The indexes can be defined as follows:

Evaluation indexes of the model.
Alternative pressure of passenger flow (P)
Alternative pressure of passenger flow (P) shows the congestion degree on boarding and alighting the bus, reflecting the pressure of passenger flow risk in the bus system. Alternating pressure is positively correlated with passenger congestion risk. Different types of buses have a different number of doors, in order to grasp the risk of passenger pressure in the process of boarding and alighting the bus accurately. The number of passengers who get on and off the bus will be divided equally by each door. The calculation is as follows

The index calculation is based on IC card data and basic bus station data. The passenger flow of boarding and alighting mainly depends on IC card data. The passenger flow of the channel and network is the sum of the passenger flow of all stations during the statistical period.
Passenger congestion intensity (I)
Passenger congestion intensity describes the risk pressure situation caused by passenger flow in the bus system, mainly used for the description of closed bus system status. It reflects the risk degree of the bus due to congestion. The degree of congestion becomes serious when I increases, and meanwhile, the risk of bus operation becomes intense. I is mainly affected by the quantity of passengers delivered and vehicles’ rated capacity. The formula is as follows

The calculation of


The total number of passengers of the first station interval is calculated first, and then, each station of each line is calculated one by one. The base table of all the stations is constructed in the end. The sample table of passenger congestion intensity is given in Table 1.
The sample table of passenger congestion intensity.

Transport efficiency of passenger flow (E)
Transport efficiency of passenger flow refers to the evacuated speed of each passenger facing the risk of congestion. Passengers on the bus have the same speed, so the delivering speed can represent the evacuated speed of passenger congestion risk. The operating time includes the stopping time on each station and the delay time on the crossroads.
The calculation is mainly based on GPS data and the static station data. The efficiency of each bus line in each station interval can be expressed as

E is the transport efficiency of passenger flow in one station, km/h;
Entropy method–based risk assessment
The risk evaluation model is built through the entropy method after establishment of the risk evaluation indexes. Meanwhile, passenger flow congestion risk is classified through K-means clustering with reference to the level of service and the risk source division standard. Congestion risk is divided into four levels through bus operation data in one week of 2016 in Beijing.
Risk assessment
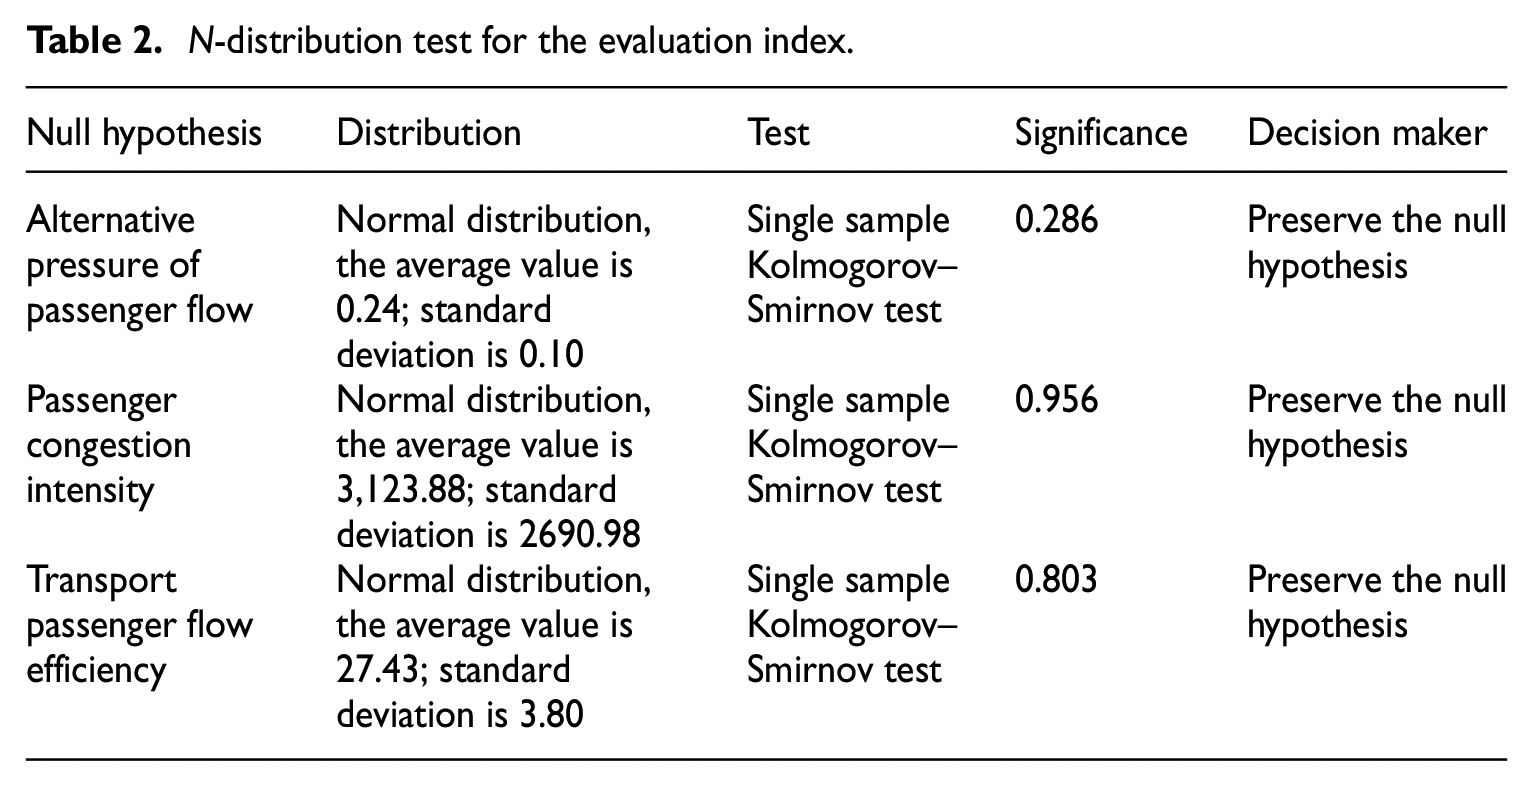
According to the normal distribution test in the Table 2 (significance level = 0.05), all indexes in the analysis period conform to the normal distribution, and the data quantity can meet the research requirements, so the data can support the construction of the bus passenger flow congestion risk evaluation model.
N-distribution test for the evaluation index.
Passenger flow congestion risk assessment needs to reflect the visual effects of a variety of static and dynamic indexes. However, the values of some indexes are too little to reflect, and the output results need to have the function of classification evaluation. Passenger flow congestion risk is basically linear with the value of each evaluation index. Meanwhile different spatial and temporal dimension should be considered. The risk assessment model based on the entropy method can quantify the weight of each evaluation index scientifically and reasonably, giving a quantitative digital evaluation and promoting the standardization evaluation gradually. The specific steps are as follows:
(1) The index values are determined according to the definition of indexes, and then dimensionless processing is adopted, transforming the values into a unified quantitative index in the range of [0, 1].
(2) The establishment of evaluation model
The essence of passenger flow congestion is the imbalance between supply and demand, namely, the demand is greater than the supply capacity in the transportation system.
Assuming that the research object is influenced by multiple dynamic evaluation indexes

The congestion risk of overall corridor and network is evaluated with the average risk of the station interval.
(3) Entropy weight of evaluation indicators
Suppose there are n evaluation indexes and m subtarget which affects the comprehensive evaluation value in the specified spatial evaluation dimensions (site, cross-section, the entire network, and so on) and temporal dimension (15 min, 1 h, and so on),

The model parameters are calibrated. In order to make the range of the risk index within 0–10,

where
Classification of risk
The level of service is divided into four levels on the basis of the traffic volume and is measured by traffic demand. The risk source is divided into four levels based on the size of accidents and took the risk level as intuitive characterization. Referring to the classification criteria above and the characteristics of urban passenger flow congestion risk, the public transit network passenger flow congestion risk level is divided into four levels based on the condition between supply and demand. K-means is used in it.
K-means clustering is used in the classification of risk. IC card data for buses of all station intervals in Beijing within 15-min granularity are used in the article. All different periods such as holidays, workdays, and weekends are included in the data. After calculation of passenger flow congestion risk, the article divides the risk level by using K-means. As is shown in Table 3, the clustering algorithm goes through four iterations. Finally, the article gets clustering center in the following:
Final cluster centroids.

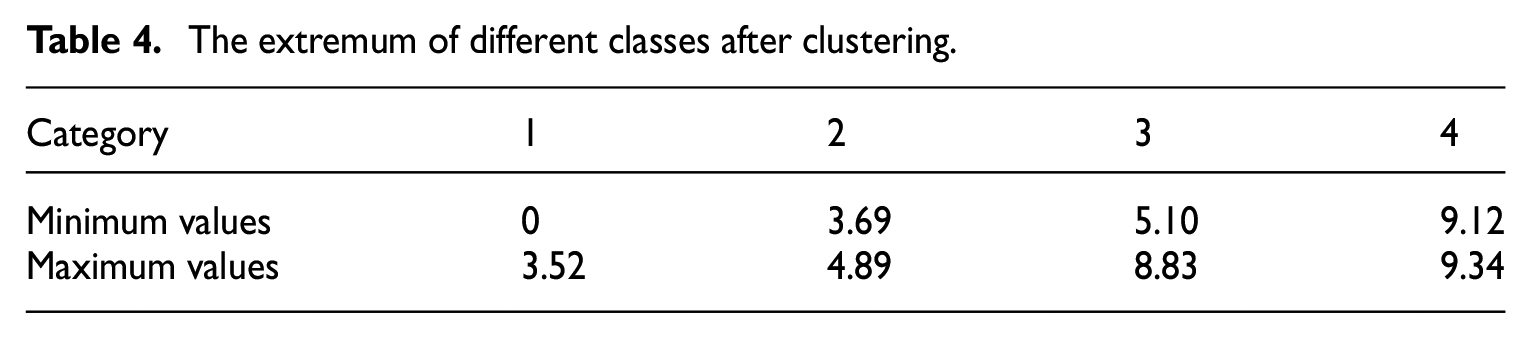
The maximum and minimum values of each category are obtained through the initial clustering, as shown in Table 4:
The extremum of different classes after clustering.
The number of cases of the levels 1 and 2 is large, accounting for about 2/3 of the data, while the data of level 4 risks are relatively small, less than 1/15. The number of cases in each cluster is shown in Table 5.
Number of cases in each cluster.

The clustering results can better distinguish the categories of clustering data. However, considering the amount of case of each category and the differentiation of the categories, the study finally divides the level of bus passenger flow congestion risk into four levels as follows: level 1 is under 3.5, level 2 is 3.5–5, level 3 is 5–9, and level 4 is more than 9. Table 6 shows the explanation of the risk level.
The explanation of the risk level.

Case study in Beijing
The article considers the corridor of 3rd Ring Road in Beijing as a case. The 3rd Ring Road corridor covers more than 200 various bus lines, including general lines, fast lines, special lines, express lines, commuter express buses, and multimodal transport buses. Transportation capability of all bus lines in this arterial corridor is almost 527,000, the highest number among the main public transport channels, which also sets up bus lanes, and the bus speed is lower than 24 km/h in the morning peak hour. The analysis depends on bus operational data of 3rd Ring Road from 1 May 2016 to 7 May 2016 (including four workdays, two holidays, and one weekend). The article analyzes passenger flow congestion risk of the whole channel and the four sections.
The characteristics of passenger flow congestion risk for the whole channel
The overall passenger flow congestion risk in different periods of time can be evaluated via the risk evaluation model, and then, the frequency characteristics and time duration characteristics were recognized.
Time characteristics
The passenger flow risk is calculated and classified by the model, as shown in Figure 2. The passenger flow risk of 3rd Ring Road presents double peak. The risk in the morning and evening peak hours of weekdays is generally higher, about 1.5 times higher than weekends. More time is at the tertiary level, and the highest risk is about 9.2 during morning peak hours, in the fourth level, which occurs from 8:00 a.m. to 9:00 a.m. At that time, the passenger flow demand is becoming saturated, it is hard to meet the demand, and the congestion is serious. The peak risk of evening is 5.9, which occurs between 6:00 p.m. and 7:00 p.m.

Characteristics of 3rd Ring Road traffic flow congestion risk.
Frequency characteristics
The frequency of level 4 risk in 3rd Ring Road of weekdays is 1.5%, the frequency of the level 3 risk is 29.4%, and level 3 and level 4 risk mainly occurs in the rush hour. In most cases (52.9%), the risk is level 1, and the bus system capacity can better meet the demand of passengers. During weekends and holidays, the risk level of passenger flow congestion risk is low, mainly concentrates on level 1.
Duration intensity
The time duration intensity indicates the time proportion of the risk level. The level more than 2 mainly occurs on weekdays during morning and evening peak hours. The Figure 3 calculates all levels of passenger flow congestion risk with 15 min as the minimum time unit. The duration intensity of the level 3 during weekdays is more than 0.4. It means that in the morning and evening peak hours, the passenger flow capacity of 3rd Ring Road corridor can meet the basic demand for a long time, and there is a greater probability that the passenger flow congestion will continue. As is shown in Table 7, the duration intensity of level 4 risk is less than 0.1, indicating that flow congestion can be quickly evacuated in the short time.

The congestion risk distribution of different types of time risk of 3rd Ring Road.
The duration intensity of different levels of risk for each day.

The characteristics of passenger flow congestion risk for the four sections
The probability of passenger flow congestion risk in the 3rd Ring Road during the workdays is high, and the peak hour characteristics are obvious, so the article selects the peak hours (6:00–10:00 and 17:00–21:00) of workday to analyze the section risk in the four directions (East 3rd Ring Road, West 3rd Ring Road, North 3rd Ring Road, and South 3rd Ring Road).
As can be seen from Figure 4, the average risks for the four section are North 3rd Ring Road (5.10), West 3rd Ring Road (5.00), South 3rd Ring Road (4.64), and East 3rd Ring Road (3.42), from high to low. The passenger flow congestion risk in the North 3rd Ring Road from 8:15 to 9:00 is the highest in the whole day. It has reached 9.32, while the duration is short. The passenger flow congestion risk of the West 3rd Ring Road is in level 3 for a long time, the frequency of the level 3 is 53.1%. At the same time, the duration intensity of level 3 is high (0.69 in the morning peak hour and 0.31 in the evening peak hour). The risk of the South 3rd Ring Road is high, and the highest value is 6.84. The risk of the East 3rd Ring Road in the morning peak hour is in level 2, and the risk in the evening peak hour varies from level 1 to level 3 and then down to level 1.

The distribution of each section risk of the 3rd Ring Road.
Conclusion
The intensity of temporary passenger flow in urban bus passenger network increases frequently, and the passenger flow congestion risk faces severe challenges during rush hours. The article conducts to improve the safety and emergency management.
The article puts forward a passenger flow congestion risk evaluation index system including alternative pressure of passenger flow (P), passenger congestion intensity (I), and transport efficiency of passenger flow (E) based on the Pressure-State-Response framework model, and then, the risk assessment model is built based on the entropy method. All these three indexes have a big influence on the congestion risk, especially the passenger congestion intensity.
The passenger flow congestion risk is divided into four levels based on the condition between supply and demand by using K-means and the entropy method.
The article takes the 3rd Ring Road corridor in Beijing as a case to identify the bus passenger flow congestion risk. The case study shows that the risk in the morning and evening peak hours of weekdays is generally higher, about 1.5 times higher than weekends. The duration intensity of level 4 risk is less than 0.1 during weekdays, indicating that the highest flow congestion can be quickly evacuated in the short time.
In future research, the risk of passenger flow congestion in different routes and different bus corridors can be further analyzed, and the impact of different factors on passenger transport risk can be studied.
Footnotes
Author’s Note
Dimitrios Alivanistos is currently associated with Beijing Municipal Transportation Operations Coordination Center,Beijing, P.R. China.
Declaration of conflicting interests
The author(s) declared no potential conflicts of interest with respect to the research, authorship, and/or publication of this article.
Funding
The author(s) disclosed receipt of the following financial support for the research, authorship, and/or publication of this article: This research is supported by the National Natural Science Foundation of China (NFSC) (No. 51578028), “Beijing Nova” Program by Beijing Municipal Science and Technology Commission (No. Z171100001117100), and the Ministry of Transport of the People’s Republic of China (No. 2015318221020). The authors would like to show great appreciation for the support.