
Abstract
Income inequality is a distributional phenomenon. This paper examines the impact of U.S. governor’s party allegiance (Republican vs Democrat) on ethnic wage gap. A descriptive analysis of the distribution of yearly earnings of Whites and Blacks reveals a divergence in their respective shapes over time suggesting that aggregate analysis may mask important heterogeneous effects. This motivates a granular estimation of the comparative causal effect of governors’ party affiliation on labor market outcomes. This paper uses a regression discontinuity design (RDD) based on marginal electoral victories and samples of quantiles groups by wage and hours worked. Overall, the distributional causal estimations show that the vast majority of subgroups of Black workers earnings are not affected by democrat governors’ policies, suggesting the possible existence of structural factors in the labor markets that contribute to create and keep a wage trap and/or hour worked trap for most of the subgroups of Black workers. Democrat governors increase the number of hours worked of Black workers at the highest quartiles of earnings. A bivariate quantiles groups analysis shows that democrats decrease the total hours worked for Black workers who have the largest number of hours worked and earn the least. Black workers earnings more and working fewer hours than half of the sample see their number of hours worked increase under a democrat governor.
Keywords
Introduction
Racial income inequality is a distributional phenomenon that is drawing growing concern on both sides of the political aisle in the U.S. In this paper, we address one question related to the extent to which party allegiance affects the labor market outcomes for Blacks relative to other demographic groups in the U.S. More specifically, we investigate the causal impact of the gubernatorial party allegiance (i.e., Democratic or Republican) of U.S. governors by scrutinizing its effects on subgroups of the population of Black workers in the United States. The effect of the governors’ party is assessed by decomposing the sample into different quantiles based on the level of earnings and number of hours worked— two important labor market outcomes that matter for wealth accumulation. The motivation for this decomposition is threefold: First, a descriptive analysis of the earnings distribution of Whites and Blacks in the U.S., over time, uncovers that the earnings distribution of Whites becomes bi-modal in the mid-nineteenths while that of Blacks stays uni-modal (see Figure 1). Given the difference in the shape of the two distributions, estimating the governor’s party affiliation effects for the average representative Black American may lead to impacts that are substantially different from the ones richer, or more disadvantaged individuals are experiencing. The difference in earnings distribution is consistent with the existence of a subtended increased in wage inequality in the 80’s and 90’s described by Autor et al. (2008). While the first motivation of this paper is driven by statistical concerns, the possibility of facing a highly heterogeneous causal effect when evaluating US states’ labor policies is highlighted by several other papers (see (Autor et al., 2008) and (Bayer & Charles, 2018)). Thus, the second motivation of this study stems from the growing literature showing that some policies have a different impact for individuals having higher income and those having lower income (Bayer & Charles, 2018). Third, in spite of valuable insights obtained by previous works on economic outcomes for Blacks in the United States (see for instance, (Lang & Kahn-Lang Spitzer, 2020), and (Gooden & Myers, 2019) for a review), little attention has been given to the distributional impacts of policy regimes on welfare within the Black community. Our work opens a new line of research by establishing the importance of examining the distributional impacts of policy regimes on Black welfare in the United States. Given the growing income distribution occurring in the United States and modern world economies, it is more important now than ever before to drill down on the distributional impacts of policy and regime changes on welfare within minority social groups in industrialized modern democracies.
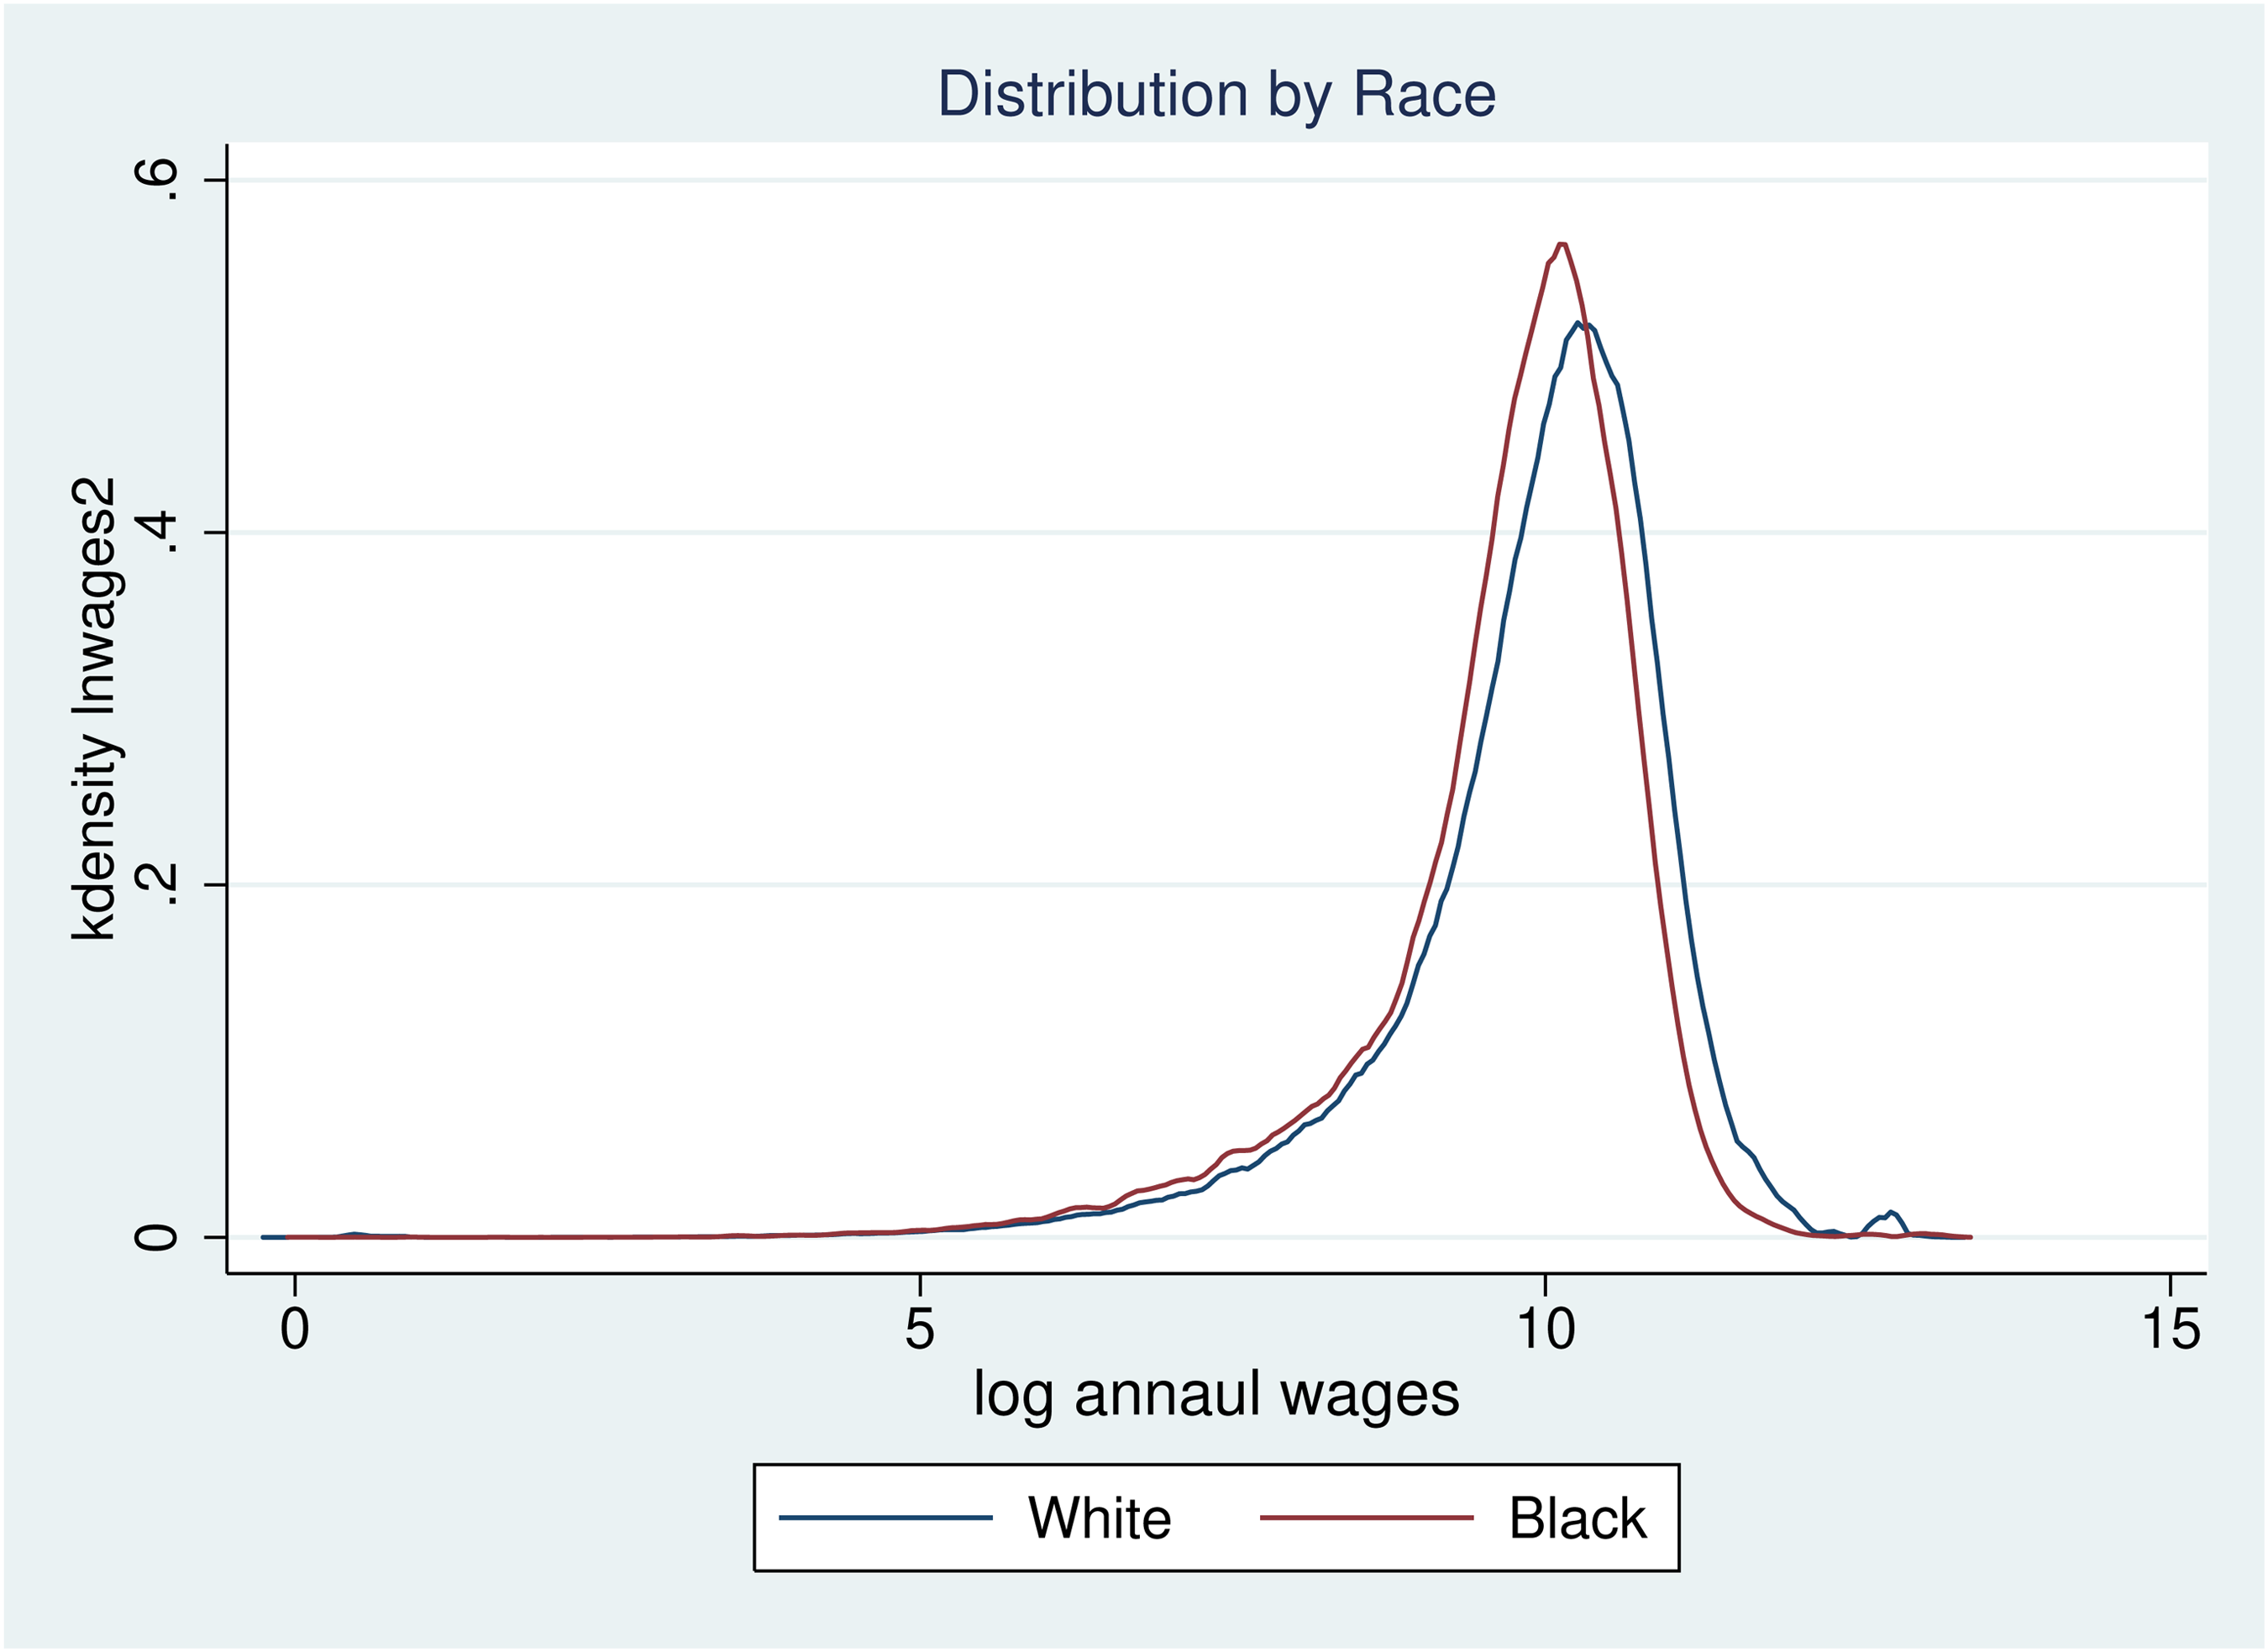
Distribution of Income by Race. Notes: This figure displays the distributions of the total annual earnings (in log) for Whites and Blacks workers. Data are obtained from the Current Population Survey between 1977 to 2008. The distribution of Whites earnings is bi-modal while this of Blacks is uni-modal. A Kolmogorov-Smirnov test, in Appendix, shows that both distributions are different and White workers are more likely to have larger earnings.
This paper brings new insights into the existing literature by showing that governor party allegiance plays different role for different subgroups of the population. Our analysis uses labor market outcomes, the total yearly earnings and number of hours worked, and creates quantiles subgroups along them.
We first document the growing, over-time, divergence in the distribution of annual wage of Blacks and Whites workers. This difference in the distribution is then tested using the non-parametric Kolmogorov-Smirnov test. The differences in the distributions of annual earnings (as shown in Figure 1) motivate our estimation method that combines a Regression Discontinuity Design (RDD) and decomposition of the sample by quantiles approach. We exploit marginal victories at the state gubernatorial elections to design an RDD and estimate the effects of the governor on Black’s labor market outcomes. We use subgroups granular analysis to unveil a large heterogeneity in the treatment effects.
In tables 1 and 2, the granular analysis of the causal effect of governors suggests that there is no difference between Republican and Democrat governors in most quantiles subgroups, especially for earnings. As for hours worked, Democrat governors increase the participation of Black workers at the highest earnings quantiles. Democrat governors decrease the total hours worked for Black workers who have the largest number of hours and earn the least while increasing the number of hours of Black workers earnings more and working fewer hours than half of the sample. We also find that in the U.S., independent of the party affiliation of the governor, certain subgroups of Black workers see no change in their labor market condition, suggesting the existence of a low-wage trap for lower-income quantiles individuals. The low-wage trap may be viewed as a situation where some Black workers who are already in low-paid jobs are not able to increase their income no matter which party is in charge of making gubernatorial policies. Our work is closely related to Beland (2015) who showed that party allegiance matters with Democratic governors causing an increase in the annual hours worked by Blacks relative to Whites. While insightful, the methodology used in that paper is silent on the heterogeneity distribution of the causal effect of party allegiance. The analysis is based on the first moments of the whole distribution of the Black population, namely the average value. Several studies have shown that the analysis based on the average value or the median of the whole distribution may be misleading when the shape of the distribution is not well-behaved (Banzhaf et al., 2019). For instance, in surveying studies that look at race differences in analyzing the effect of pollution, Banzhaf et al. (2019) conclude that the relationship estimated from aggregated data is only equal to the relationship at the micro-level if there are no group-level effects correlated with the variable of interest. Therefore, it is increasingly suggested to go beyond the aggregate average indicator analysis to a heterogeneous approach that explores finer sub-groups when analyzing race inequality and labor market issues. For instance, Manduca (2018) showed that the observed stable ratio between median Black and median White family incomes conceals two large and diametrically opposed trends between 1968 to 2016. Along the same lines, the work by Bayer & Charles (2018) discusses why the median Black man’s relative position in the earnings distribution has remained constant in the overall distribution over the past 70 years. They go beyond the standard mean or median to use the concept of rank earnings gap that provides a finer picture of heterogeneity issues in several subgroups of the income distribution.
Causal effect of governor Party Affiliation on Number of Hours worked by Blacks.
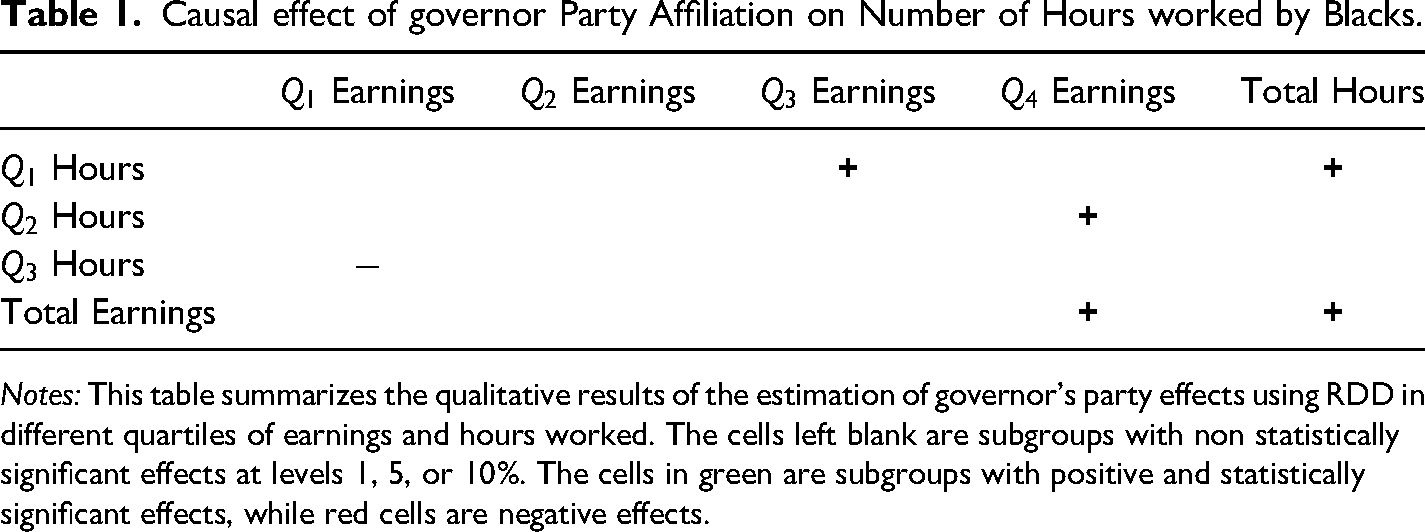
Notes: This table summarizes the qualitative results of the estimation of governor’s party effects using RDD in different quartiles of earnings and hours worked. The cells left blank are subgroups with non statistically significant effects at levels 1, 5, or 10%. The cells in green are subgroups with positive and statistically significant effects, while red cells are negative effects.
Causal effect of governor Party Affiliation on Blacks’ Earnings.
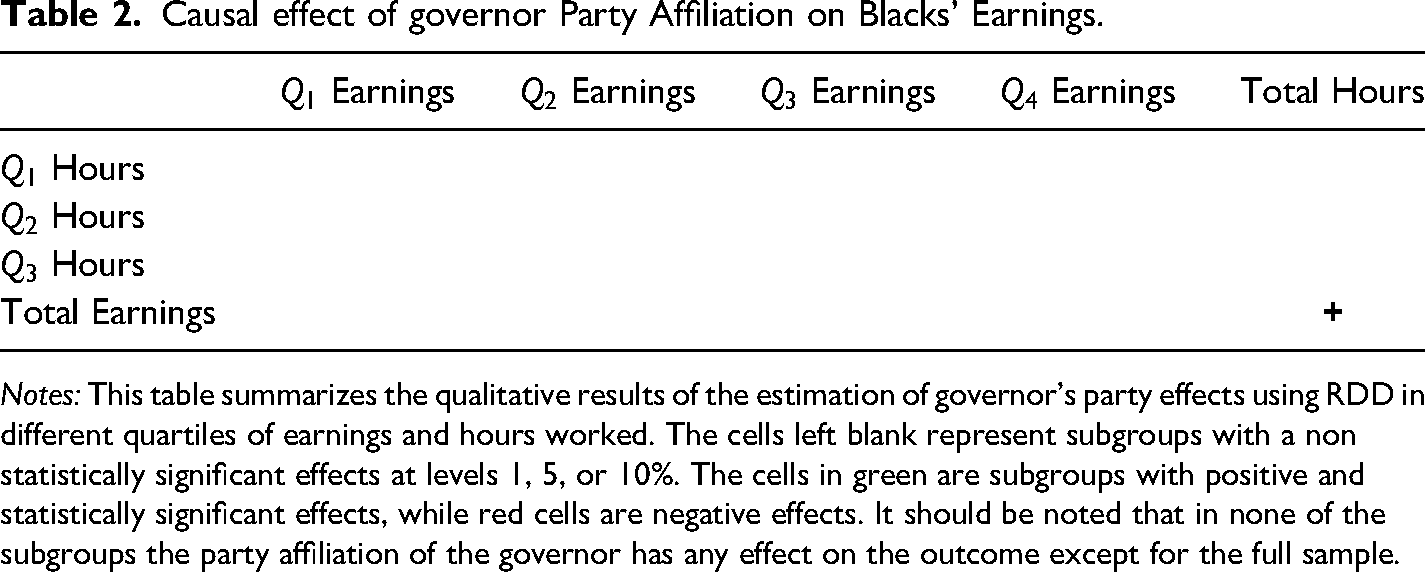
Notes: This table summarizes the qualitative results of the estimation of governor’s party effects using RDD in different quartiles of earnings and hours worked. The cells left blank represent subgroups with a non statistically significant effects at levels 1, 5, or 10%. The cells in green are subgroups with positive and statistically significant effects, while red cells are negative effects. It should be noted that in none of the subgroups the party affiliation of the governor has any effect on the outcome except for the full sample.
As mentioned earlier, empirically assessing the extent to which subgroups considerations influence causal inference can increase our understanding of the link between global average effects and more micro effects. The average effects may not be a meaningful statistic. Such a situation can happen, if the application of the analysis to a subgroup of the effects does not lead to the same conclusion as the average effects on the whole population (Bertanha, 2020). One important motivation to scrutinize, and to go beyond macro aggregate estimation to less aggregate analysis is the increasing public demand for more robust approaches to the evaluation of public policy programs directed toward specific subgroups of the population (Heckman, 2001; Darity et al., 2021). There is a small but growing strand of literature looking at these issues in using Regression discontinuity design approaches. For instance, Frandsen et al. (2012) use quantile treatment effects in the regression discontinuity designs design for studying the distributional effects of a children’s education program. Their data exhibits regular distributions, excluding the possibility of dealing with isolated masses in the analysis, unlike our income and hours worked data. Along the same lines, Huang & Zhan (2020) provide a methodology for performing causal inferences that combine both a local quantile regression analysis and a regression discontinuity design.
The remainder of this paper unfolds as follows: Section 2 describes some background by explaining the crucial role of the governor in shaping the U.S. labor market. Section 3 presents some descriptive statistics of the data, while Section 4 presents the methodology used in this paper. Section 5 discusses the results obtained from the causal inference and Section 6 concludes our analysis.
The role of U.S. governors in the shaping of states’ labor markets
The U.S. political system grants governors with a high degree of power over the management of the rules that shape the states’ economies, including labor market conditions. The governor heads the executive branch in each state, sets policies, prepares and administers a budget, recommends legislation, signs laws, and appoints department heads. Governors can veto state bills. Unlike U.S. presidents, many governors also have additional veto powers at their disposal. For instance, most states provide governors the power of the line-item veto, which gives governors the ability to strike out a line or individual portions of a bill while letting the remainder pass into law. However, party composition at the state legislature has consequences on how governors will implement their own policy agendas. In contrast, when the governor is not from the same party as the one controlling the state, she/he may have to work harder to build relationships and to reach a consensus. In the situation known as unified government where the governor’s party affiliation controls the legislature, governors are hamstrung in their ability to implement their policy choices. Under the leadership of the governors, states can set taxes, manage budgets, and regulate businesses. They can also enforce worker protections by regulating issues related to minimum wage, overtime pay coverage, anti-discrimination protections, workers’ compensation, unemployment insurance, paid sick leave, and paid family leave. Other state activities that are important in shaping the labor market include managing the healthcare system, funding the public sector retirement plans, increasing access to affordable home care, and providing childcare services. The way these policies are implemented is of particular importance for people working in low-paid jobs including janitorial, delivery, home care, agriculture, landscaping, security, hospitality, trucking, transportation, and warehousing. The substantial role governors play suggests that their gubernatorial party affiliation could have a pivotal role in shaping the labor market outcomes.
Data and Descriptive Analysis
Data
The data used in this paper are obtained by matching gubernatorial elections and the data from the Current Population Survey (CPS)'s March supplements from 1977 to 2008. The gubernatorial elections have two sources: the Atlas of U.S. Presidential Elections (2011) for election between 1990 and 2010 and the ICPSR 7757 (1995) for older elections. Only elections won by a contestant who is Republican or Democrat are kept in or data. The individual characteristics are obtained from the CPS. To estimate all the model specifications, we use the same sample as Beland (2015) to allow comparison of our heterogeneous effects with the aggregate effects estimated in his paper.
Comparing Income Distribution by Ethnicity
The large majority of work on the racial difference in labor outcomes has focused on mean or median differences (Bayer & Charles,2018; Chetty et al.,2020). By focusing on measures of central tendency, there is a possibility that the measure of the effect does not fully capture the reality in the context of U.S. racial wealth inequality.
In a recent paper, Bayer & Charles (2018) have identified a number of economic reasons to be interested in the full distribution of income when analyzing the racial wage gap: the recent disproportionate increase in non-work among U.S. Black men, 1 and recent evidence suggesting that economic changes such as raising general inequality differently affected Black outcomes at different points in the distribution. For similar reasons, our analysis will take a holistic approach by examining the causal effect at all parts of the distribution.
The analysis of Figures 1 and 2 as well as Figures 5 to 9 [in Appendix A] produces statistical evidence supporting fundamental difference (beyond mean or median) in the income distribution by race. Each figure represents the distribution of the of individual annual earnings (in log) by ethnicity.
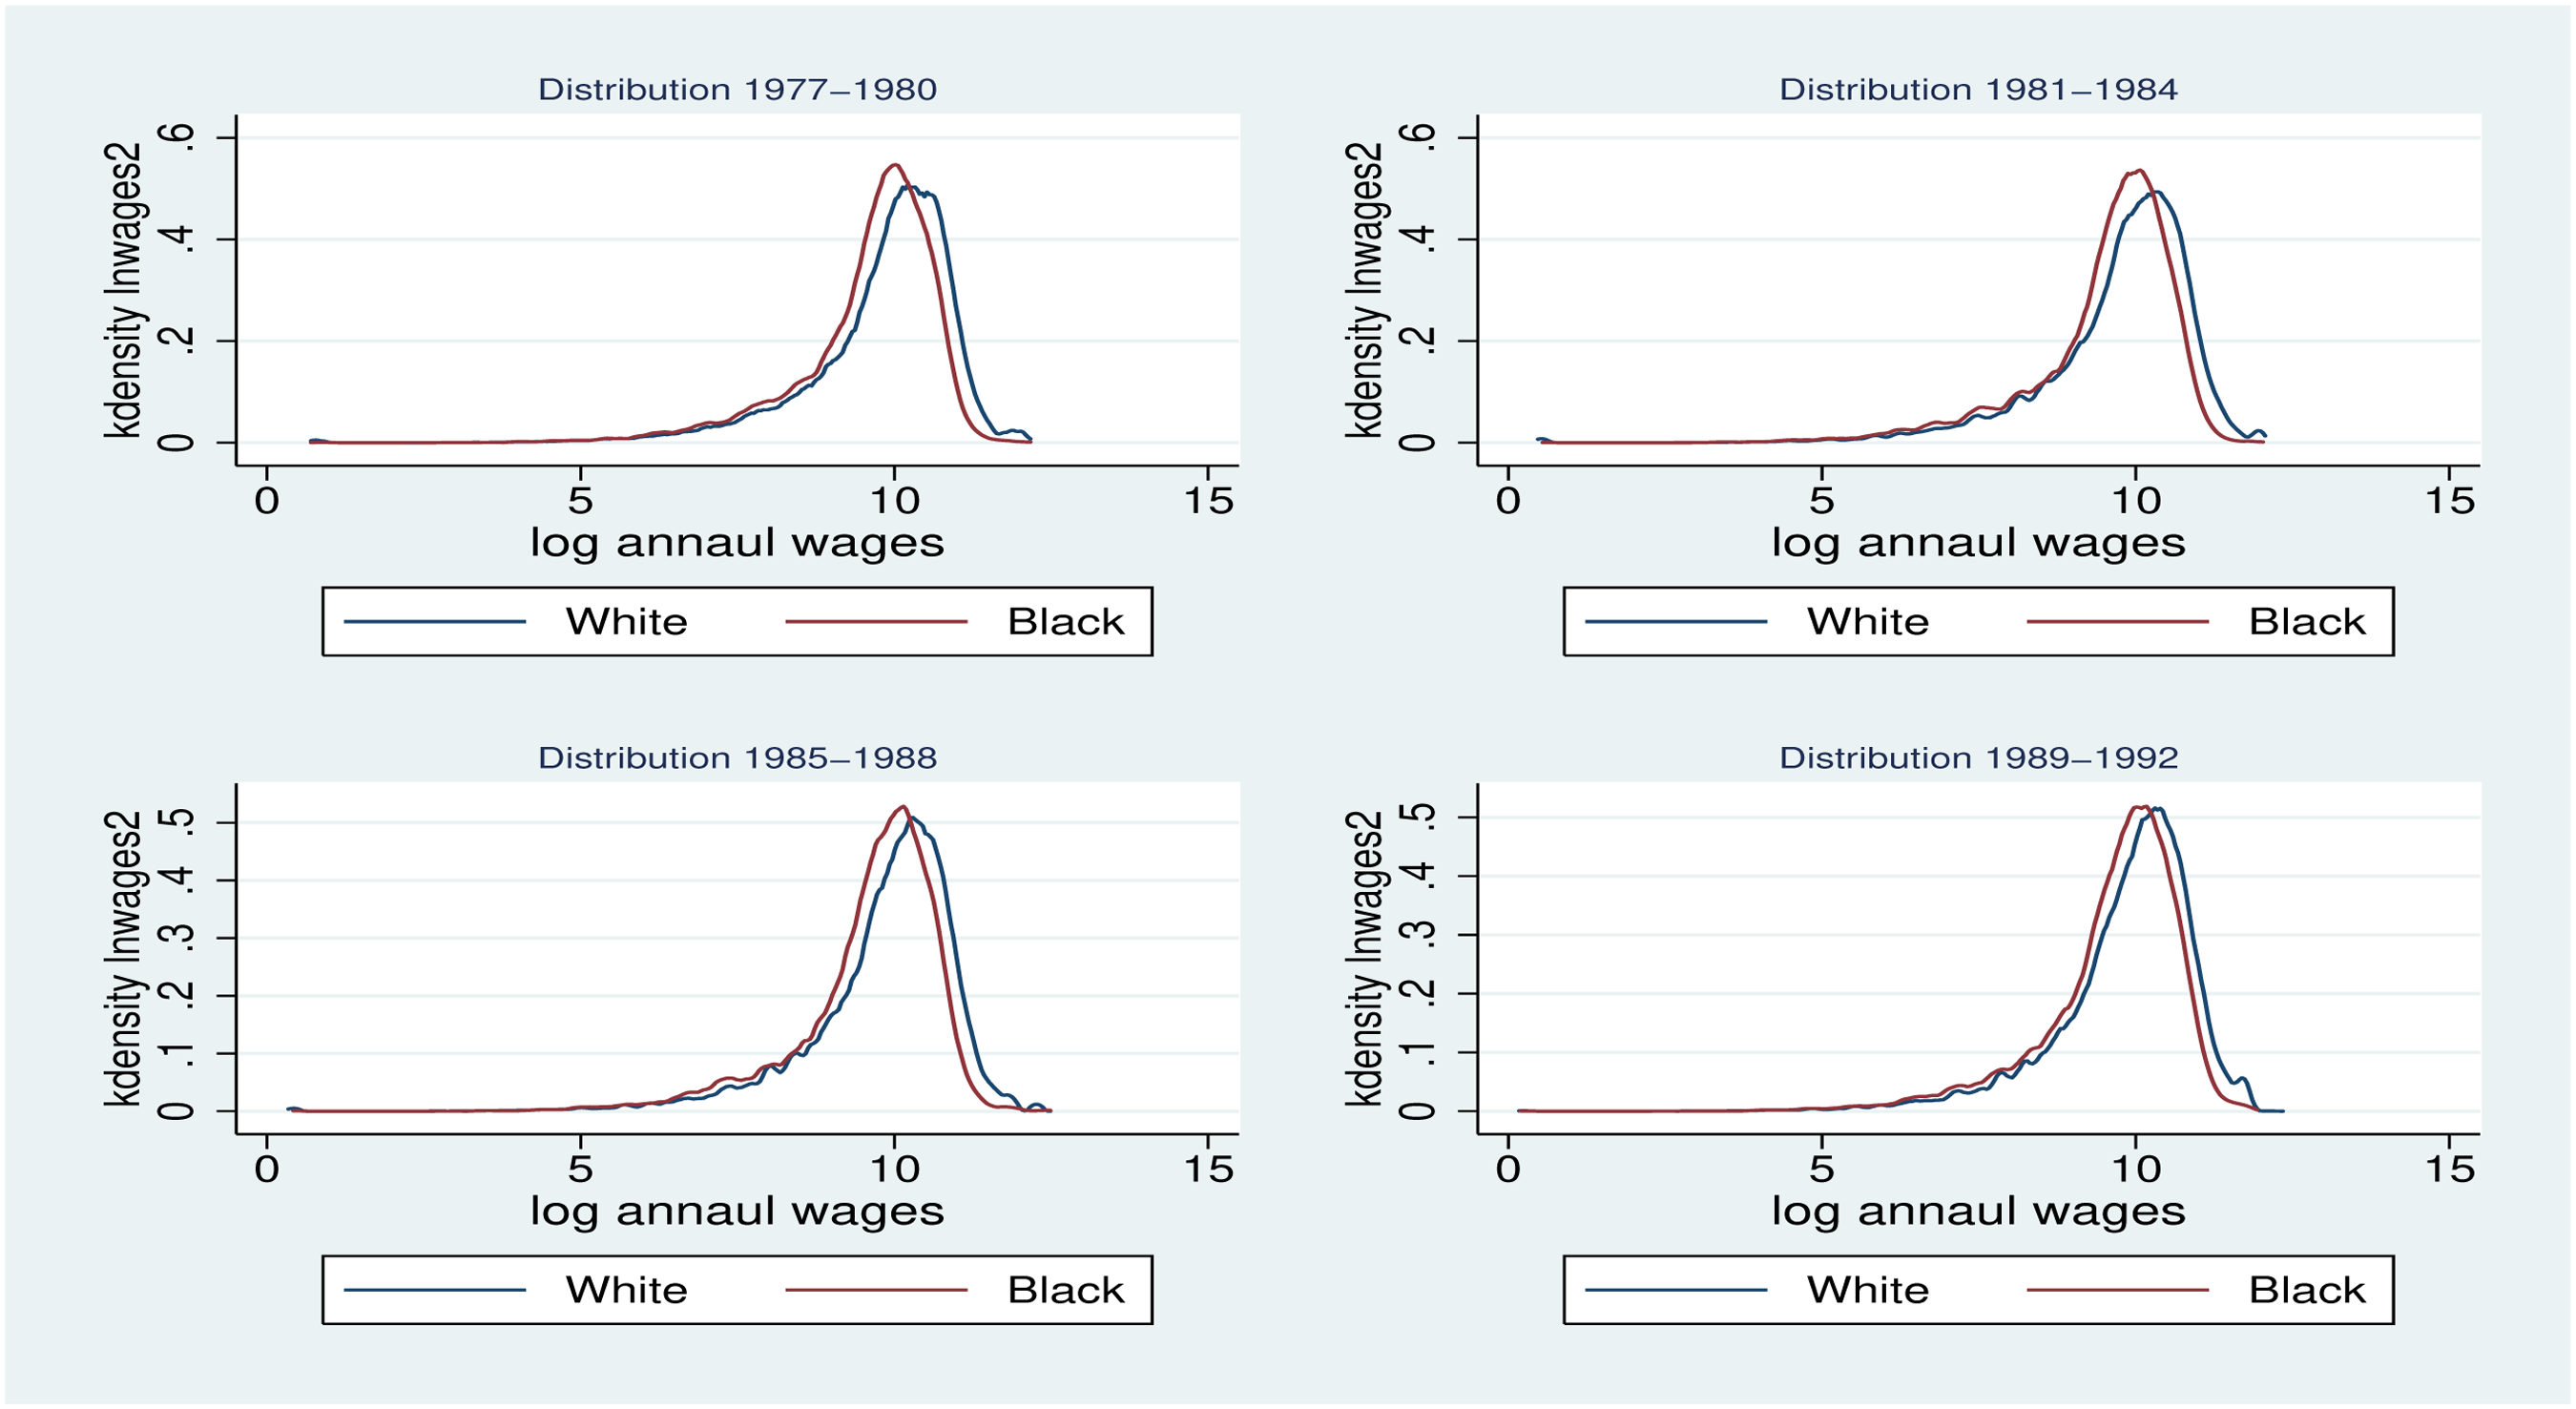
Distribution of Income by Race 4-year split 1977–1992. Notes: This figure shows the changes in the distributions of the total annual earnings (in log) for Whites and Blacks workers from the Current Population Survey between 1977 and 1992. Each panel shows a four years sub-period. The distributions of White and Black workers are all uni-modal. However, a Kolmogorov-Smirnov test shows that both distributions are different.
Figure 1 shows that the income distribution of Whites is bi-modal while that of Blacks is uni-modal. A Kolmogorov-Smirnov test for difference in the distribution confirms that both distributions are different with the White workersdistribution more likely to have larger values. 2
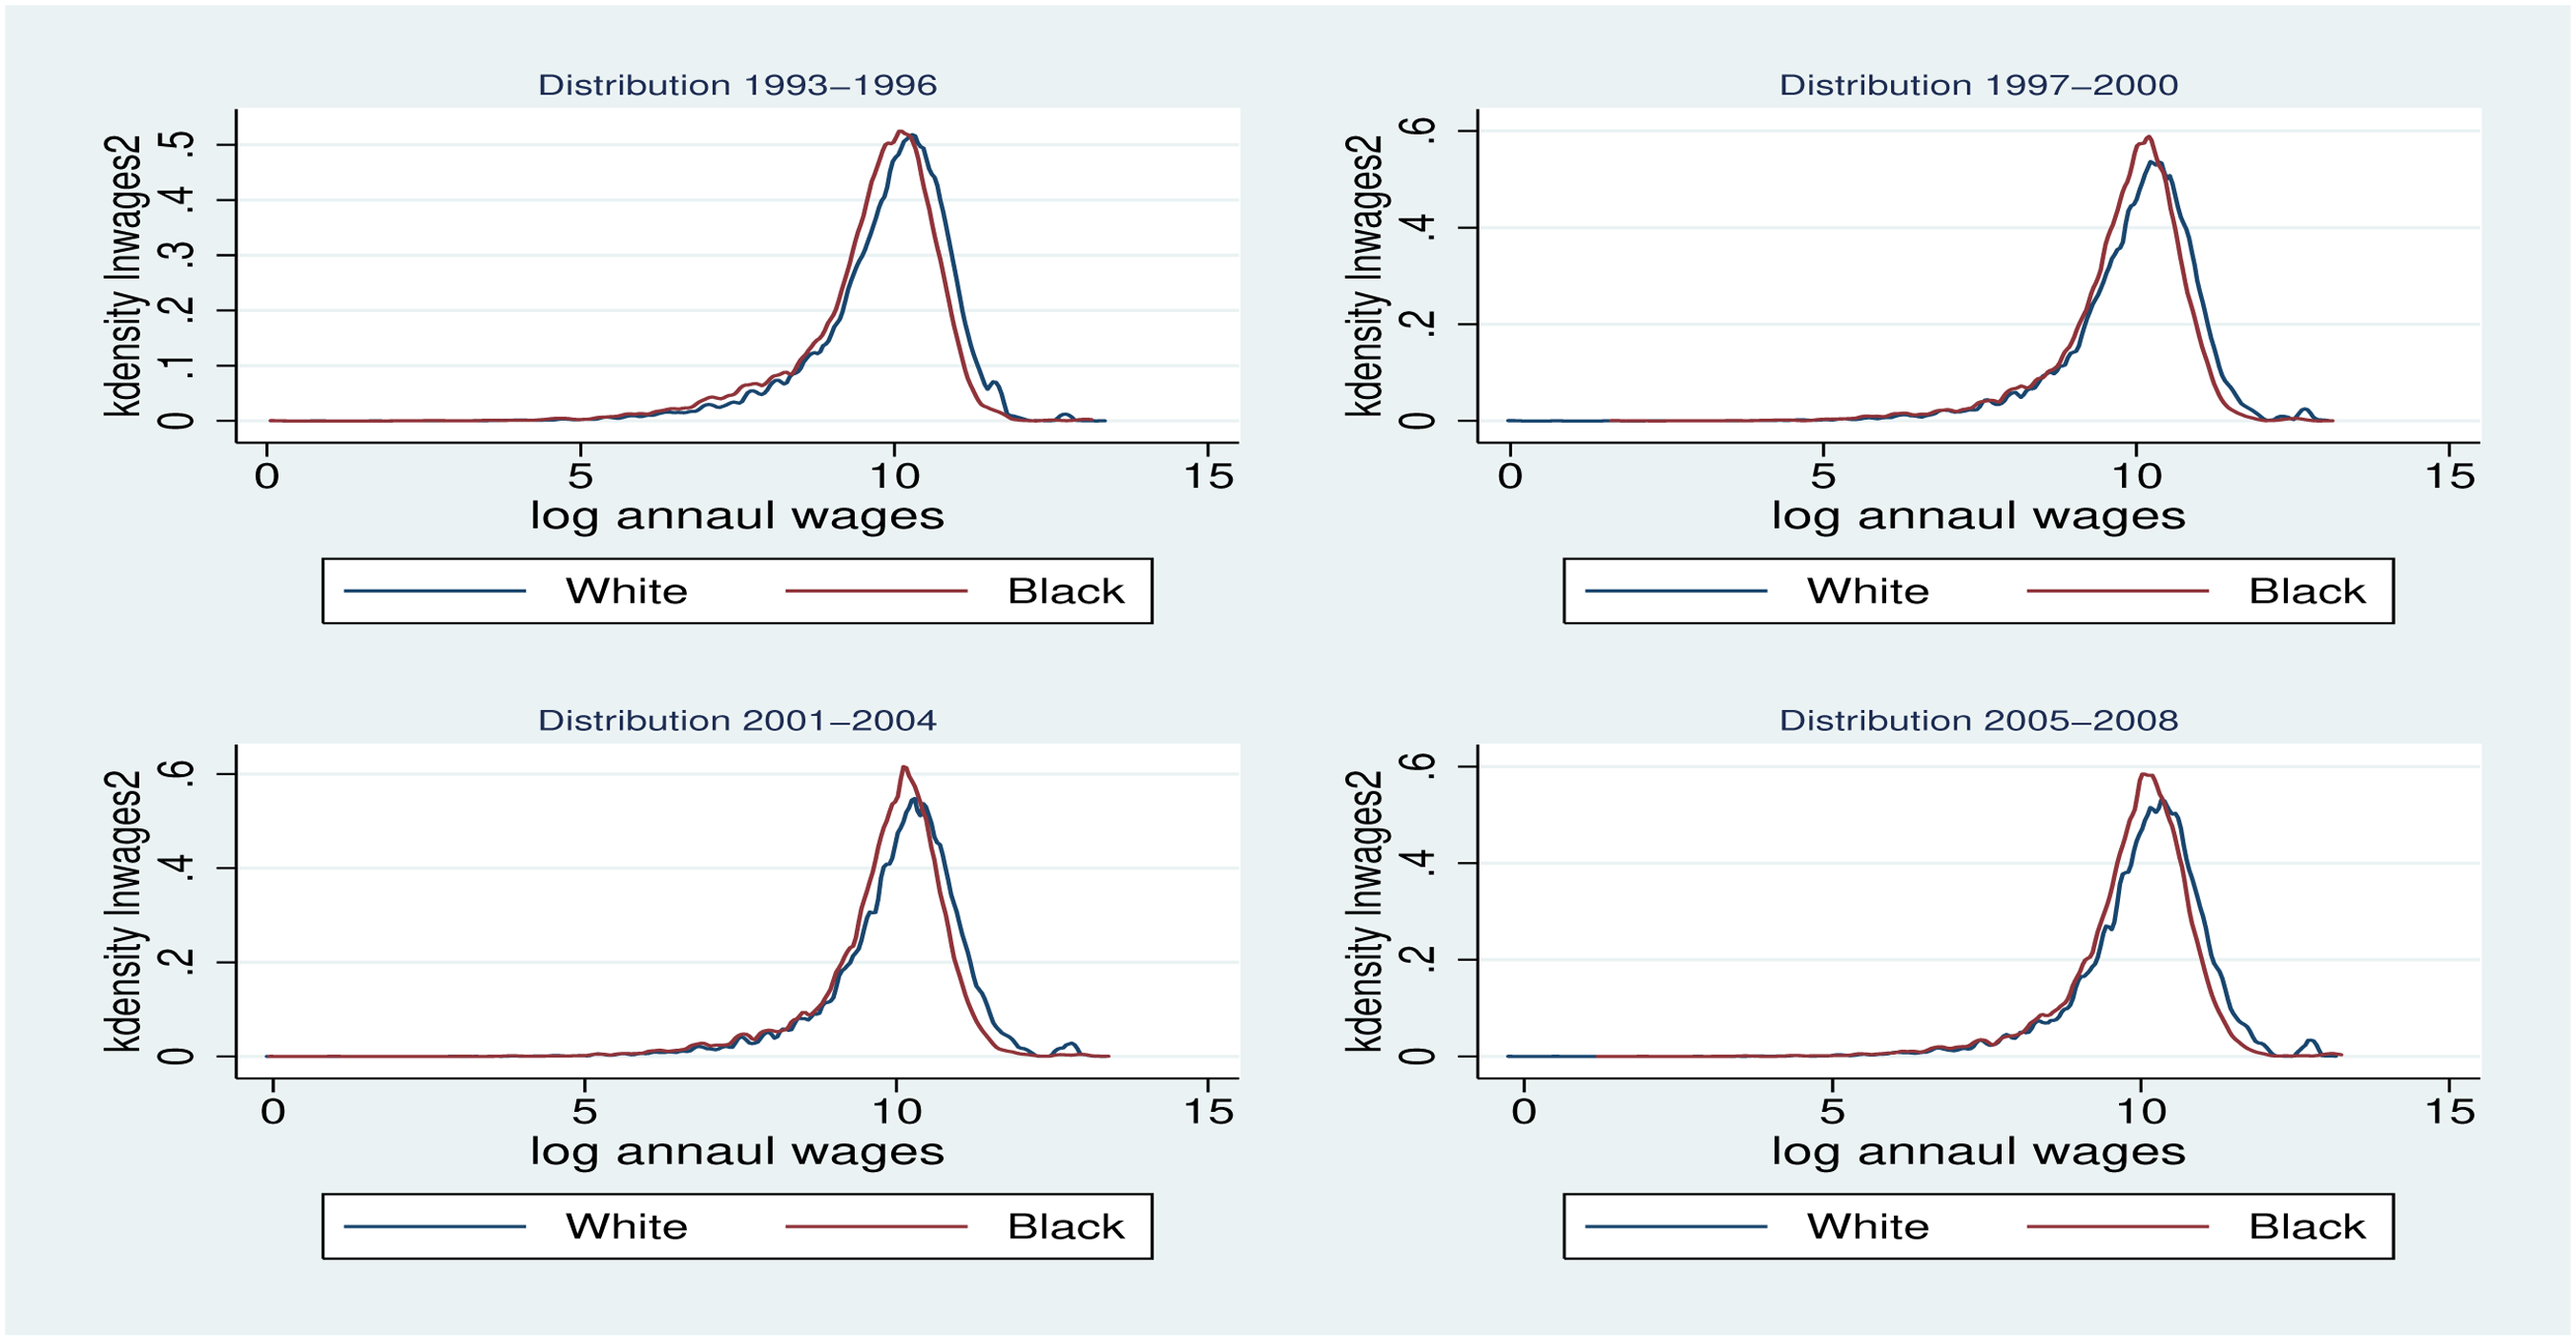
Distribution of Income by Race 4-year split 1993–2008. Notes: This figure displays the changes in distributions of the total annual earnings (in log) for Whites and Blacks workers from the Current Population Survey between 1993 and 2008. Each panel shows a four years sub-period. The shapes of the distribution of White and Black workers’ earnings diverge over time. The difference is the shape of the distributions seems to be a recent phenomenon.
Figures 2 and 3 present the dynamic of the distributions over time. While from 1977 to 1992 the distribution of Whites income dominates that of Blacks, it is only from 1993 that the shapes of the distribution start to diverge. As we move from 1993 to 2008, the Whites’ income distribution becomes more bi-modal. This would imply the level of income inequality is becoming more pronounced among Whites than among Blacks. 3 Figures 3 to 5 [ in Appendix A] suggest that the observed divergence in income distribution by ethnicity is present irrespective of the party allegiance of the ruling state’s governor.
We propose a holistic approach to the causal analysis of political parties on the labor market outcomes in the U.S using a quantile groups RDD design. Our approach is motivated by the substantial differences in the distribution of earnings and the existing evidence of differential effects of policies depending on the position of a Black worker in the earnings distribution.
Evidence of Discontinuity by Quantiles Subgroups
We use the US gubernatorial electoral rules to design a regression discontinuity approach. The electoral margin is the discontinuity of interest. We assume that in highly contested elections, a marginal victory suggests that both candidate are very similar in unobserved (by the econometrician) characteristics. Based on this assumption, the observed difference in the outcome of Black and White workers under the ruling of a democrat governor who has marginally won an election can be attributed to the governor’s party allegiance. Indeed, the “small margins” of victory are assumed to exogenously change the ruling governor’s party allegiances. The use of this electoral margins to design RDD has become very popular in economics (see Lee (2001), Lee & Lemieux (2010), and Beland (2015) for some examples). The application of the RDD methodology for each quantile implies that we need to investigate the presence of discontinuity at 0 percent electoral margin for each income quantiles subgroup. The Figure 4, and Figures 10, and 11 [in Appendix A] have four panels, each of them representing a quantile of annual income. Each panel shows the discontinuity at 0 percent electoral margin, this represents a Democratic governor barely marginal win over a Republican.
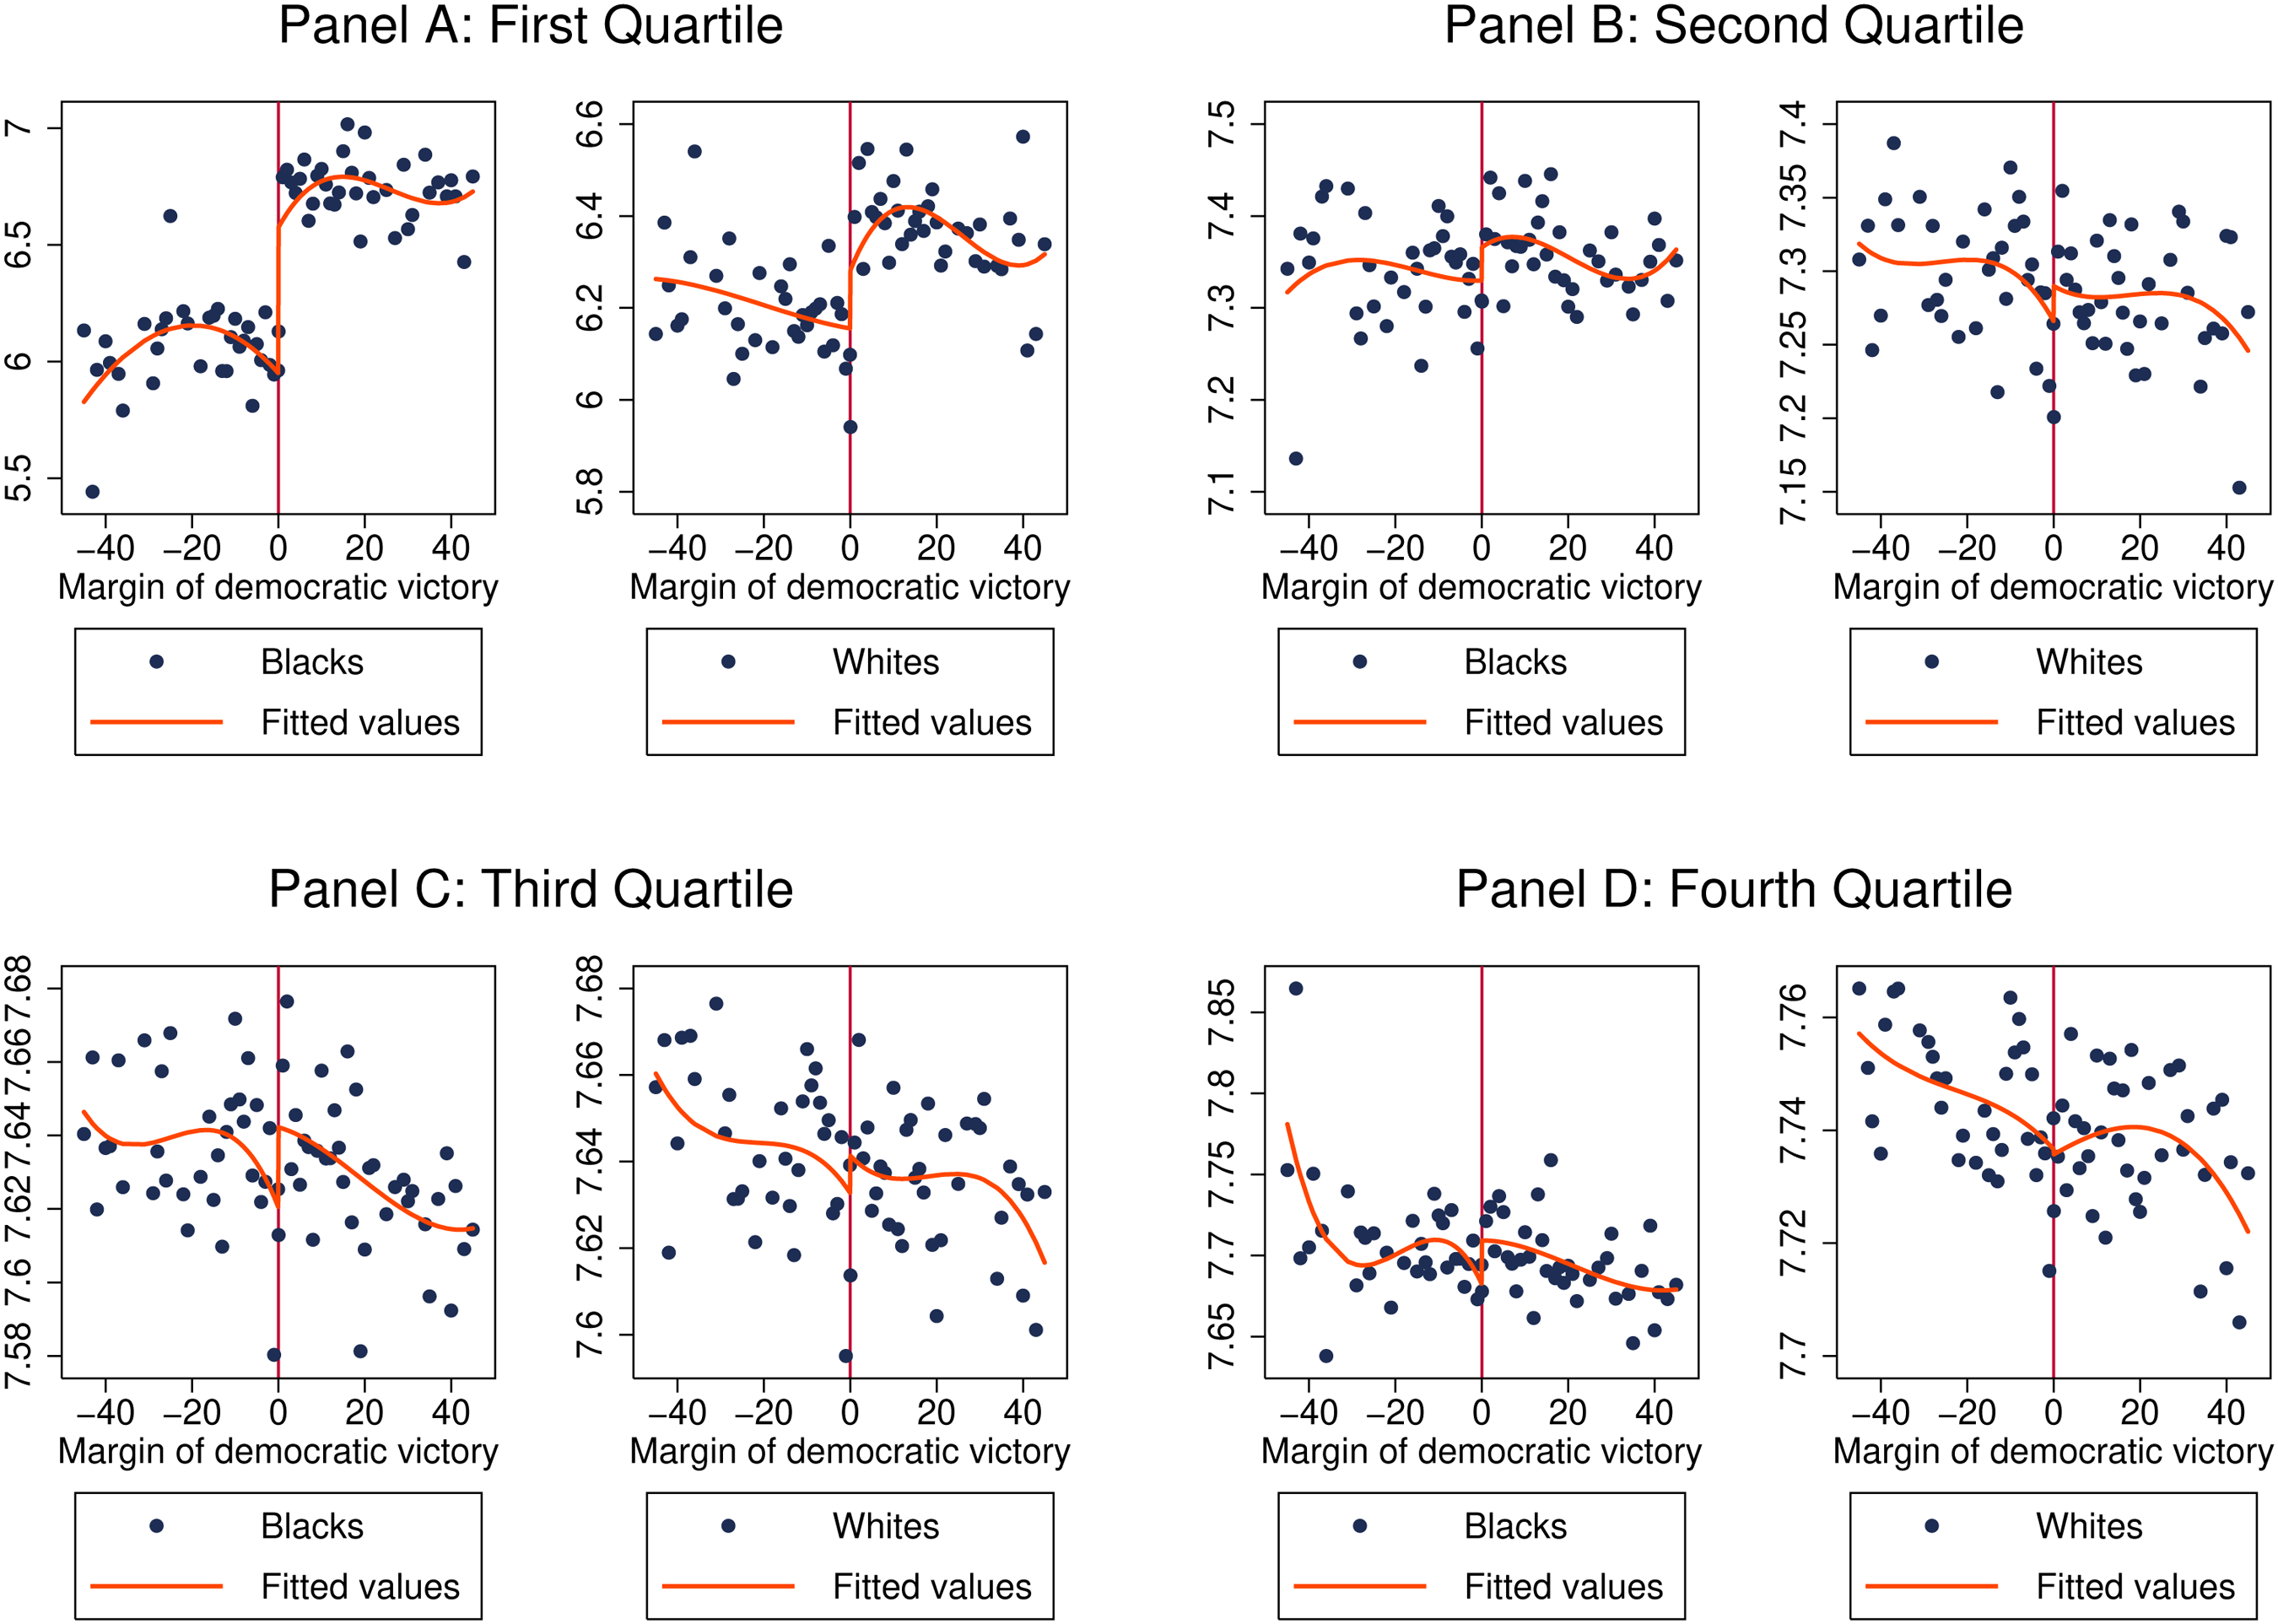
Margin of Democratic Victory and Total Hours Worked per Year for Black (left on each panel) and White (right on each panel). The analysis is by Earnings quartile.
Figure 4 represents the hours worked by White and Black workers. Figure 10 and 11 in Appendix A represent respectively the proportion of employed and the natural logarithm of earnings of Whites and Blacks.
Figure 4 suggests a positive effect of having a Democrat governor on the number of hours worked by workers. The effect seems to be concentrated at the lowest quartile. While the effect looks stronger for Blacks it also exists for Whites in the first quartile. The heterogeneity in the evidence of the presence of discontinuity at the cut-off supports the need for an in-depth analysis of the effect of political parties.
Other labor market outcomes of interest are the probability of employment represented in Figure 10 and the the annual total earnings shown in Figure 11. The analysis of Figures 10 and 11 suggests that a Democrat victory has a positive effect on the probability of work and earnings when workers in the first and second quartiles of earnings are considered. The effects are larger for Black workers and virtually no effect for White workers. Moreover, as we move to higher quartiles, electing a Democrat governor does not affect the extensive margin of working irrespective of the race.
The results suggest a certain level of heterogeneity in the effect of governors’ party allegiance on labor market outcomes. Workers with earnings in the lower quartiles (first and second) seem the most affected by the marginal election of a democrat vs a republican governor. It is worth noting the fitted values obtained in Figures 4 and 10 and 11 [in Appendix A] are estimated without controlling for any covariates. The next section extends this analysis by introducing additional controls for better precision and by dividing the sample into quartiles along two dimensions (annual income and hours worked). Furthermore, the analysis sheds light on the extend of the heterogeneity of the governors’ party affiliation effects on labor market outcomes.
Methodology for The Causal Estimation
The effects of interest (effects of governor’s party allegiance on Blacks vs Whites labour market outcomes) are identified by the application of the regression discontinuity design (RDD) to different sub-groups in the sample. The use of an RDD helps to account for potential endogeneity of the victory of a specific party’s governor (see Lee (2001); Lee & Lemieux (2010)). The assumption used for identification is that in case of marginal victory, conditional on some observable factors, there are no other unobservables factors driving both the outcome of interest and the victory of a governor of a specific political party.
The descriptive analysis of earnings of Black and White workers summarized in Figures 1, 2, and 3 suggests that the earnings distribution of White workers is bi-modal while that of Black workers is uni-model. The nature of the difference in the distribution makes the relevance of the average treatment effect as the parameter of interest questionable. Especially in a situation where the treatment effect has a very high likelihood of being heterogeneous. This implies that the estimation of the conditional expectation of the difference estimators could be biased because of the non-symmetry of the treatment effects distribution. Indeed, the RDD creates a quasi-experiment around the cut-off of marginal victories, but the difference in the distribution of earnings could lead to an asymmetric distribution of treatment effects, which poses threats to significance testing as noted Deaton & Cartwright (2018) for randomized control trials (RCT). 4 To alleviate the consequence of potential biases in the estimates of the governors’ effects using the full sample, we propose an estimation of the treatment effect on subgroups along earnings and total hours-worked quantiles. For each quantile subgroup, the average treatment effects of the governor’s party affiliation on the labor market outcome is computed. If the estimated average treatment effects for the population masked some important heterogeneity, the strategy proposed in this paper is to estimate the effects at the level of quantiles subgroup to unveil these heterogeneity. The analysis of the heterogeneous effects of policy has recently been studied in the literature using quantile regression for RDD, as in Frandsen et al. (2012), or unconditional quantile regression (Firpo et al. (2009)). Borah & Basu (2013) present an application of conditional and unconditional quantile that leads to different results. Darity et al. (2021) also use the unconditional quantile regression to analyse the heterogeneous causal effect of race on labor market outcomes. It is important to note both methods are based on continuous distributions. The presence of masses probabilities on the distribution of earnings and total hours worked prevents the used quantile regression for RDD as in Frandsen et al. (2012) (which would have been our preferred estimation method), or unconditional quantile as in Darity et al. (2021). 5 Thus, we have formed four quantiles subgroups based on total annual earnings, three quantiles subgroups based on total annual hours worked, and twelve subgroups by crossing quantiles hours worked and annual earnings.
For each quantile sub-group, the following model is estimated
For the model represented in Equation (1), the parameters are estimated on the sample of “small” victory margins. The estimation of the parameters of Equation (1) for each quantile subgroup will deliver a consistent estimator under the assumption that the distributions of the labor market outcomes are similar in shape for the subgroups.
Discussion of Empirical Findings
Estimation Results
Tables 5 to 10 in Appendix B show the results of the estimation of the causal effects of governors party affiliation decomposed in quantiles sub groups along two dimensions: earnings and hours worked. Table 5 shows that when democrat governors’ policies are implemented, only Black people in the high-earnings quantiles increase their average number of hours worked. However, Blacks in the lower-earnings quantiles do not increase the average number of hours worked. The stagnation of the average number of hours worked in the lower-earnings quantiles may be viewed as “an hour trap”, suggesting that incentives for Blacks to work more hours are not boosted by Democrat policies in a complex economic and social environment which is shaped by the welfare system, the childcare, and the Medicare. There are several ways for understanding this finding. One possible interpretation is that all Blacks in that earnings quantiles do not increase at all their hours worked when Democrat policies are implemented. Another interpretation is that even if we assume some Blacks in low earnings quantiles increase the number of hours worked, this would be counterbalanced by other Blacks in the same lower earnings group that reduces the amount of time they used to work. The combined effect of these two forces can contribute to keeping the number of hours worked unchanged in the low earnings quantiles. In that sense, the effects of the policies may not be effective in increasing the number of hours worked for Black workers in the lower earnings quantiles. If a low-income Black is already working too much to pay his/her bills, a government policy that increases childcare or paid sick leave may give incentive to that person to reduce his/her hours of works and enjoy more leisure time to have a more balanced life. In addition, the combination of income taxation combined with restrictions for people in the welfare system may also contribute to reduce work incentives and hold back hours worked for Blacks. There is literature that discusses how work fatigue accumulates over time as a consequence of work effort and can lead workers to reduce the number of hours worked (Donsimoni, 2020; Cygan-Rehm & Wunder, 2018). In the same way health issues may create an incentive to work less, work fatigue may result in people who are already working several jobs or too many hours to reduce the number of hours worked. 6
While it is commonly believed that democrats tend to put greater emphasis on addressing poverty and unemployment issues (Leigh, 2008; Beland, 2015; Wolf, 2015; Sieber & Izraeli, 2018; Wright, 2012), our findings contrast and complement the study done by Beland (2015) who using aggregate data found that under Democrat governors, Blacks are more likely to work, participate in the labor market, and work more intensively. As Beland (2015) mentioned, more work is needed in this area to understand the full extent of the role of political parties.
The findings in Table 5 also show that the democrat governors’ policies only give incentive to Blacks in the highest-earnings quantiles to increase their average hours worked. State policies that subsidize childcare may have different effects on workers depending on the classification in terms of earnings quantiles. It could be that childcare for instance allows Blacks in the highest-earnings quantiles to take time away from childrearing to increase their hours worked. 7
Table 6 shows that none of the earnings quantiles taken individually experienced an increase in earnings after Democrat governors implemented their labor policies. This may be because some workers who were already working too much decide to reduce their hours worked if for instance the minimum wage, childcare, or sick leave days become paid under democrat governors’ policies. In that case, the reduction in time may be driven by the need for a more balanced life. This may suggest the importance of empirically analyzing work fatigue as a factor to be taken into account in labor supply decisions along with democrat governors’ policies. 8
Table 7 shows that only workers with the lowest number of hours worked increase their number of hours worked after democrat governors implement their labor policies. This represents a total of 34% of Black workers who decide to increase their number of hours worked.
Table 8 shows that in contrast to Beland (2015) results, at the more micro subgroup level of hours worked, there has not been an increase in the earnings at all. This may suggest that the increase in hours worked observed in the lowest quantiles of hours worked in Table 7 did not translate into a substantial increase in earnings. This could be viewed as a wage trap for that subgroup. It may be that the increase in hours worked is mainly driven by new workers. New workers who enter that subgroup after democrat governors policies are implemented may be new immigrants or people coming out of the welfare system or from prison whose marginal earnings are equal to or below the average wage of people who were already in that subgroup before the policy is implemented. This situation may be connected to comparing marginal wage of new workers in a group with that of the average wage of workers already in the group before the implementation of the policy. If the marginal wage of new workers is less than the average wage of preexisting workers in that group, the average wage in that subgroup will not increase. 9
Table 8 shows that at the more micro levels in terms of subgroups related to the number of hours worked and earnings quantiles, there has not been an increase in the earnings at all. This also could be explained by the effect of the marginal wage of new workers in a subgroup being less or equal than the average wage of preexisting workers in that subgroup, which leads to the average wage in that subgroup not increase after the democrat governor policies are implemented.
Table 9 shows that there is no subgroup of Black workers in terms of hours worked and earnings quantiles that we’re able to increase their earnings after the democrat governors’ policies are implemented.
Table 10 brings additional light to Table 7 by showing that workers in the subgroup composed of Black workers in the first quantiles in hours worked and third quantiles in earnings (
Since the findings demonstrate that subgroup heterogeneity with respect to hours worked and earnings should be of interest to policymakers. The functioning of the American welfare system is a good one important element to have in mind when analyzing the full picture from our empirical results.
Understanding why hours may increase or decrease while wage decrease or remain fixed for certain subgroups.
Let us start with explaining why wage may decrease or remain fixed. After the policy, if in a subgroup, there are new entrants (welfare leavers) who decide to work full time but have an average wage that is lower than the previous average wage of that subgroup, then the average wage of that subgroup will decrease while the number of hours is increasing. Another explanation for the decrease in wage in a subgroup maybe that new entrants (welfare leavers) do not work for four quarters in a row, signaling a potential problem with employee retention and stability. Now let us provide a possible explanation for a decrease in hours as it related to the welfare system. It may be after that after the state policy, the number of people previously in the subgroup but that are not able to keep stable jobs is more important quantitatively than people (welfare leavers) entering that subgroup that are working full time. 10
Earnings trap and hours worked trap
The results have shown that the average wage of several groups does not change when the policies are implemented. This suggests several subgroups experience a “wage trap,” especially the group with the lower average wage. The “low-wage trap” shown in the estimations may be understood as a situation where those already in low-paid work are not able to increase their income when democrat governors implement their policies. The combination of income taxes, social security contributions, and benefits withdrawal may “tax away” all or a large part of any wage gain. 11
The estimations have also shown that the number of hours worked does not change after the democrat governors implement their policies. This suggests the existence of a “hours worked trap” referring to a situation where the number of hours worked does not change for a certain subgroup of workers. Income restrictions related to the welfare system may be an important factor to be considered in explaining the hours’ trap observed for certain subgroups. Some restrictions in the welfare system can entertain situations where increasing the number of hours worked is judged by certain subgroups to be sub-optimal from a well-being standpoint due to expected income-related benefits which would be lost upon working a full-time paid job.
State policies are needed to improve the income gains of those who have left welfare for work
The benefits and taxes can create a wage floor below which increasing the number of hours worked for certain subgroups does not bring any financial gain in the short term. 12 Taxes and benefits while affecting earnings shape work incentives. If earnings gains are insufficient to counter reductions in benefits, the number of hours worked may decrease or be stagnant for certain subgroups. Therefore, there is a need for a comprehensive strategy to assist workers in the subgroups where both earnings and hours worked do not change after the state labor policies are implemented. In assisting these subgroups, developing new innovative ways to deal with issues related to low levels of education and job skills, 13 weak public transportation systems, health problems, substance abuse, and domestic violence, and discrimination in labor markets should be at the forefront of a strategy that pursues poverty reduction while maximizing social well-being for Black workers. 14
Conclusion
Understanding how Black workers in the United States are affected by U.S. state policies in labor markets can shed light on new ways to improve or implement public policymaking. While there is substantial literature on the aggregate impact of labor policies on Black workers, little is known on the distributional impact of state policies among Black workers in the labor market. In this paper, we have contributed to this debate by highlighting the distributional impact of Democrat governors’ policies across twelve subgroups of Black workers sorted on two dimensions: earnings quantiles and hours worked. With respect to wages, we found that none of these subgroups experienced wage increase after Democrat governor’s policies are implemented. With respect to hours worked, only two subgroups increase their hours worked. These are workers in the subgroup composed of Black workers in the first quantile in hours worked and the third quantile in earnings (
There is currently a great deal of discussion on how to improve the labor markets outcomes for minorities in the US. One important insight from our paper is that the distribution of earnings and hours worked among Black workers can have considerable significance on how the Democrat governor’s labor policies affect them. Our results suggest that even within minority ethnic groups in the US, accounting for heterogeneity in the distribution impacts of policies implemented should not be overlooked and can provide more knowledge on how to improve the social well-being overall. In designing policies at the state level, it is important to take into account some characteristics of labor markets suggesting that jobs with more Black workers do tend to pay less than other jobs (Huffman & Cohen, 2004), and according to Boston (1990) the hypothesis that workers in the primary sector engage in less frequent job changes than workers in the secondary sector is supported for White workers but not for Black workers, which negatively affect their work experience. Black Americans have substantially lower rates of upward mobility and higher rates of downward mobility than Whites (Chetty et al., 2020). 15 Along the same lines, only 10% of Black households could be viewed as “solidly” middle-class (Darity et al., 2021) in the United States. Another unusual disadvantage faced by Black workers is related to the nexus between the penal system and the labor market (Western & Sirois, 2018). One in three Black men will be incarcerated over his lifetime (US Joint Economic Committee, 2020), and this will disproportionally hinder their future earnings prospects (Western & Pettit, 2005). 16 Finally, the staggering job losses sparked by the coronavirus pandemic have disproportionately affected Black communities and there is a concern that the COVID-19 recession is expected to be felt by Black workers even once it concludes (Hotchkiss, 2021).