
Abstract
This paper exploits a sharp regression discontinuity design to identify the causal impact of the Scottish Premiership League (SPL) “split” on spectator match attendance. We use data drawn from all 19 completed seasons for which this institutional arrangement has been in place. The causal effect of the “split” is to induce, for the last five rounds of games played in the season, a differential in average attendance of about 24% between the clubs that just qualify for the “Championship Play-off” section and those that do not. However, the annualized effect for the season is found to be modest.
Introduction
The organization of professional sports leagues can take many forms. The dominant format in the top domestic tiers of European soccer is generally an undivided league with a balanced schedule of fixtures played across the season. As noted by Szymanski (2003), the design of an optimal contest is a matter of significant financial concern for league organizers, participating teams, and consumers (or fans). The seminal contributions of Rottenberg (1956) and Neale (1964) to the economics of sports emphasized the importance of outcome uncertainty for the financial well-being of professional sports leagues.
A key objective of league organizers and administrators is the design of championship contests that exhibit sufficient outcome uncertainty to ensure an adequate level of competitive balance. This is a more challenging task for professional soccer leagues in Europe than for North American sports leagues. In the latter context, regulations ensure, inter alia, local monopoly control of the consumer market through the award of legal franchises to team owners, closed leagues with a fixed number of teams, revenue sharing, restricted player mobility, draft rules that provide teams with monopsony rights in player acquisition, roster limits, and hard salary caps. As a consequence, the more regulated leagues in North America enjoy a greater degree of competitive balance than European professional soccer leagues, and are also less susceptible to financial crises.
In the absence of a rigid regulatory framework, the design of the league structure assumes greater significance for European soccer leagues since it is one of the few levers available for administrators to influence a league’s competitive balance. In an attempt to enhance the degree of outcome uncertainty, a number of European soccer leagues switched from the more conventional format of an undivided league structure with a balanced schedule of fixtures to a “split” or “divided” league format with an unbalanced schedule. 1 In the 2000/01 season the Scottish Premiership, Scotland’s highest professional national league, introduced a 12-team format incorporating a “split” league structure. Under this arrangement, each club initially plays all other clubs three times yielding 33 games for each team in a first phase of games. Then, using league standings after completion of these games, the league “splits” into two halves of six teams each. The top six participate in the “Championship Play-off” mini-league, while the bottom six compete in a “Relegation Play-off” mini-league. Each team then plays the other once in their separate mini-leagues in a second phase of fixtures yielding an extra five league games culminating in a total of 38 games played per team in each season.
A key objective of the format is to ensure matches played, at what is colloquially known as the “business end” of the season, retain relevance and attractiveness for spectators given the enhanced match outcome uncertainty such a design potentially engenders. This follows from the fact that most teams competing in the separate sections are of broadly comparable playing standard. In addition, the new system also guaranteed a status quo ante with the Glasgow city rivals of Celtic and Rangers playing each other four times during a given season thus ensuring protection of the sizable revenues generated by these contests.
It is argued that competing in the Scottish Premiership’s “Championship Play-off” provides the lower ranked clubs qualifying for this section the prospect of staging home matches against opposition of perceived higher quality, which thus serves as a demand shift parameter for their home fixtures. In addition, the large fan base of the two Glasgow teams that perennially compete within the “Championship Play-off” section also performs a role in shifting the relevant demand schedule. 2 Thus, each fixture played in the “Championship Play-off” section has potential to attract more spectator interest through higher attendance, increased sponsorship and broadcast payments, larger prize money depending on where the team finally ranks in the top section, and the prospect of playing in European football competition the following season. Specifically, participation in the UEFA Champions League or the Europa League competitions yields sizable income returns even if progression through the earlier rounds of the two competitions is limited. For instance, in the 2018/19 season a club qualifying for the preliminary round of the Europa League received a participation fee of €240,000 with a bonus of €260,000 for progression to the next round. In contrast, being consigned to the “Relegation Play-off” section is likely to generate less spectator appeal, yield less sponsorship revenue and lower prize money. The cost (or penalty) of failing to qualify for the “Championship Play-off” section may not be inconsequential, particularly for teams competing for the league positions in the neighborhood of the “split.”
The key research objective of this study is to determine the causal impact of the Scottish Premiership’s institutionally determined “split” on spectator attendance – a key metric reflecting the financial health of a football club. The question has important policy relevance in that the “split” may amplify financial inequality within Scotland’s top professional soccer tier if the magnitude of the attendance effect is sizable. In turn, this may also act to reduce the long-run competitive balance of the league, weaken spectator interest, and ultimately the league’s overall financial position.
We exploit a quasi-experimental approach that exploits a sharp regression discontinuity design (RDD) (e.g., see Thistlethwaite & Campbell, 1960; Lee & Lemieux, 2010). This econometric approach allows the causal identification of the effect of interest through an exogenous variation that has its provenance in a discontinuity with respect to the assignment of observational units (i.e., football clubs) to a particular treatment. The use of RDD in the economics of sports is limited with existing studies covering a diverse set of topics. For example, Berger and Pope (2011) exploit data from professional basketball in the US to investigate whether teams losing at half-time actually win by full-time; Lee and Parinduri (2016) use data primarily from the German Bundesliga to examine the impact of the award of three as opposed to two points for a league win; Keefer (2016) focuses on the US National Football League draft to assess the salary implications of players falling one side or the other of a pre-specified draft selection threshold; and Brachert (2020) investigates the impact of a professional soccer club’s relegation from its country’s top tier on local economic activity using data from England, Germany, Italy and France.
The structure of the paper is now outlined. The next section provides a brief historical review of the organization of Scottish league football to assist in contextualizing the empirical analysis. A subsequent section provides the motivation and justification for use of the RDD framework in this application. The fourth and fifth sections detail the data and the empirical methodology respectively. These sections are then followed by two others that respectively report the key empirical findings and examine their robustness. A final section provides some concluding remarks.
Background and Context
The Scottish Football League (SFL) is one of the longest established in Europe and was formed in 1890 with a single league division of ten clubs. A second division was created three years later and this two-tier national league structure continued until 1975, albeit with a varying number of teams. The SFL was subject to re-structure from the 1975/6 season and a new league format emerged composed of a top tier of ten teams with two lower national tiers each comprised of 14 teams. The league was subject to a further re-configuration from the 2000/01 season onward, when the existing structure with a top tier of 12 teams, originally known as the Scottish Premier League (SPL), was introduced in conjunction with three additional lower national tiers containing ten teams each.
The introduction of the new league structure at the turn of the current century coincided with a period of significant financial stress for the majority of Scottish Premiership clubs. High wage costs and less attractive broadcast deals than those negotiated by the English Premier League led to increased indebtedness with few clubs recording a pre-tax profit and others entering administration. Morrow (2006) provides a review of the early financial state of Scottish soccer in the period immediately after the creation of the re-formatted Scottish Premier League. Ironically, the global financial crisis that emerged during the first decade of the century created opportunities for Scottish Premiership clubs to negotiate debt write-offs with various financial institutions. As a consequence, most clubs emerged from the crisis largely debt-free with no long-term liabilities.
According to Deloitte’s Annual Review of Football Finance for the 2015/16 season (see Barnard et al., 2017), the average revenue from gate receipts and other match day related activities within the stadium comprised over 40% of total income for Scottish Premiership clubs. Broadcast revenues represented a further one-fifth with the remainder sourced from either sponsorship or other commercial activities. The Scottish league is more heavily reliant on match day revenues for its income than most other European leagues (see UEFA, 2015).
The league is also generally regarded as one of the less competitively balanced within European top tier football. This is explained in part by the domination of the Glasgow dynasties of Celtic and Rangers, commonly known as the “Old Firm.” No club outside these two has won the Scottish Premiership since the league’s inception in 2000/01. Both enjoy large followings and their home games regularly command spectator attendance levels ranked among the highest in Europe. For instance, excluding the two Glasgow city rivals, the average attendance at Scottish Premiership games in the 2018/19 season was 8,655. The average attendance at a Glasgow Celtic game was over six times this average, while for Glasgow Rangers it was 5.7 times this average. The two Glasgow teams accounted for about 55% of total league attendance in the 2018/19 season. The total financial turnover in the Scottish Premiership for that season was about £207 million. About two-thirds of this was attributable to the two “Old Firm” teams with Celtic accounting for about 40% of the total. The two-team dominance is often implicated as a culprit in the league’s lack of competitive balance given the unequal distribution of financial resources it creates.
Nonetheless, the league enjoys a respectable international reputation given significant success on the European stage in the past by Scottish clubs. For example, Glasgow Celtic was the first British club to win the European Cup in 1967, Glasgow Rangers won the European Cup Winners’ Cup in 1972, and Aberdeen triumphed in the same competition ten years later. Dundee United reached the final of the UEFA Cup in 1987 and, in more recent times, Celtic progressed to the final of the same competition in 2003 with Rangers matching that achievement in 2008. On the basis of the Union of European Football Associations (UEFA) domestic league coefficients, the league is currently ranked 14th out of 55 European leagues. 3
The Scottish Premiership “Split” and Regression Discontinuity Design Assumptions
The league position of the club at the “split” (i.e., after the completion of the first phase of 33 games) represents the “forcing” variable with 1 denoting the bottom and 12 the top team at the “split.” The teams ranked 7th or above on this rating qualify for the “Championship Play-off” section, while teams located in the six places below are consigned to the “Relegation Play-off” section. It was noted earlier that clubs qualifying for the former section are subject to a positive treatment that may stimulate an increase in spectator attendance and revenue streams. However, clubs confined to the latter section are likely to incur a negative treatment consequent on their participation in a less prestigious lower mini-league with adverse implications for spectator attendance and revenues. In the context of a clinical randomized controlled trial (RCT), such circumstances potentially yield a randomization bias that threatens the internal validity of the trial given the control group does not provide the correct counterfactual for the treatment group in the absence of the treatment. This would matter in the current application if the primary research objective was the causal identification of the treatment effect associated with competing in the “Championship Play-off” section. In contrast, our primary purpose here is to causally identify the effect of the “split” on the attendance gap between the two sections. The presence of a “jump” in spectator attendance at the “split” may be attributable to the influence of either of these two treatment effects or a conflation of both. Thus, it is not argued here that it represents a pure “Championship Play-off” treatment effect.
We contend the current application satisfies the key requirements for a regression discontinuity design (RDD) for a number of reasons. First, the institutional rule governing assignment to the treatment is pre-determined and known in advance at the start of the season. It is thus exogenously determined. Second, league administrators cannot manipulate the rule governing the “split” during the playing season to ensure, for example, certain clubs are included in one or other of the two mini-league sections. Third, it is reasonable to assume that in the absence of the treatment, the outcome variable (i.e., log attendance) is smooth across the threshold (or discontinuity). The veracity of this assumption is investigated graphically below.
The more compelling argument for the use of RDD in this case, however, relates to the fact that football clubs have imprecise control over their league position at the time of the “split.” There are random factors that impact league rankings and this randomness assumes particular relevance for clubs competing in the neighborhood of the threshold. The notion that randomness (or luck) determines sporting outcomes is well established in the economics of sports literature. This theme has been emphasized more recently in a soccer context by the work of Gauriot and Page (2019) and Brachert and Flepp (2020). Given soccer is generally a low-scoring game where winning or losing is often determined by a single goal, randomness can contribute significantly to the outcome of a match. 4 Further, randomness is likely to be a more important factor in outcomes for teams with players of average quality than those comprised of elite players competing at the top end of the league (e.g., Celtic or Rangers). The former quality of team is the more likely to be contesting league placings around the threshold at the “split.”
Over the 19 seasons where a divided league structure has been in place in Scotland, the median points difference between the 6th and 7th ranked team at the “split” was three, the reward for just a single win in the league and equivalent to 3% of the total points available for the first phase of 33 games. In two of these 19 seasons, the “split” was actually determined by goal difference as the pair of teams at the threshold were inseparable on points won. It appears reasonable to argue the magnitude of these modest differences in points for teams competing at the threshold is likely to be explained by random factors that ultimately determine a team’s location one side or other of the threshold at the “split.” This characterization assumes important significance for the RDD given its interpretation in this case as a quasi-experiment exploiting a local randomization. 5
The “forcing” variable in this RDD application is discrete ordinal in nature. There are thus a modest number of support points underpinning the analysis. In particular, six integer values below and six either at or above the threshold are available. This is more than the minimum required for an ordinal “forcing” variable. In addition, the integer values are precisely determined and not subject to measurement error. Dong (2015) emphasizes the dangers of rounding-up continuous variables to discrete integers (e.g., age or birthweight) within the RDD setting and demonstrates such an approach introduces measurement error in the “forcing” variable yielding inconsistent treatment estimates. An additional advantage of having a discrete ordinal “forcing” variable is that less effort is required to determine the optimal bandwidth or smoothing parameter, which is a more challenging task when the “forcing” variable is continuous.
The application is interpreted as a sharp regression discontinuity design, since there is a sharp discontinuity in treatment at the threshold value of the “forcing” variable reflecting the club’s league position at the “split.” Specifically, there is a “jump” in the probability of a positive treatment from 0 to 1 at the threshold (i.e., a “forcing” variable value of 7 or above). The deterministic nature of the “split” precludes “no shows” in the “Championship Play-off” section or “cross-overs” from the “Relegation Play-off” to the “Championship Play-off” section. Therefore, there are no compliance issues for the empirical analysis undertaken here.
Data Description
The data are drawn from the 19 completed playing seasons incorporating the “split” format in the Scottish Premiership, which covers 2000/01 to 2018/19 (inclusive). The live spectator attendance data used in this study are available from the Scottish Professional Football League (SPFL) website 6 and for the core analysis relate to the last five rounds (i.e., the second phase) of matches played either in the “Championship Play-off” or the “Relegation Play-off” sections. This comprises 30 matches in each season, 15 within each of the two mini-league sections. Overall, a total sample of 570 observations are available for our primary analysis. The attendance variable is expressed in natural logarithmic form. The league positions of the 12 clubs after the 33rd round of matches in each season provide the realizations for the ordinal “forcing” variable. These two variables represent the key metrics for the core analysis.
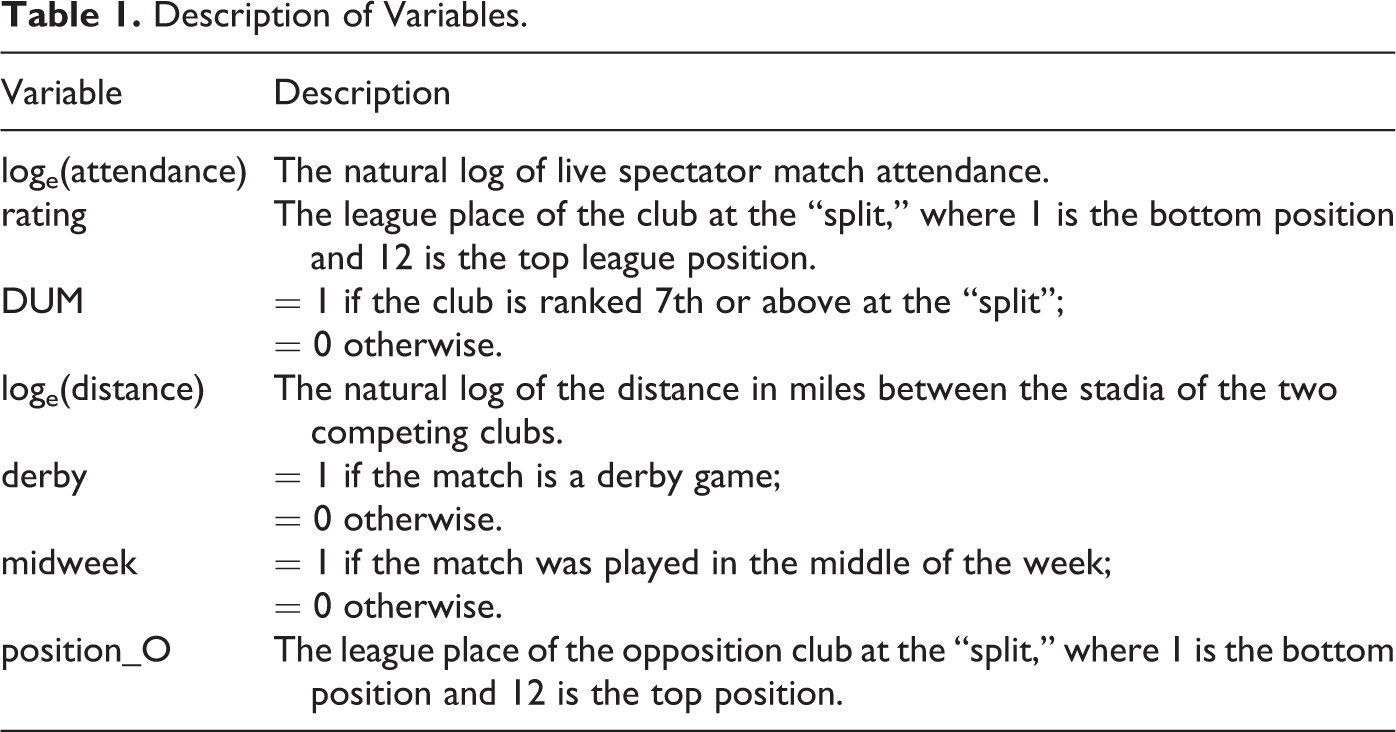
In addition to the above two measures, a number of other variables generally used in the soccer demand literature are also included. These comprise the natural log of the travel distance between stadia to reflect the opportunity and direct costs of attending a match for visiting fans; a dummy variable for whether or not the fixture is a local derby match 7 ; a dummy variable for whether or not the match is played mid-week rather than at a weekend; and a variable for the league position of the visiting side at the “split.” Table 1 provides a description of the full set of variables used, while Table 2 reports selected summary statistics.
Description of Variables.
Summary Statistics for Selected Variables.
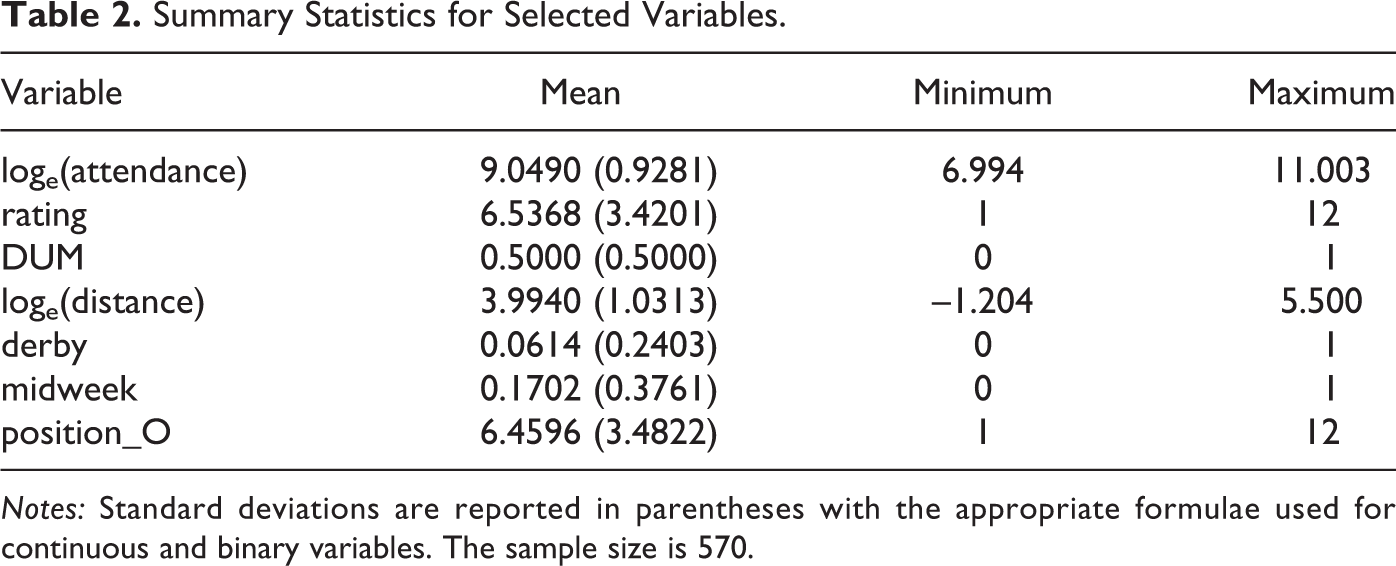
Notes: Standard deviations are reported in parentheses with the appropriate formulae used for continuous and binary variables. The sample size is 570.
Figure 1 depicts the relationship between log attendance and league position at the “split.” It reveals a positive relationship between the pair of variables. The threshold is captured by the vertical line. It is worth noting that the mass of points corresponding to league placings 11 and 12 in the upper right of this figure generally reflects the attendance data for Rangers and Celtic respectively.
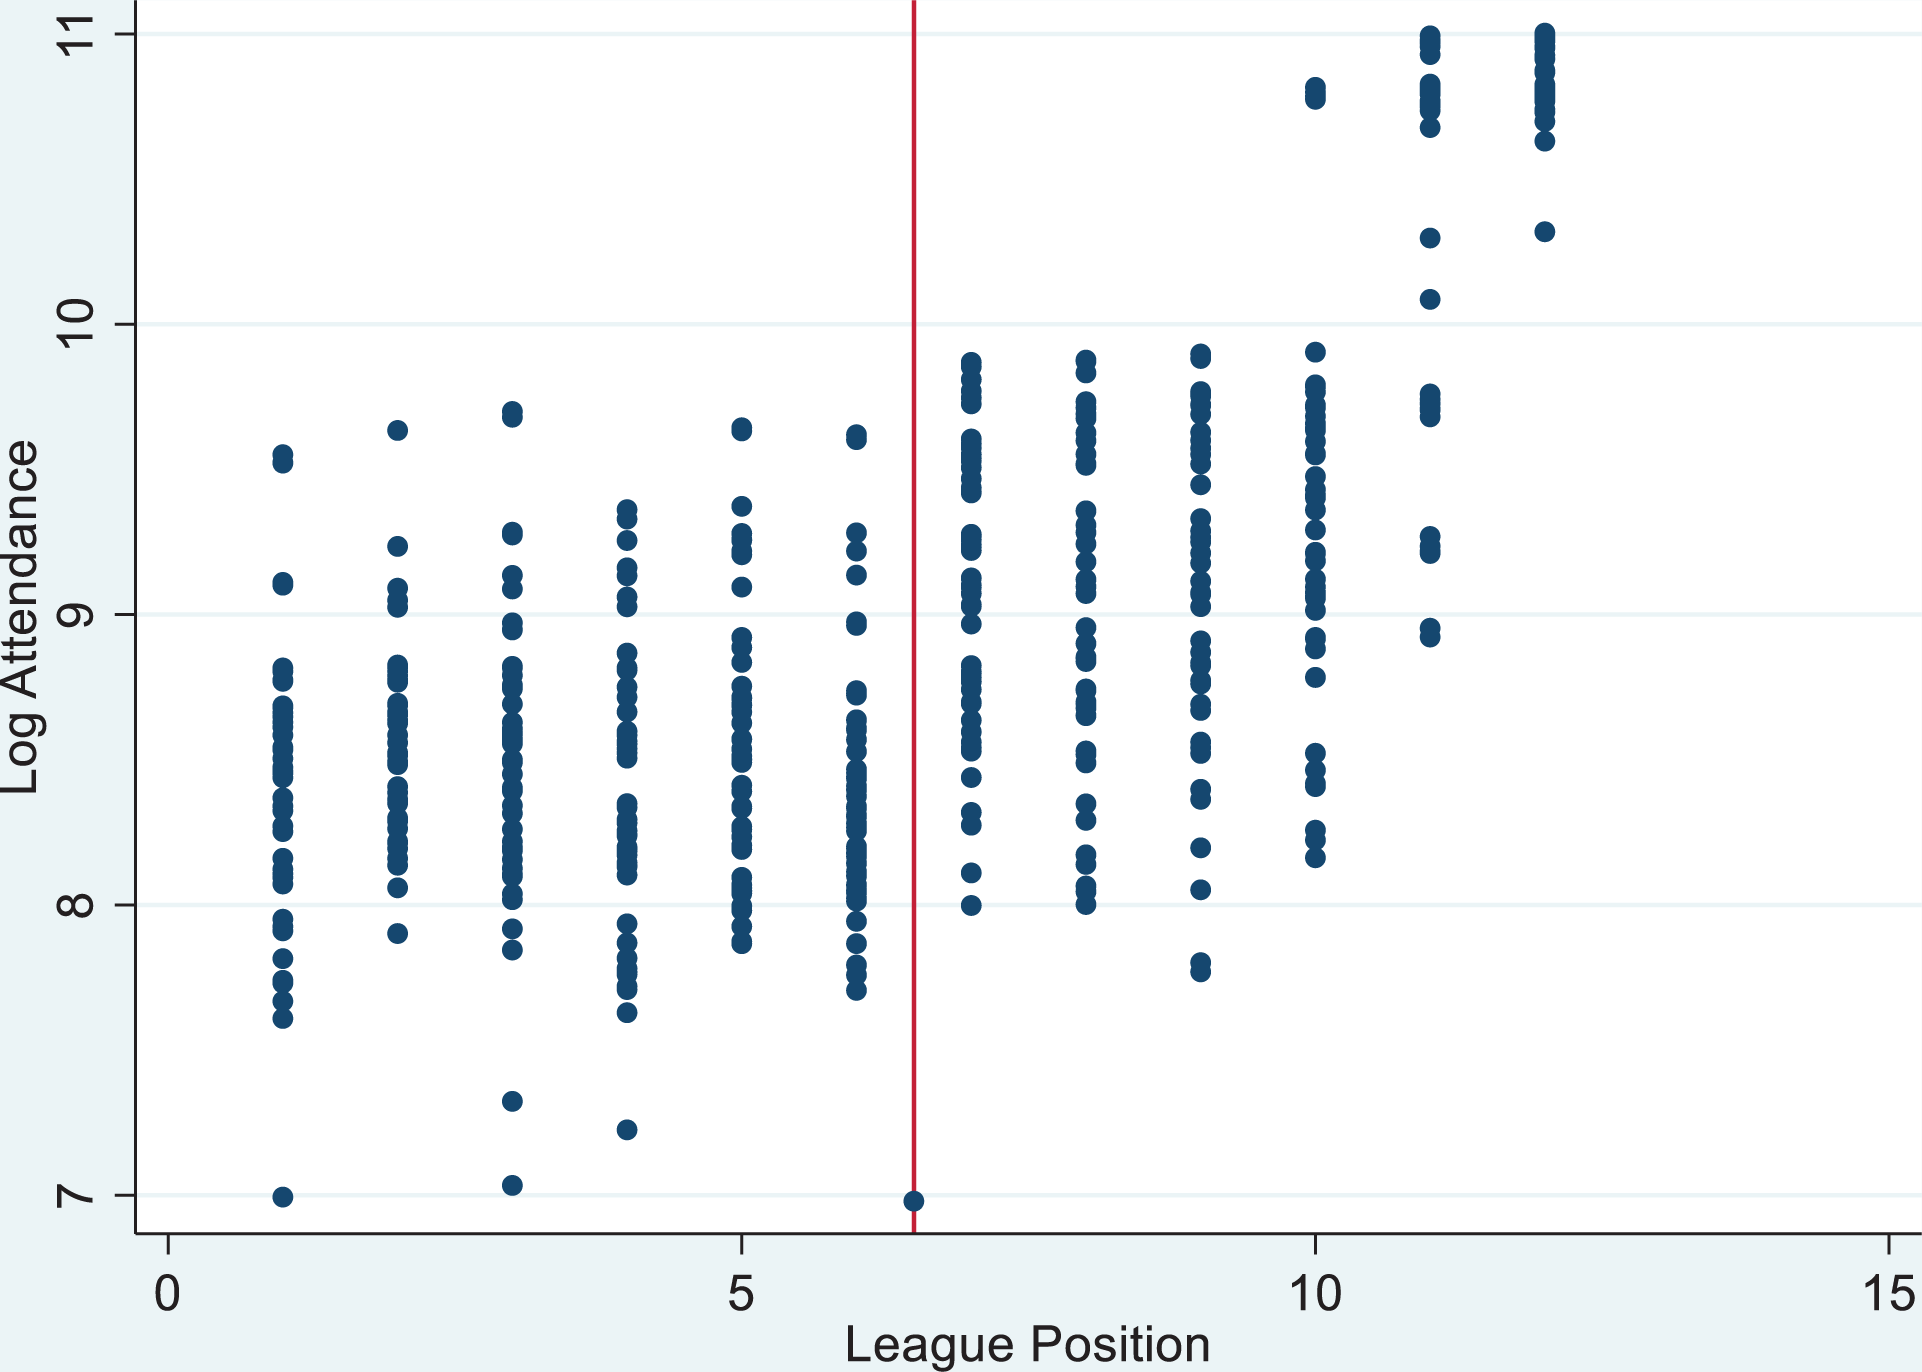
Plot of log attendance and league position at the “Split.” Note. The league rankings are 1 for the bottom placed team and 12 for the top placed team. The vertical line is the cut-point threshold.
Table 3 reports the average log difference in attendance between the “Championship Play-off” and the “Relegation Play-off” mini-leagues. The null hypothesis of common variances in log attendance across the two sections is rejected by the data with a significantly larger sampling variance detected for the former section. The point estimate for the mean differential is well determined and the t-test suggests a decisive rejection of the null hypothesis of no average log difference in attendance between the two mini-leagues. The magnitude of the raw log difference is 1.17. Therefore, the average attendance for the five games played in the “Championship Play-off” section is well over three times that of the “Relegation Play-off” section across the 19 seasons. 8
If we focus on the average log differential between the two sections in the neighborhood of the “split” (i.e., the average log difference for clubs between league positions 7 and 6), the differential is again found to be statistically significant though with a lower point estimate of 0.70. This estimate is potentially informative because it provides the difference in log attendance within a tight neighborhood either side of the threshold and is tentatively interpretable as a causal effect under the assumption of local randomization. However, extreme caution should be exercised in regard to such an interpretation given a potential boundary bias problem and other issues discussed below.
Average Log Attendance by League “Split” Category.
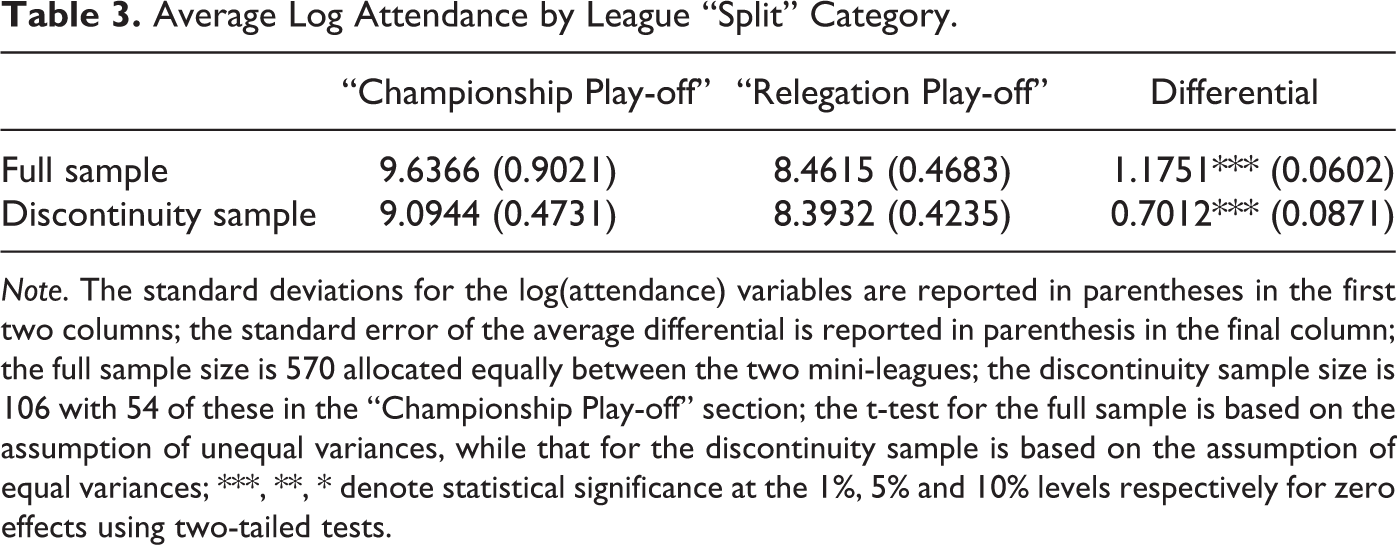
Note. The standard deviations for the log(attendance) variables are reported in parentheses in the first two columns; the standard error of the average differential is reported in parenthesis in the final column; the full sample size is 570 allocated equally between the two mini-leagues; the discontinuity sample size is 106 with 54 of these in the “Championship Play-off” section; the t-test for the full sample is based on the assumption of unequal variances, while that for the discontinuity sample is based on the assumption of equal variances; ***, **, * denote statistical significance at the 1%, 5% and 10% levels respectively for zero effects using two-tailed tests.
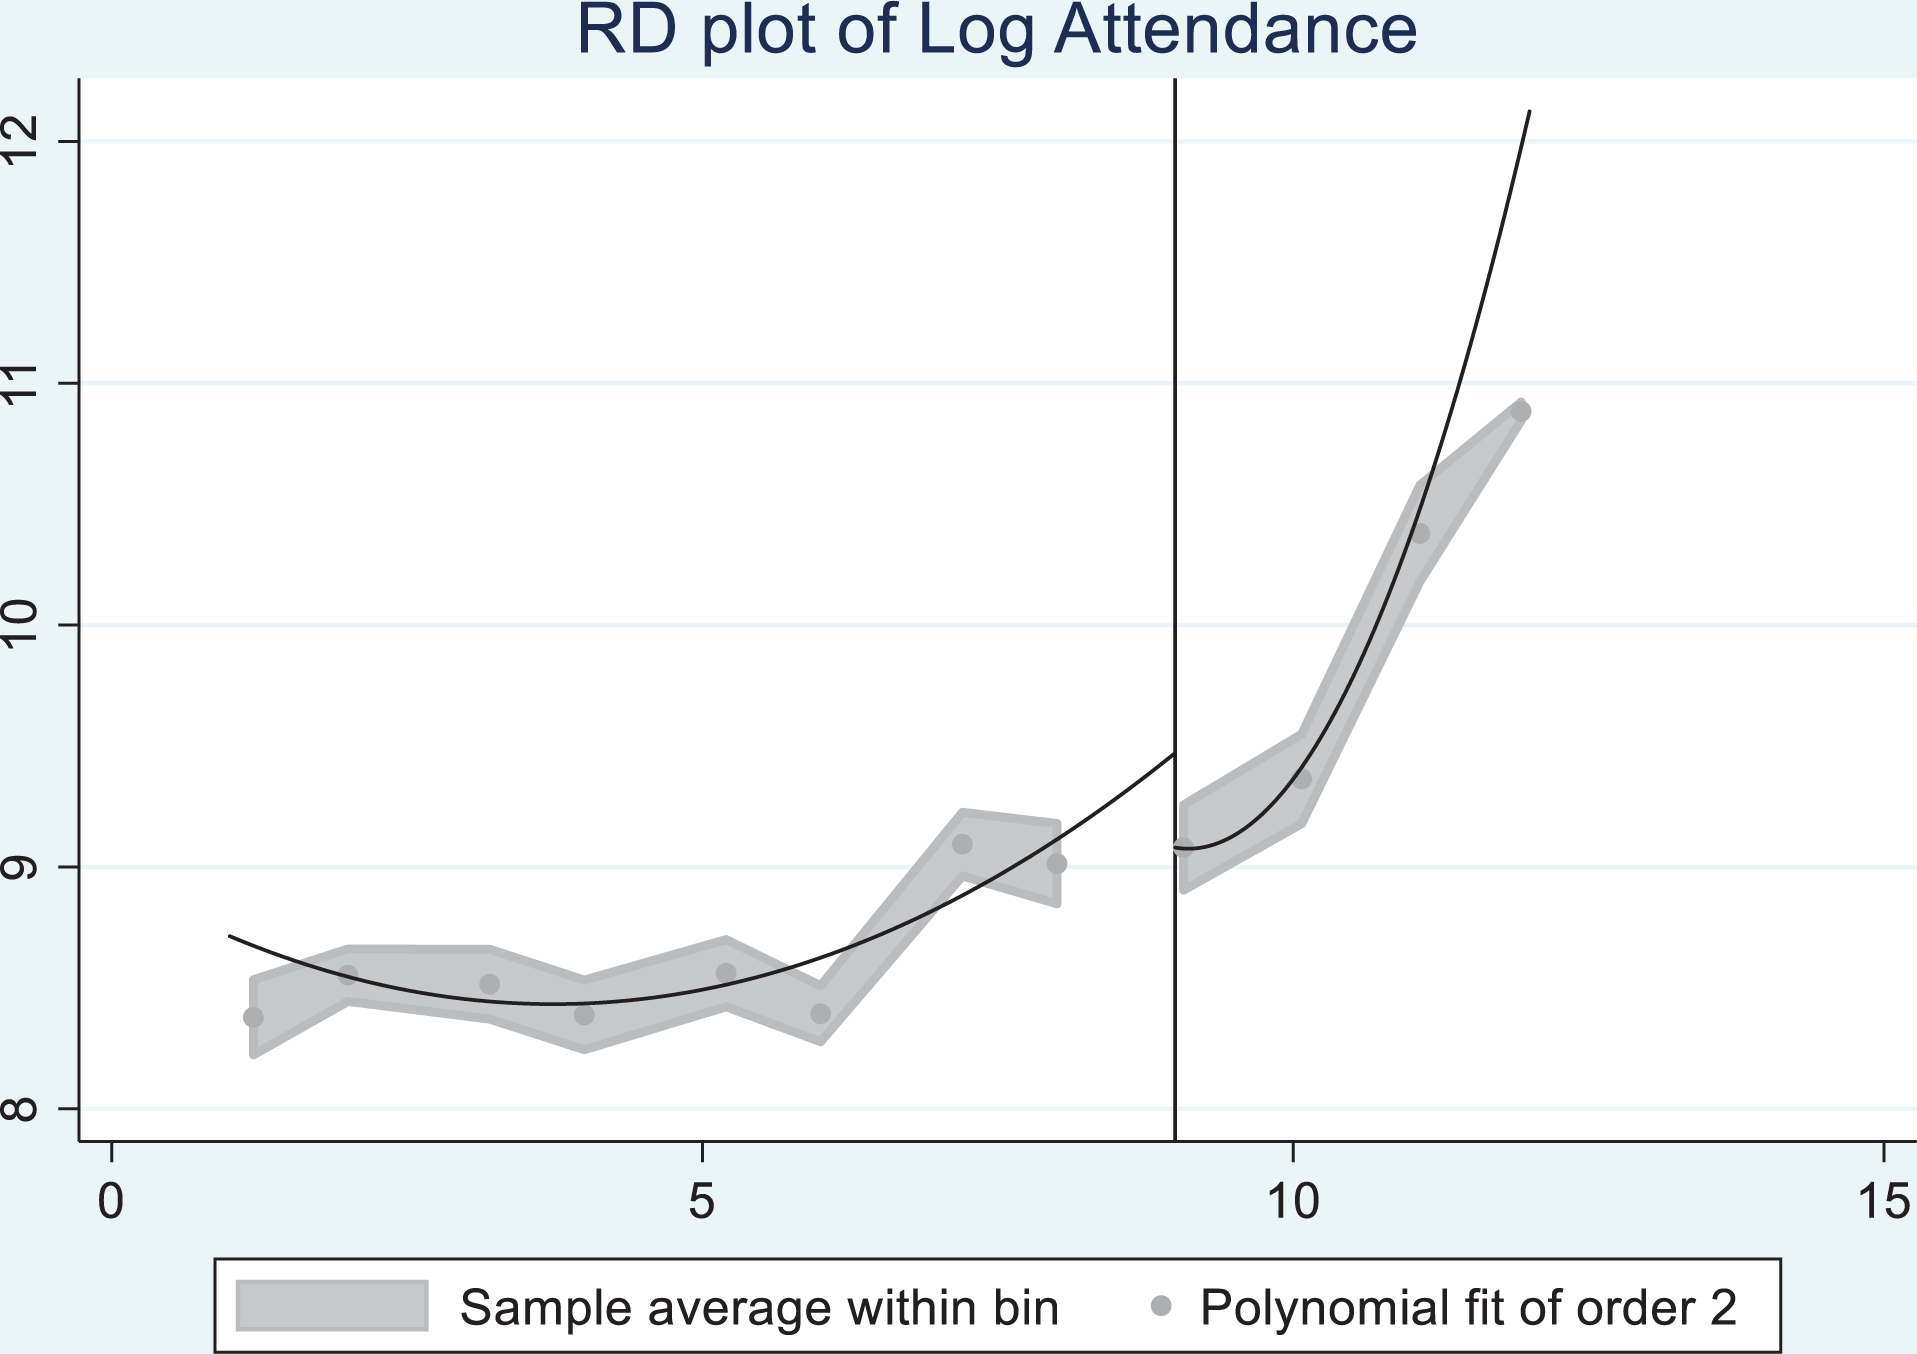
The foregoing reveals a sizable gap in average log attendance subsequent to the “split.” This is now explored further using a regression discontinuity (RD) plot. The RD plot, which is data driven, is arguably more revealing than the point estimates reported in Table 3. The plot mimics the data using a quadratic polynomial in conjunction with a triangular kernel density. The approach uses the sample means in each bin to reflect the underlying variability in the data with bins defined by the league positions at the “split.” Figure 2 provides the relevant RD plot for this case. It reveals strong evidence of a “jump” in log attendance at the threshold. It also suggests that log attendance evolves more steeply for the higher placed teams located at the 11th and 12th league positions, again reflecting the influence of the two Glasgow city teams on the spectator attendance data.
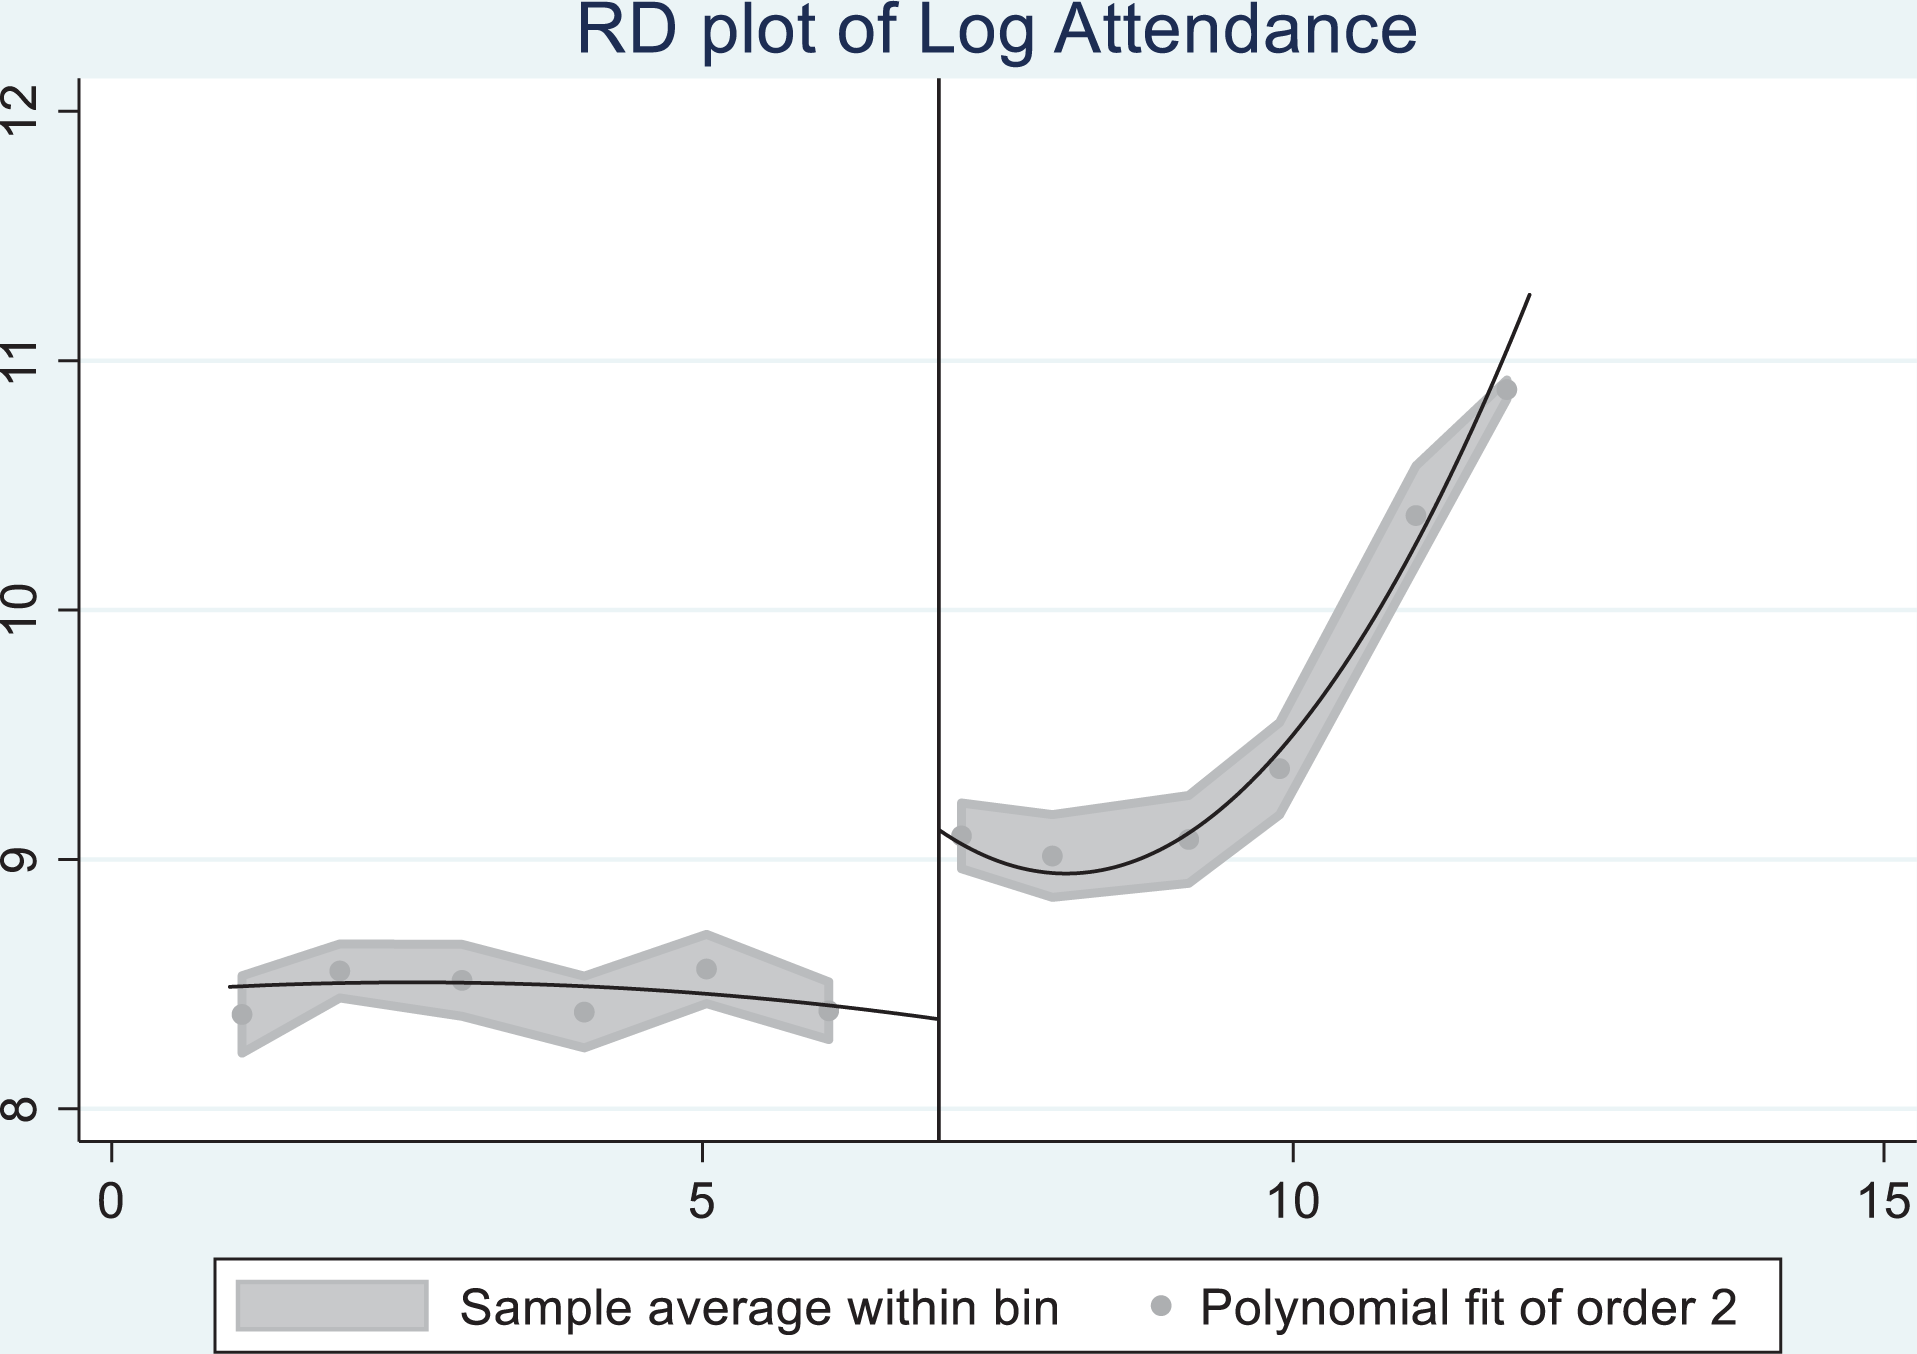
Regression discontinuity plot for log attendance. Note. The league rankings are 1 for the bottom placed team and 12 for the top placed team. The vertical line is the cut-point threshold and represents league placing 7. The shaded areas represent the 95% confidence interval.
The smoothness in the evolution of log attendance across the threshold in the absence of the league design treatment is now examined. As noted earlier, this is a key assumption in regression discontinuity design. In order to interrogate this proposition in more detail, the RD plot for log attendance and league position data for the 19 seasons using the first 33 rounds of matches prior to the “split” is replicated. There are 198 matches played in the first 33 rounds yielding a total of 19 × 198 = 3,762 data points. The league position used is the rank of the team just prior to the relevant fixture. For convenience of implementation, all clubs are ranked 12th (or joint top) for the opening game in each playing season. Figure 3 depicts the relevant plot. The graph reveals no evidence of a discontinuity in log attendance at the league position ultimately used to delineate the “split.” This provides re-assurance that invoking the smoothness assumption is relatively innocuous in the current application.
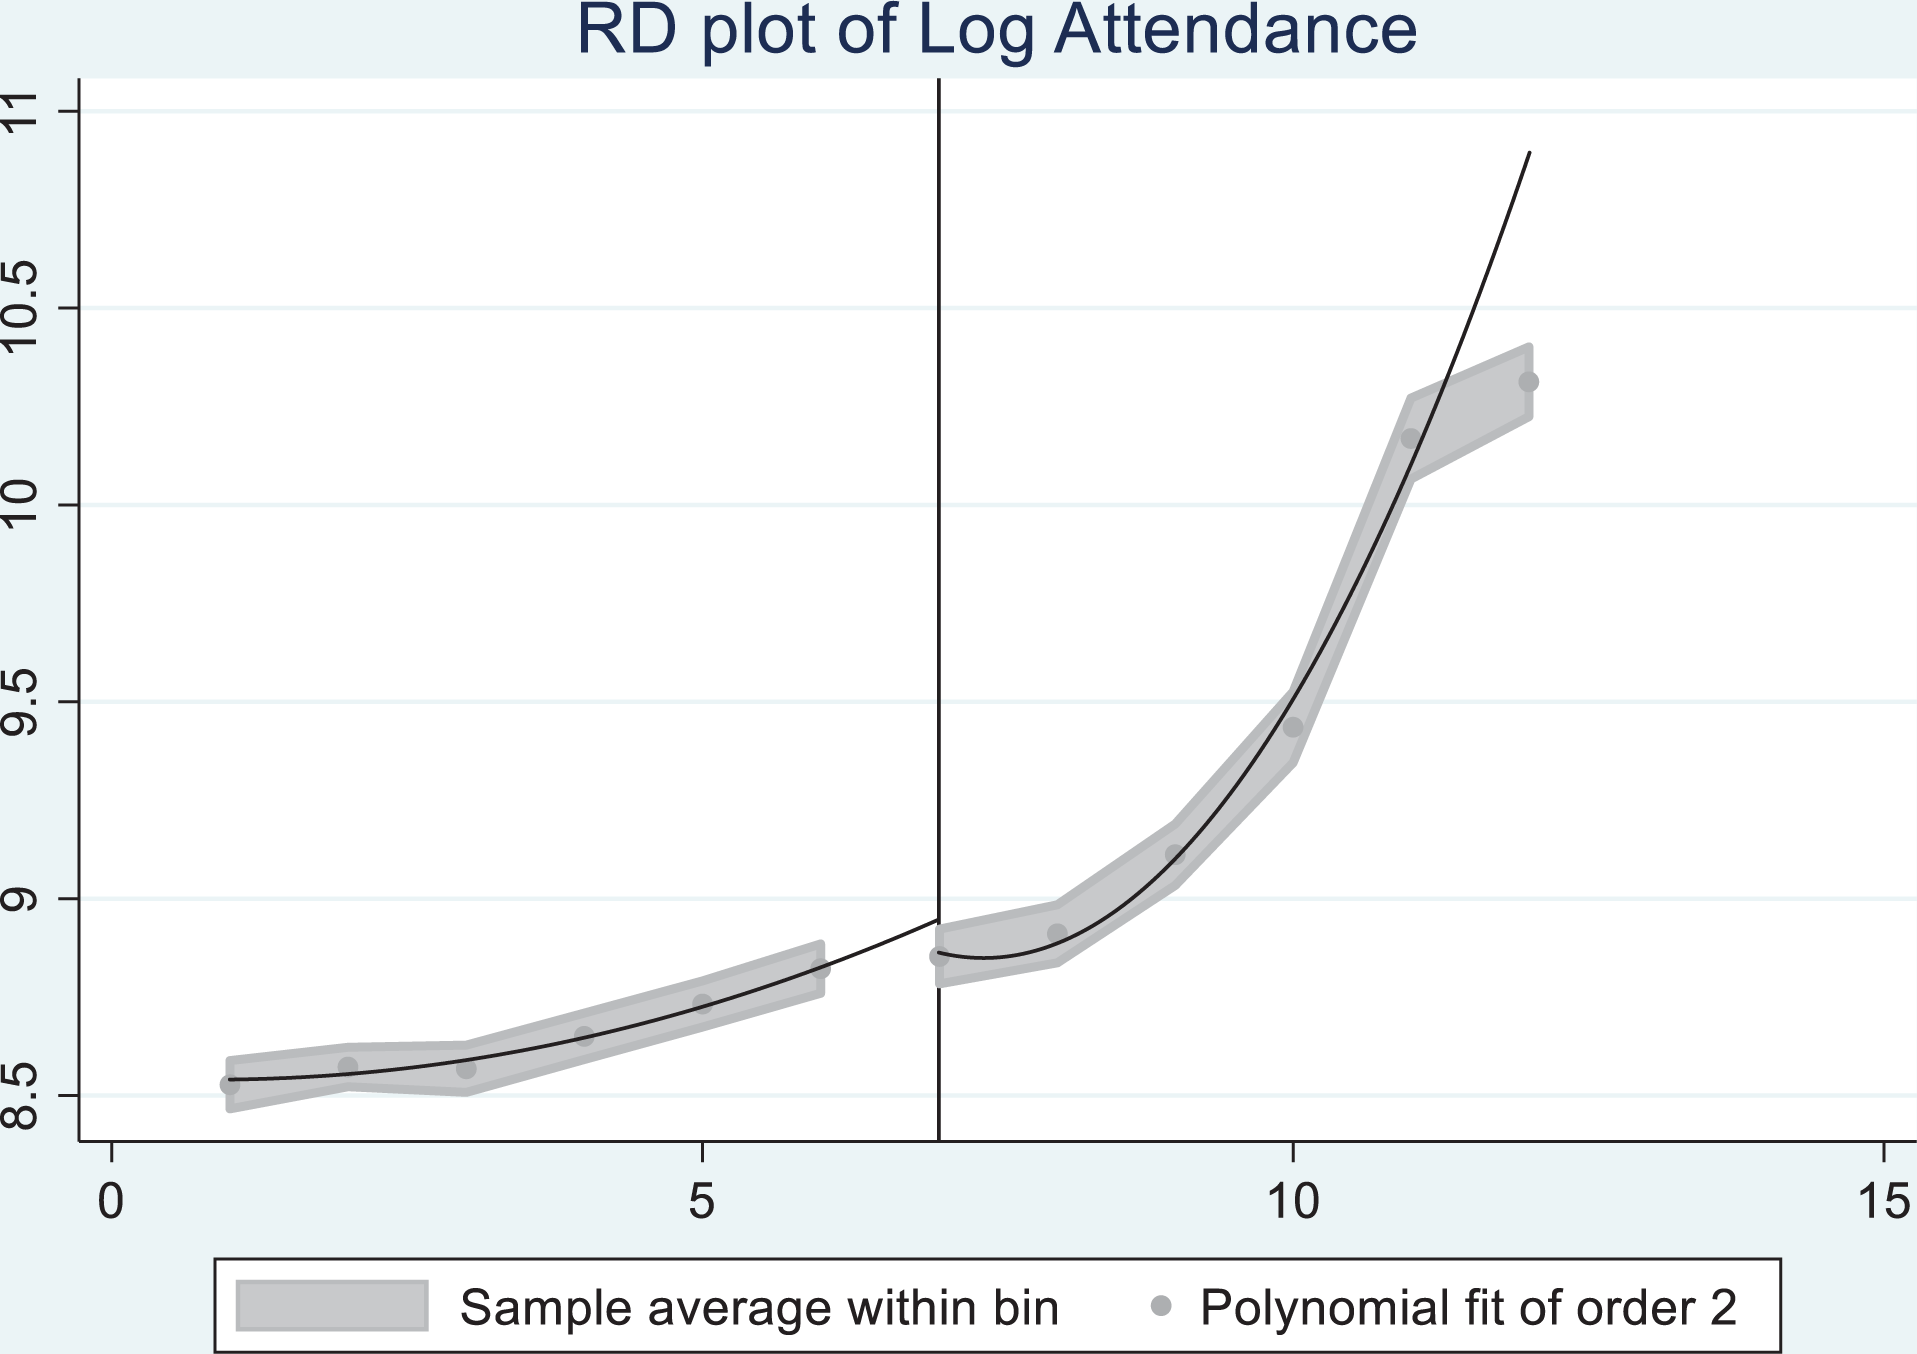
Smoothness across the threshold for log attendance in the absence of treatment. Note. The league rankings are 1 for the bottom placed team and 12 for the top placed team. There are 198 matches played in the first 33 rounds prior to the “split” yielding a total of 19 × 198 = 3,762 data points. The league position used is the rank of the team just prior to the fixture. The vertical line is the cut-point or threshold and represents league placing 7. The shaded areas represent the 95% confidence interval.
Empirical Methodology
The “treatment” variable is defined as:

A global parametric approach is used to estimate the following RDD equation by OLS:
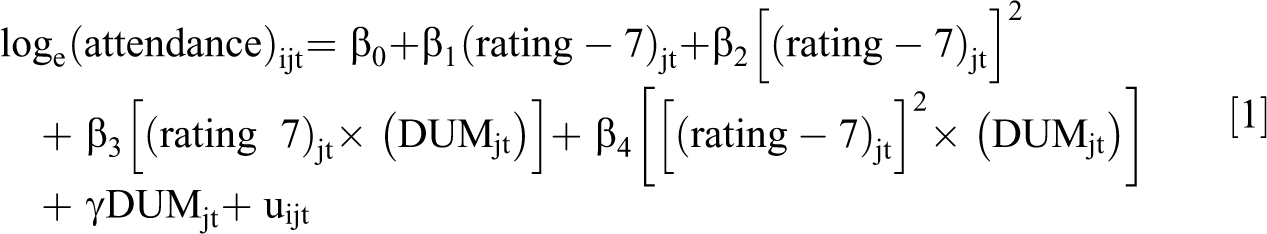
where i is the match, j is the team (j = 1,…,19), t is the time period specified in terms of the terminal year of the relevant playing season (t = 2001,…,2019), and uijt is the idiosyncratic error term.
The specification reported in [1] posits a relationship between log spectator attendance and a quadratic form of the “forcing” variable where the linear and quadratic effects are allowed to differ depending on whether the observation falls to the left or to the right of the threshold. Gelmen and Imbens (2019) challenge use of higher order polynomial terms in the “forcing” variable and recommend, as used in [1] above, a quadratic form as the most elaborate for any regression discontinuity design framework. The authors argue that over-fitting the “forcing” variable may bias the causal estimates and constrain a researcher’s ability to conduct meaningful inference.
A crucial feature of specification [1] is that all the variants of the “forcing” variables are re-centered at the cut-point, which is at a threshold value of 7 in this case. This implies that the resultant OLS estimate
The central empirical action within the RDD framework occurs around the threshold, so use of regression weights is generally advocated to capture this feature. In the current application, it is desirable to give a higher weight to those observations close to the threshold and down-weight observations furthest from the threshold. This provides a sensible strategy in the current case given the potentially large outlier roles the two “Old Firm” clubs exert on spectator attendance as already depicted in Figures 1 and 2. The weighting scheme adopted in this study exploits weights based on the reciprocal of the (absolute) integer distance from either the 6th rating (for those clubs in the “Relegation Play-off” section) or the 7th rating (for those clubs in the “Championship Play-off” section). Thus, the bottom club (rating = 1) and the top club (rating = 12) each attract a weight of 1/6 at the “split,” while those at rating = 2 and rating = 11 receive weights of 2/6 each, and so forth for the other rating pairs. In contrast, observations at ratings 6 and 7 are both assigned a value of 1. An important feature of this weighting scheme is that observations within the discontinuity sample attract the largest and equal weight regardless of whether they fall just to the left or just to the right of the threshold. 9
There is a suggestion that, with a discrete “forcing” variable, it is desirable to cluster the standard errors by the variable’s integer values. Kolesár and Rothe (2018) derive theoretical results, in conjunction with simulation and empirical evidence, suggesting such an approach does not prevent model mis-specification. Further, they find it also provides confidence intervals that exhibit empirical coverage well below nominal target values. This leads to an over-rejection of the null hypothesis of no treatment effect. The authors further argue that clustering on the “forcing” variable understates the statistical uncertainty associated with the causal estimates to a greater degree than the more standard Eicker-White-Huber (EWH) correction. In addition, given the relatively small number of support points (i.e., clusters) available in most RDD applications using a genuine discrete “forcing” variable, the downward bias in the standard errors resulting from clustering on the “forcing” variable is likely to be exacerbated (see Cameron & Miller, 2015). Kolesár and Rothe (2018) note the conventional EWH robust correction generates wider confidence intervals than those associated with clustering on the “forcing” variable and its use is thus commended as providing more conservative confidence intervals for inferential purposes. In addition, the authors suggest use of the EWH in circumstances where the bandwidth is sufficiently narrow, which is arguably the case in this application. 10 Therefore, our initial approach is to estimate model [1] above using a (weighted) OLS procedure and report standard errors based on the EWH robust correction.
The global parametric specification [1] above is augmented by inclusion of an array of standard soccer demand variables (contained in
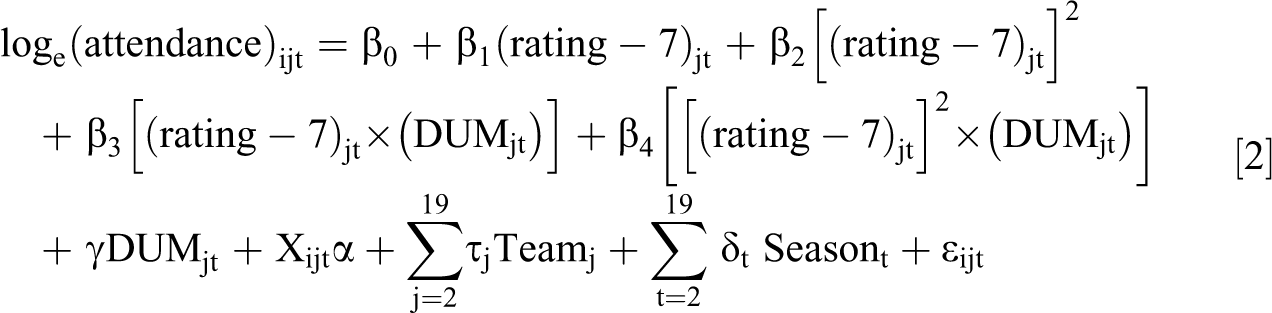
where εijt is now the idiosyncratic error term.
Specification [2] is again estimated by weighted OLS and provides our preferred specification. The standard errors are computed using the EWH robust correction.
Empirical Results
The parameter estimates for the austere global parametric model described in [1] above are reported in the first column of Table 4. Two of the four estimates corresponding to the quadratic specification for the “forcing” variable are found to be individually statistically significant at a conventional level. The statistically insignificant linear and quadratic effects detected for the “forcing” variable to the left of the threshold reflect the regression discontinuity plot in Figure 2, while the sizable positive coefficient on the quadratic “forcing” variable interacted with the “treatment” dummy mirrors the sharp rise to the right of the threshold depicted in this plot.
The dummy variable estimate (
Equation [1] is now augmented using a set of covariates traditionally used in modeling soccer demand. The explanatory variables include a dummy variable for whether the fixture occurred outside a weekend (“midweek”), a dummy variable if the fixture was a local derby match (“derby”), the log of the geographical distance in miles between the two clubs’ stadia (“loge(distance)”), and the league position of the opposition (or visiting team) at the “split” to reflect the absolute quality of the fixture (“position_O”). A desirable feature of these four variables is that all are orthogonal to, and unaffected by, the “treatment” associated with the “split.” 12
The use of fixed effects is not without debate in the RDD literature. Their inclusion is sometimes viewed as unnecessary for identification, which contrasts with their importance for causal identification in other empirical frameworks. The insertion of fixed effects into the RDD regression model is motivated primarily by a desire to reduce sample variance and enhance precision. There does appear a strong prima facie case for inclusion of club fixed effects in the current application given the sharp variability in spectator attendance observed across teams in the Scottish Premiership. This variability was found to be particularly evident at the top end of the RD plot depicted in Figure 2. The inclusion of such fixed effects helps absorb, among other things, the sizable variance associated with this unique phenomenon in the data. Specifically, the introduction of club-specific fixed effects attempts to empirically address Morrow’s (2006) apposite observation that “………. [u]nderstanding Scottish football means appreciating the significance of Celtic and Rangers, the so-called ‘Old-Firm’.” (p. 92). The augmented specification is finally completed with the addition of 18 season dummies to capture season-specific shocks that may potentially impact spectator attendance. An additional econometric motivation for their inclusion is to render more plausible the assumption that the idiosyncratic error term in [2] is independent across teams.
The estimates for the fully augmented log attendance equation [2] are reported in the second column of Table 4. Three of the estimates for the demand determining covariates are found to be statistically significant at a conventional level in this more baroque global parametric model. The exception is whether the match occurred in mid-week as opposed to at a weekend, where no statistically discernible effect is detected. The estimated distance elasticity suggests a 10% increase in travel distance between stadia reduces attendance by 1.2%, on average and ceteris paribus. This inelastic estimate is in comport with the broader soccer demand literature (e.g., see Buraimo, 2014; Reilly, 2015; Jena & Reilly, 2016). Derby games tend to attract less spectator interest than other games in the last five rounds of Scotland’s top tier and, according to the estimate reported in Table 4, attendance is 13% lower compared to a non-derby game, on average and ceteris paribus. The league position of the opposition at the “split” is also found to be statistically significant and suggests that a one place increase in the league ranking of the visiting side enhances attendance, on average and ceteris paribus, by 2.6%.
Equation [2] reveals that the quadratic estimate for the right side of the threshold (i.e., the “Championship Play-off” section) is now statistically indistinguishable from zero. Thus, the quadratic term to the right of the threshold appears to have been absorbing the effects of the two league clubs with the largest fan bases. Once club fixed effects are included, the steep well-determined effect for the “forcing” variable vanishes.
The introduction of the full set of additional controls sharply attenuates the estimated attendance effect for the league “split.” The magnitude of the effect is now estimated to be 0.212 but remains statistically well determined. Thus, the causal impact of the “split” after 33 games is estimated to induce an average attendance differential of about 24% (i.e., [e0.2122 – 1] × 100) between the “Championship Play-off” and the “Relegation Play-off” sections. This implies that over the 19-year period since the introduction of this league format about one-third of the average raw difference in log attendance in the last five rounds of matches between the pairs of teams randomly falling either side of the threshold is attributable to the league’s “split” design. 13
Weighted OLS Regression Discontinuity Estimates.
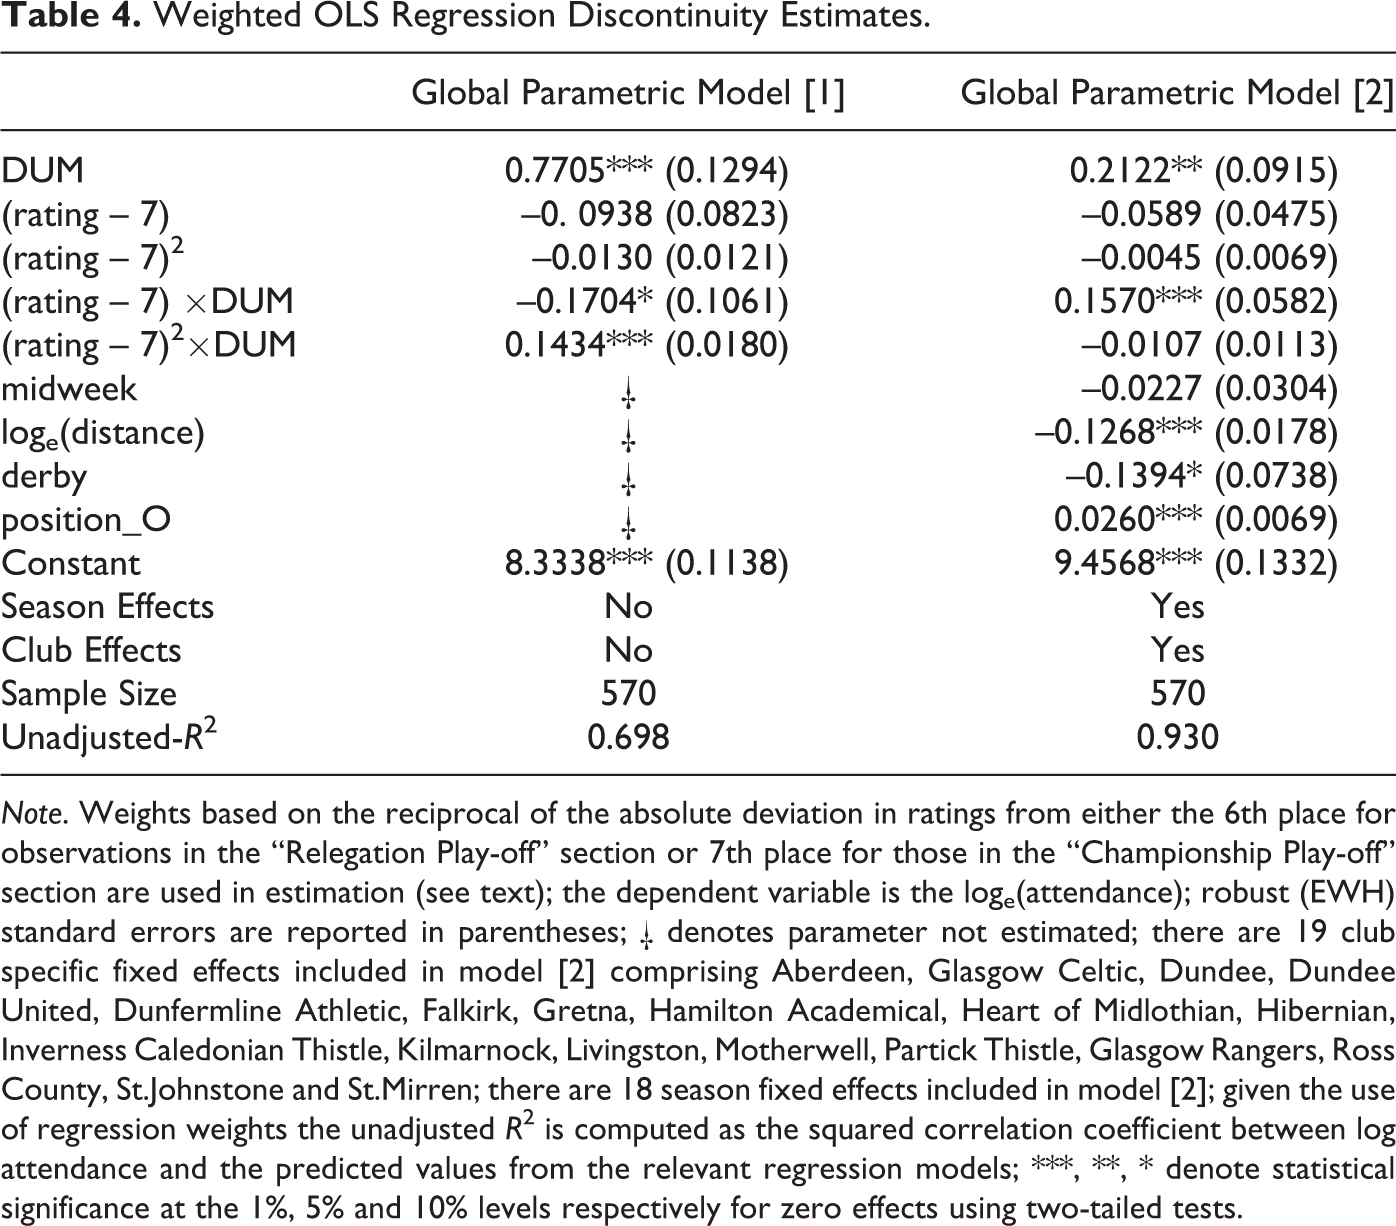
Note. Weights based on the reciprocal of the absolute deviation in ratings from either the 6th place for observations in the “Relegation Play-off” section or 7th place for those in the “Championship Play-off” section are used in estimation (see text); the dependent variable is the loge(attendance); robust (EWH) standard errors are reported in parentheses; † denotes parameter not estimated; there are 19 club specific fixed effects included in model [2] comprising Aberdeen, Glasgow Celtic, Dundee, Dundee United, Dunfermline Athletic, Falkirk, Gretna, Hamilton Academical, Heart of Midlothian, Hibernian, Inverness Caledonian Thistle, Kilmarnock, Livingston, Motherwell, Partick Thistle, Glasgow Rangers, Ross County, St.Johnstone and St.Mirren; there are 18 season fixed effects included in model [2]; given the use of regression weights the unadjusted R 2 is computed as the squared correlation coefficient between log attendance and the predicted values from the relevant regression models; ***, **, * denote statistical significance at the 1%, 5% and 10% levels respectively for zero effects using two-tailed tests.
Robustness Checks
The robustness of the key estimate obtained above is now investigated. In order to do so, we undertake three placebo or falsification checks and two additional econometric exercises. The first placebo/falsification check uses the current data and imposes a fake “split” at league rating 9 rather than 7. This could be viewed as a placebo “in-space.” The motivation for using this placebo is to assess if the differential observed between the “Championship Play-off” and “Relegation Play-off” sections is potentially induced by greater spectator interest in the former section animated by the prospect of qualifying for lucrative European competitions rather than by the “split” league format itself. In general, the top four teams in the Scottish Premiership tend to vie for qualification for either UEFA Champions’ League or Europa League places. This consideration is used here to determine a fake threshold. Figure 4 depicts the RD plot for this placebo and it exhibits a downward “jump” at the fake threshold, which is counterintuitive. In addition, Table 5 reports the treatment estimates for the fake “split” based on estimating global parametric models based on specifications [1] and [2]. The point estimate for the more austere of the two yields a statistically significant but implausible negative effect congruent with Figure 4. However, the estimated effect of interest in the more elaborate specification [2] fails to register statistical significance at a conventional level. The above suggests the absence of an intuitive or meaningful effect on spectator attendance when a fake “split” is imposed in a space beyond the genuine threshold.
Weighted OLS Regression Discontinuity Placebo for Fake Location of League “Split.”
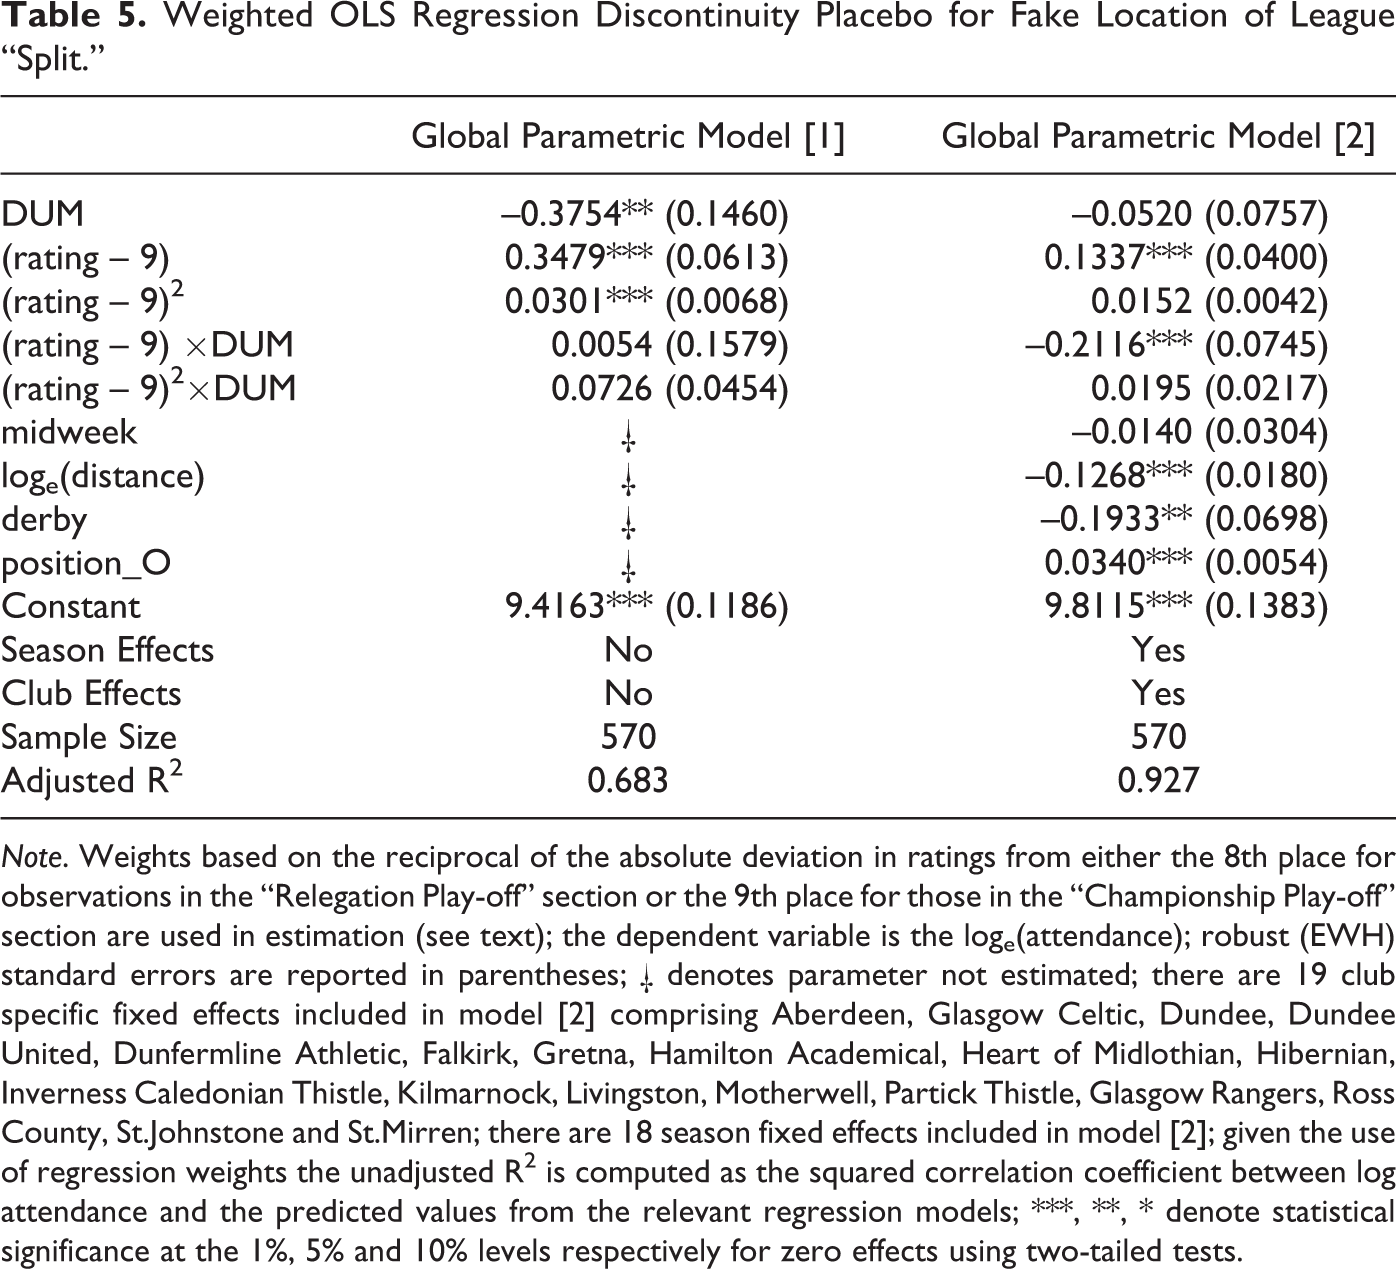
Note. Weights based on the reciprocal of the absolute deviation in ratings from either the 8th place for observations in the “Relegation Play-off” section or the 9th place for those in the “Championship Play-off” section are used in estimation (see text); the dependent variable is the loge(attendance); robust (EWH) standard errors are reported in parentheses; † denotes parameter not estimated; there are 19 club specific fixed effects included in model [2] comprising Aberdeen, Glasgow Celtic, Dundee, Dundee United, Dunfermline Athletic, Falkirk, Gretna, Hamilton Academical, Heart of Midlothian, Hibernian, Inverness Caledonian Thistle, Kilmarnock, Livingston, Motherwell, Partick Thistle, Glasgow Rangers, Ross County, St.Johnstone and St.Mirren; there are 18 season fixed effects included in model [2]; given the use of regression weights the unadjusted R2 is computed as the squared correlation coefficient between log attendance and the predicted values from the relevant regression models; ***, **, * denote statistical significance at the 1%, 5% and 10% levels respectively for zero effects using two-tailed tests.
The second placebo/falsification check uses data drawn from five rounds of the playing season immediately prior to the bifurcation of the league (i.e., rounds 28 to 32) and imposes a fake timing for the “split” based on the club’s actual rankings at the “split.” This could be interpreted as a placebo “in-time.” The relevant RD plot is reported in Figure 5 and reveals an upward jump in attendance. This is confirmed by the regression model threshold estimate in Table 6 for the more austere RDD specification [1]. However, when the preferred specification [2] is fitted to the data, the estimated effect at the threshold is found not to be statistically distinguishable from zero. Again, the analysis reveals the absence of an effect when an artificial “split” is imposed at a time prior to the authentic one.
Weighted OLS Regression Discontinuity Placebo for Fake Timing of League “Split.”
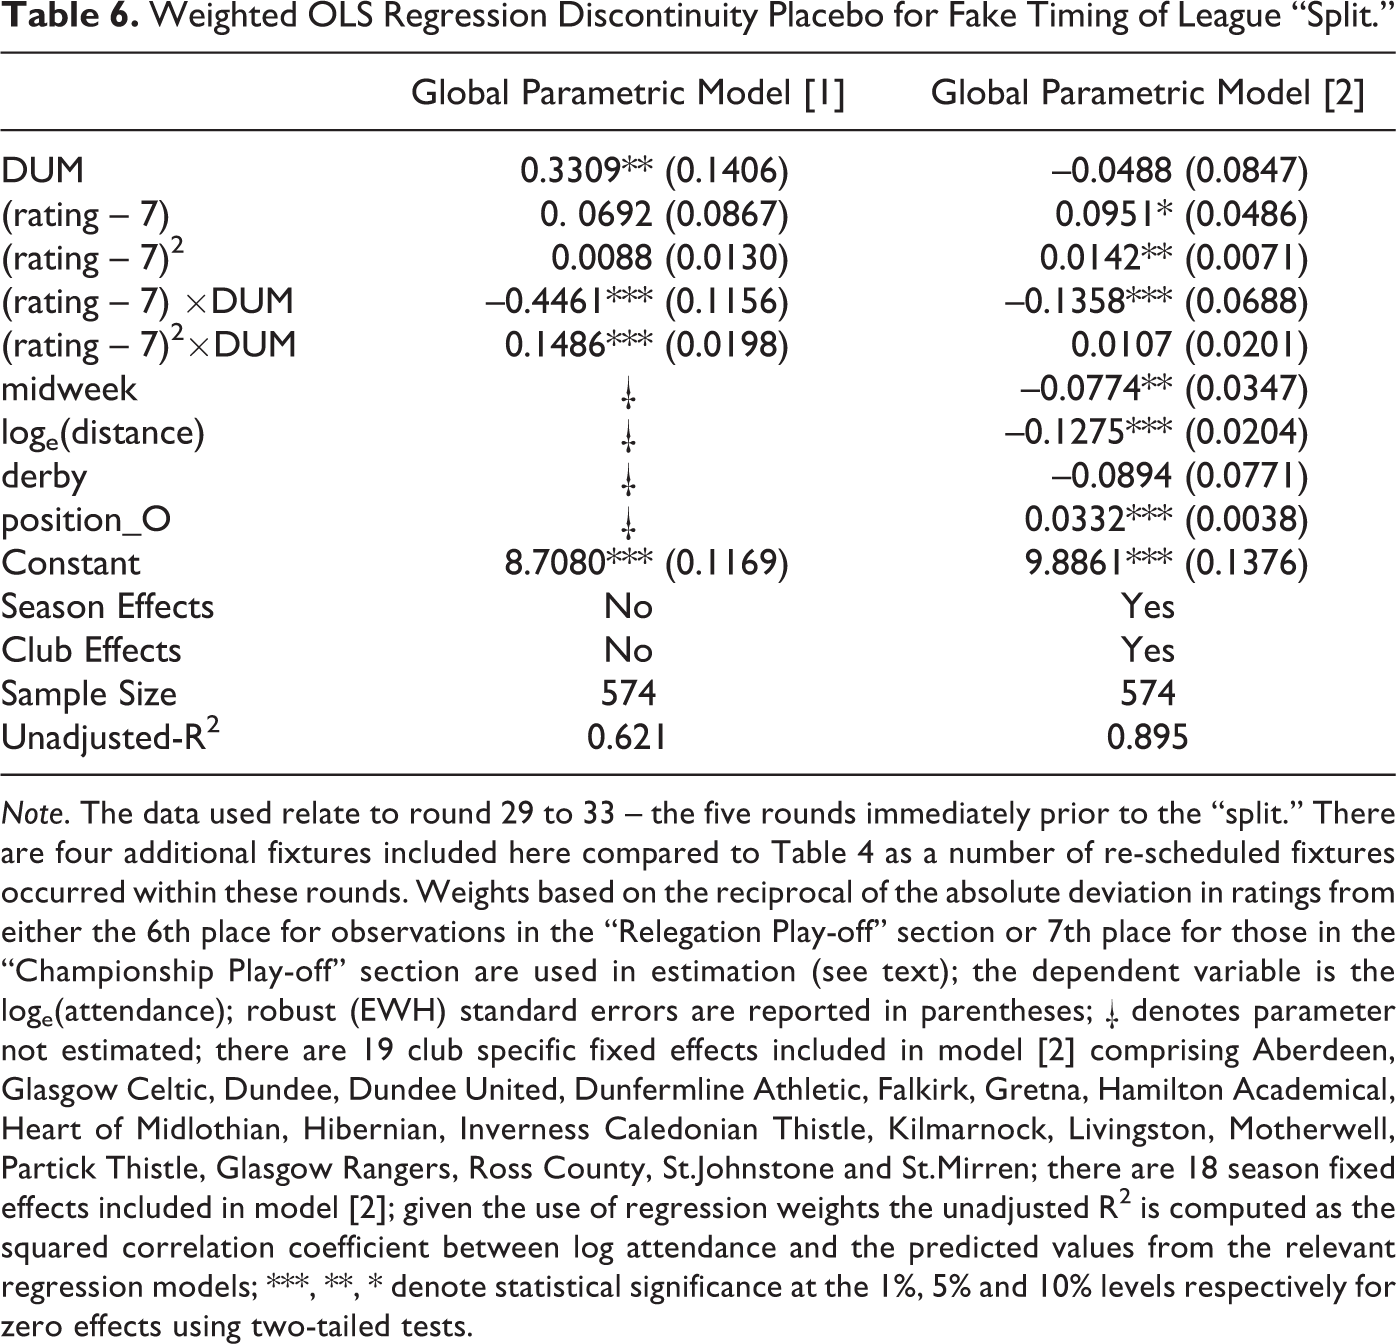
Note. The data used relate to round 29 to 33 – the five rounds immediately prior to the “split.” There are four additional fixtures included here compared to Table 4 as a number of re-scheduled fixtures occurred within these rounds. Weights based on the reciprocal of the absolute deviation in ratings from either the 6th place for observations in the “Relegation Play-off” section or 7th place for those in the “Championship Play-off” section are used in estimation (see text); the dependent variable is the loge(attendance); robust (EWH) standard errors are reported in parentheses; † denotes parameter not estimated; there are 19 club specific fixed effects included in model [2] comprising Aberdeen, Glasgow Celtic, Dundee, Dundee United, Dunfermline Athletic, Falkirk, Gretna, Hamilton Academical, Heart of Midlothian, Hibernian, Inverness Caledonian Thistle, Kilmarnock, Livingston, Motherwell, Partick Thistle, Glasgow Rangers, Ross County, St.Johnstone and St.Mirren; there are 18 season fixed effects included in model [2]; given the use of regression weights the unadjusted R2 is computed as the squared correlation coefficient between log attendance and the predicted values from the relevant regression models; ***, **, * denote statistical significance at the 1%, 5% and 10% levels respectively for zero effects using two-tailed tests.
The third placebo/falsification check uses data drawn from the 19 seasons completed immediately prior to the introduction of the “split” league format in 2000/01. This alternative placebo “in time” is conducted to investigate whether the estimated effects detected for the Scottish Premiership are present in spectator attendance data for Scotland’s professional top tier in the seasons before the introduction of the league’s format change. The seasons used are from 1981/82 to 1999/2000 inclusive. The league was composed of ten teams for 14 of these seasons and 12 for the other five. The analysis focuses down on the last five rounds of matches in each season as if a “split” had actually occurred. As there were 14 seasons with ten teams, this yields 25 fixtures per season and 350 matches. For the five seasons with a 12-team league format, 30 fixtures per season are available comprising 150 matches over the relevant period. Therefore, the overall sample available for analysis contains a total of 500 matches.
In order to facilitate use of the RD plots, only fixtures from those playing seasons where a 10-team league was in place is exploited as more data are available when using this league design. This choice is also dictated by the need for an immutable threshold over time for the RD plots.
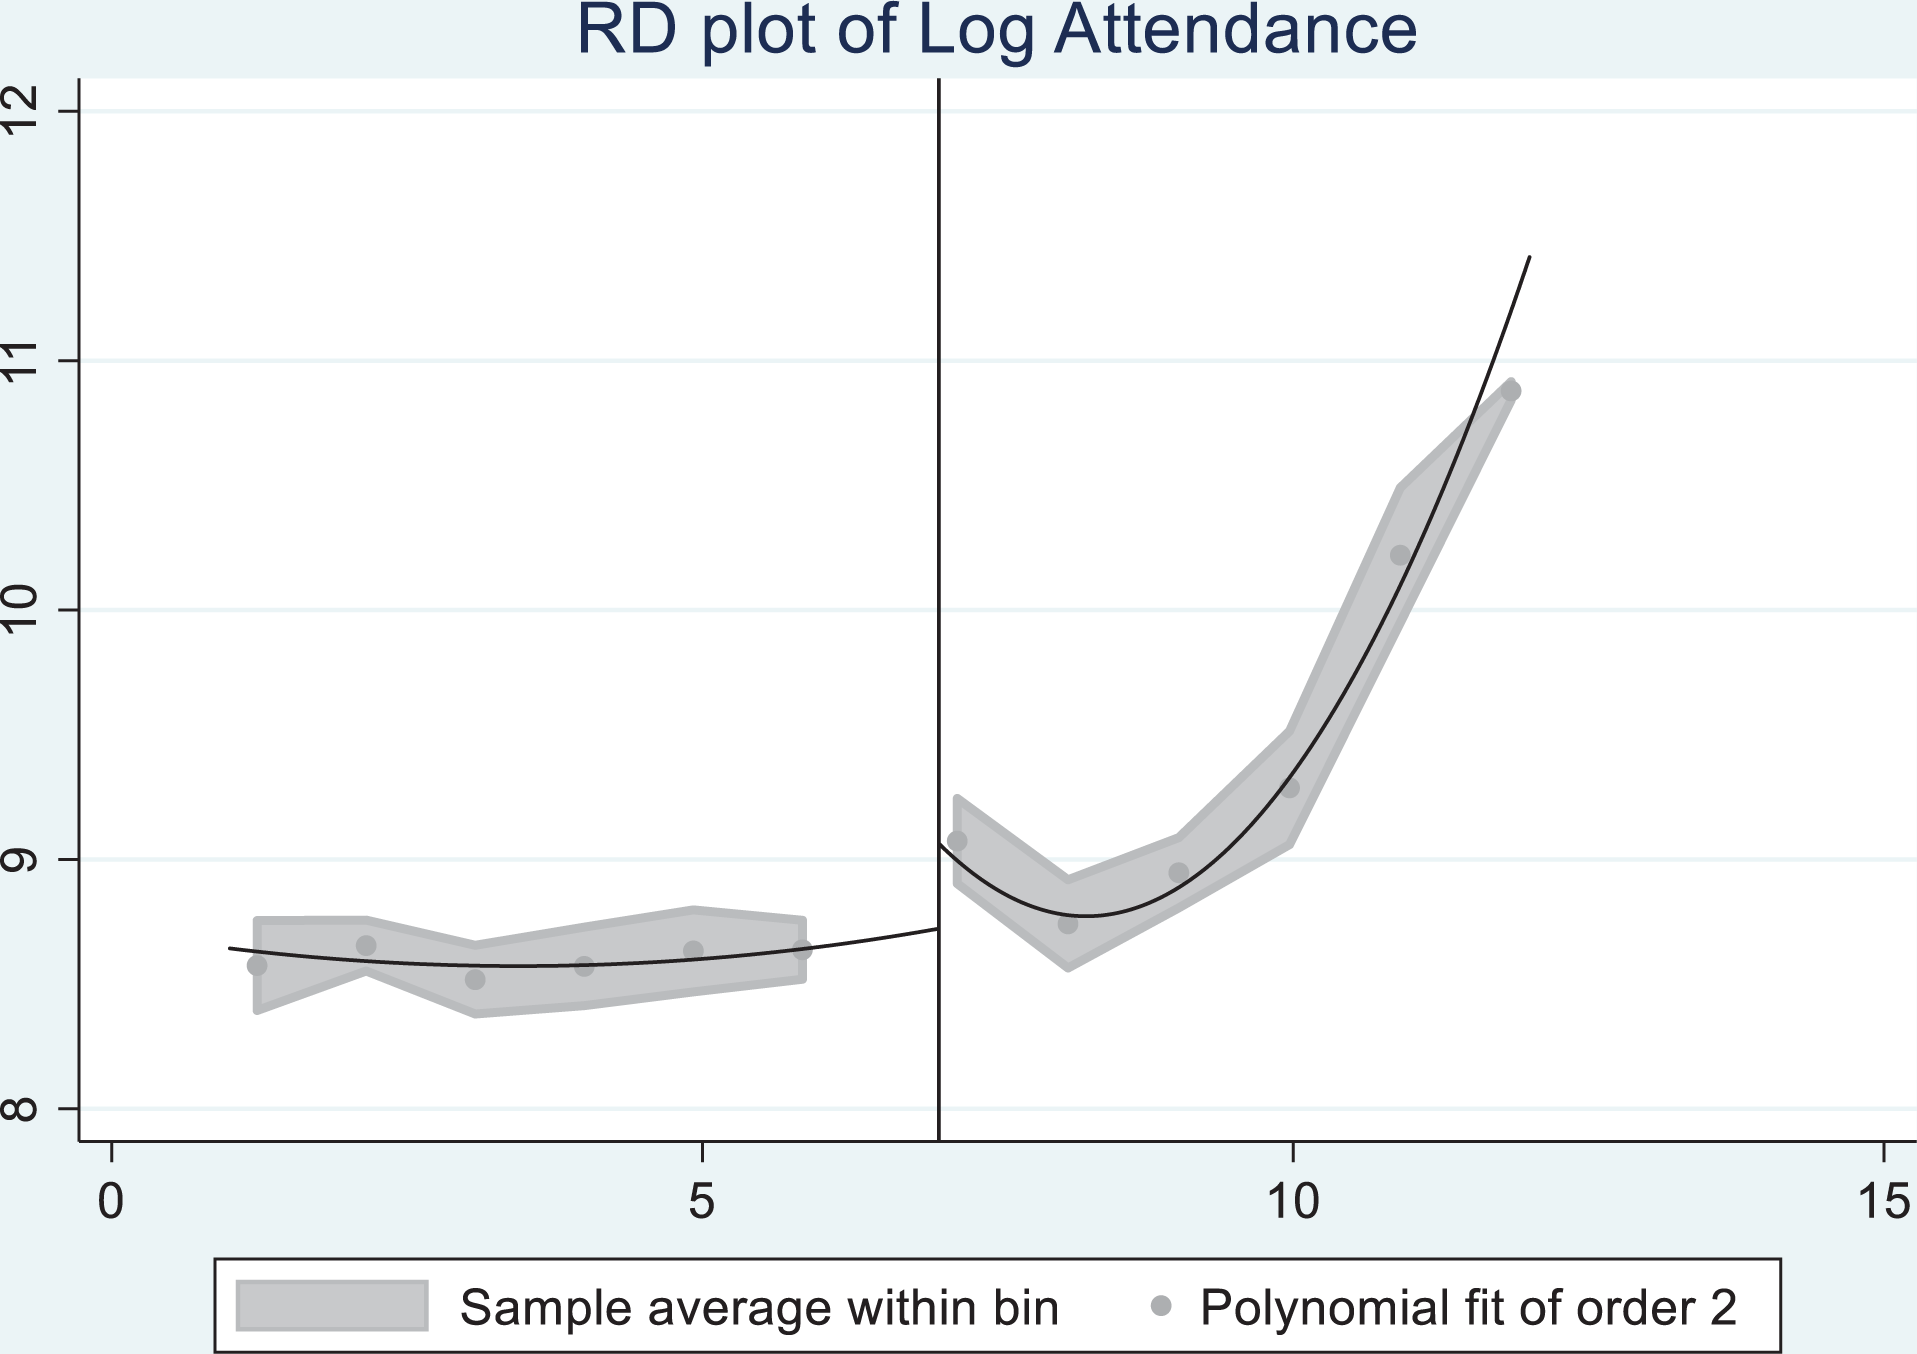
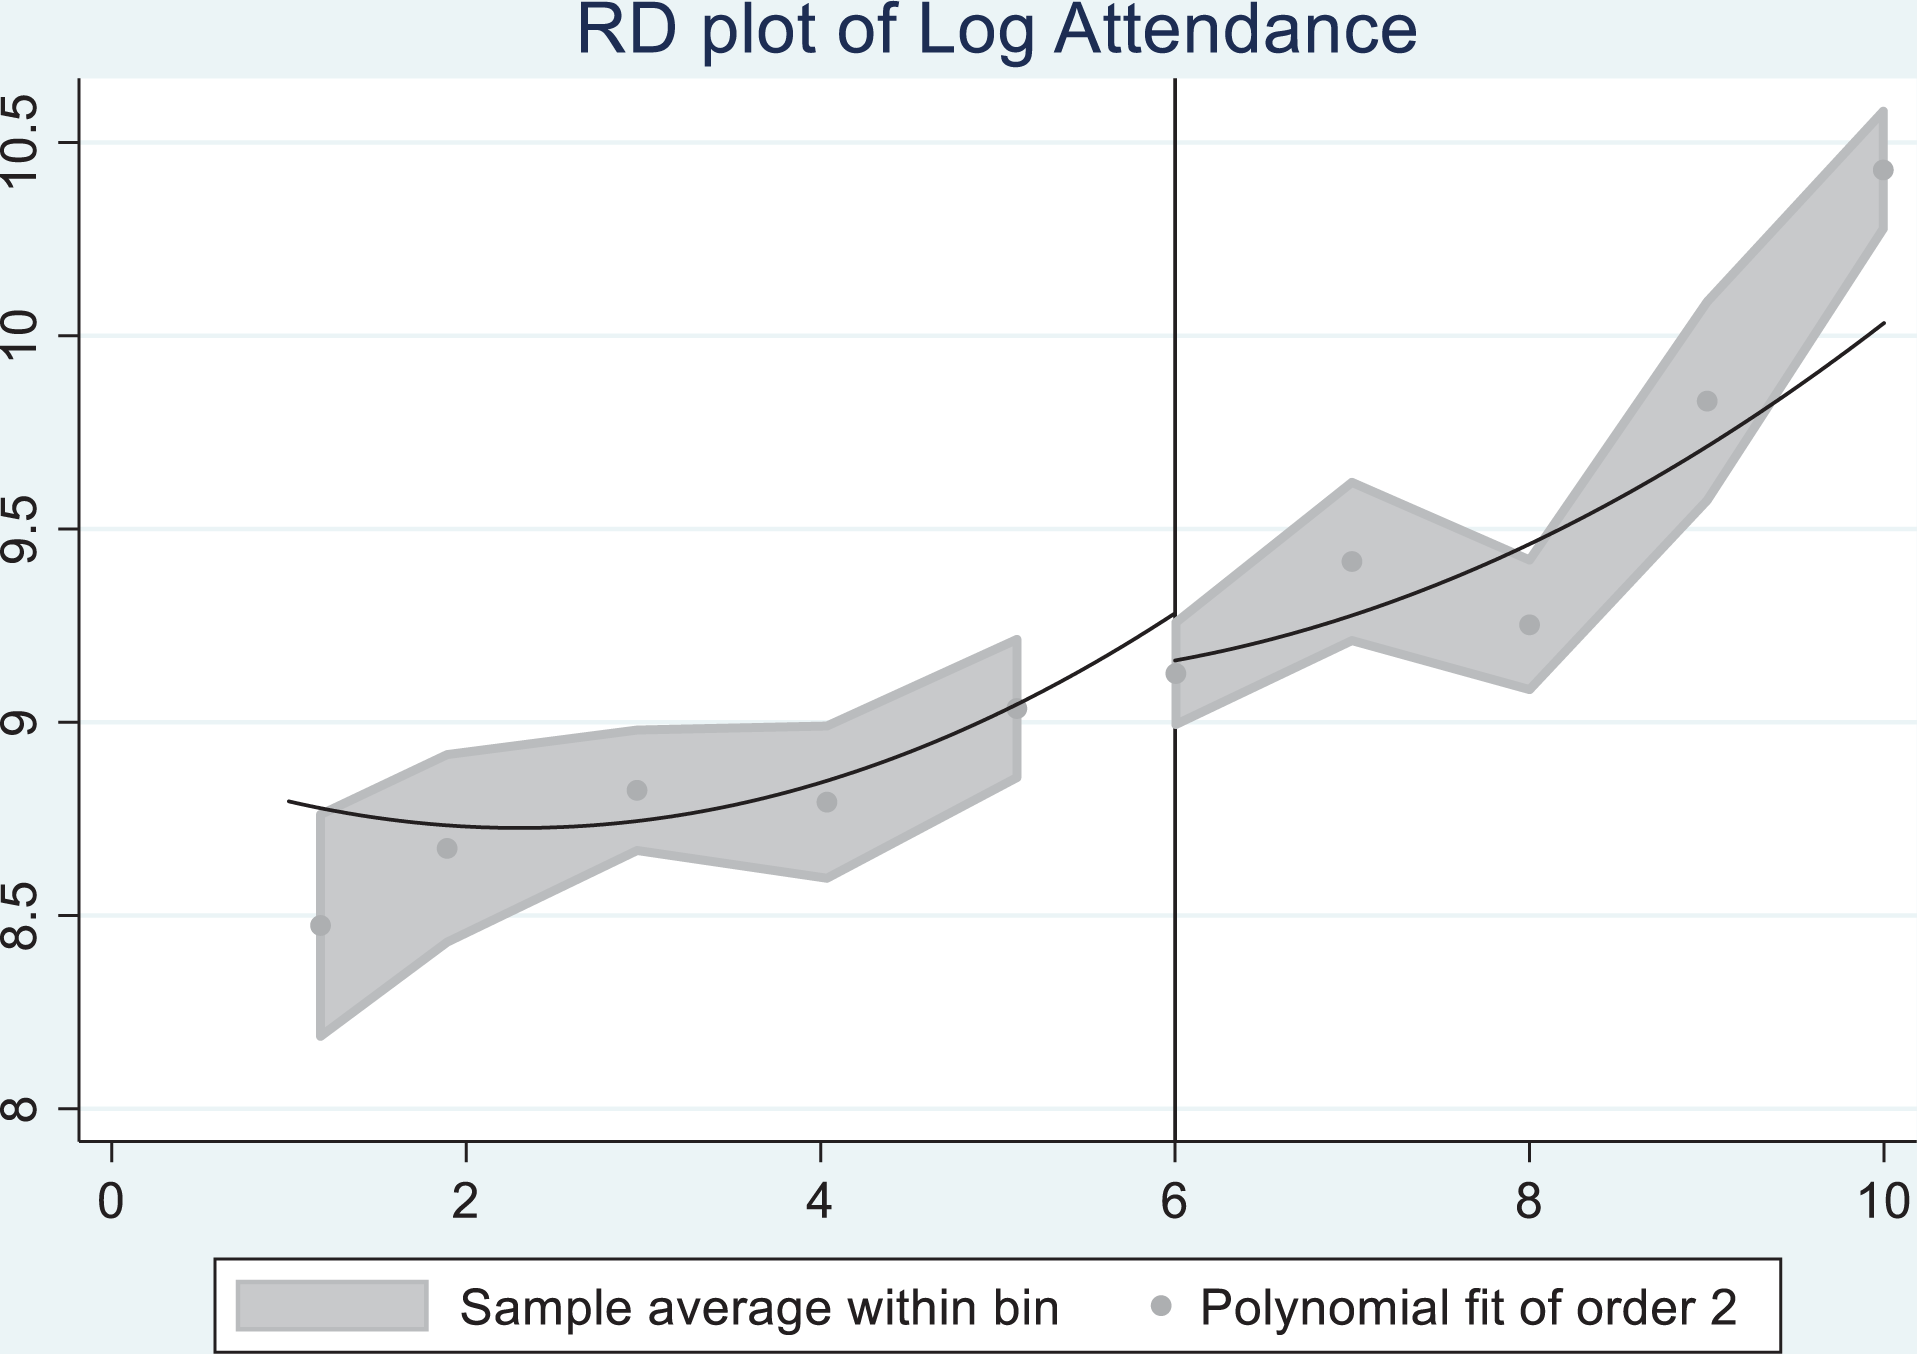
If we assume the bottom placed team is ranked 1 and the top 10, the artificial “split” occurs at league position 6. Figure 6 graphs the RD plot for the log attendance data using the cases for the 10-team league format. The plot reveals no clear evidence of a discontinuity at the artificially determined threshold. However, this exercise is not entirely comparable to what actually occurs under the actual “split.” Therefore, as a further exercise, an RD plot using only the attendance data for fixtures involving opponents from within the same artificially constructed mini-league sections is conducted. This reduces the sample size to 163 fixtures. Figure 7 graphs the relevant RD plot. Again, there is no evidence of a discontinuity at the specified threshold. Thus, the graphical evidence of a sharp upward shift in log attendance at the threshold, as evidenced in Figure 2 for the actual “split,” is absent from Figures 6 and 7 when an artificial “split” is imposed on the data for the 19 seasons prior to the reform.
Regression discontinuity plot for log attendance with fake “Split” in Space.
Regression discontinuity plot for log attendance for fake “Split” in Time.
Regression discontinuity plot for placebo in time (Seasons 1981/2 to 1999/2000). Note. The league rankings are 1 for the bottom placed team and 10 for the top placed team. The plots are based on the 350 fixtures that occurred in the last five rounds of matches over the 1981/2 to 1999/2000 seasons where the league comprised a 10-team format. The vertical line is the cut-point or threshold and represents league placing 6. The shaded areas represent the 95% confidence interval.
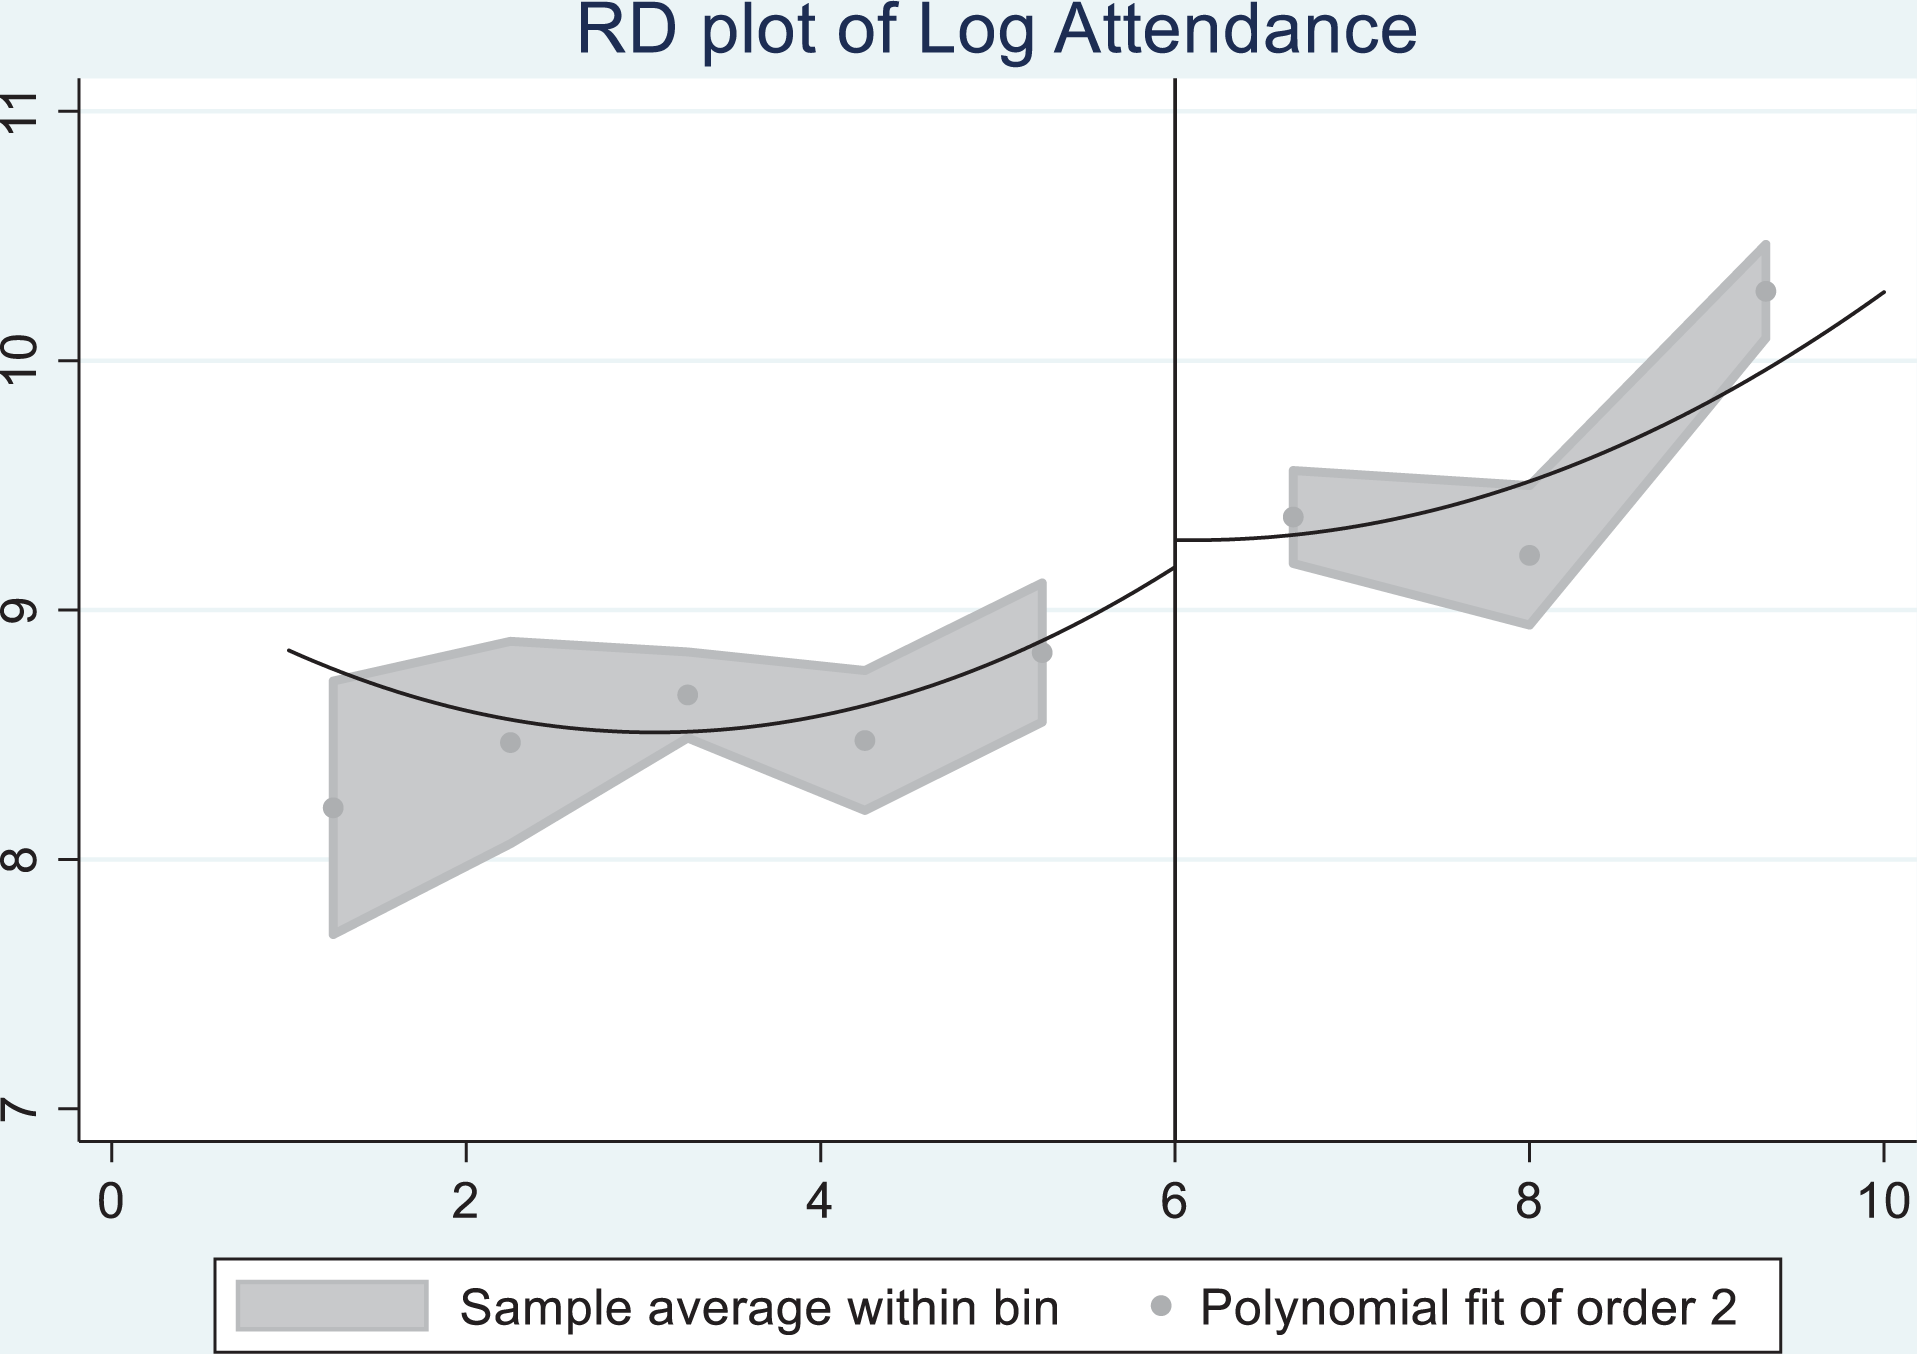
Regression discontinuity plot for placebo in time (subset of matches). Note. The league rankings are 1 for the bottom placed team and 10 for the top placed team. The plots are based on the 163 fixtures that occurred in the last five rounds of matches over the 1981/2 to 1999/2000 seasons where the league comprised a 10-team format. The matches comprise those where teams from the artificially constructed mini-leagues compete against those teams in the same artificial mini-league. The vertical line is the cut-point or threshold and represents league placing 6. The shaded areas represent the 95% confidence interval.
The theme can be explored more systematically using regression analysis, which enables the use of the full 500 fixtures covering both 10-team and 12-team league formats. Using a global parametric approach of the type described in [2] above, a log attendance equation with controls for the natural logarithm of distance between the competing teams’ stadia, whether or not the match was a derby game, whether or not it was a mid-week fixture, the league position of the opposition side at the “split,” 18 season dummies, and 20 club-specific fixed effects is estimated. The summary statistics for the sample are contained in Table A1 of the Appendix.
The weighted OLS estimates are reported in column 1 of Table 7. Although the estimates for three of the four demand determining covariates are found to be well determined, only the estimated quadratic effect for the “forcing” variable to the right of the threshold yields statistical significance. The key spectator attendance effect for the “split” is found to be poorly determined, which is consistent with the visual findings of Figures 6 and 7 above. In addition, if we restrict analysis to only those fixtures where teams from the same mini-league sections compete against each other, a statistically insignificant t-ratio of 0.99 for the relevant effect emerges. Again, this is consonant with the visual characteristics of the RD plots discussed earlier. The analysis suggests that if we impose an artificial “split” using data for the 19 seasons prior to the introduction of the league “split” format, no meaningful effects on attendance for teams in the neighborhood of the artificial “split” are detected.
In summary, the three placebo/falsification checks provide corroborative evidence that the “split” league format, now an institutionalized feature of Scotland’s top professional tier, exerts an impact on spectator attendance that appears absent when using (i) rankings within the league well above the “split” (ii) rounds prior to the “split,” and (iii) seasons prior to the introduction of the “split.” These falsification tests suggest the jump in attendance observed at the “split” does not appear to have occurred purely by chance.
Weighted OLS Regression Discontinuity Placebo for Artificial League “Split” Pre-Reform.
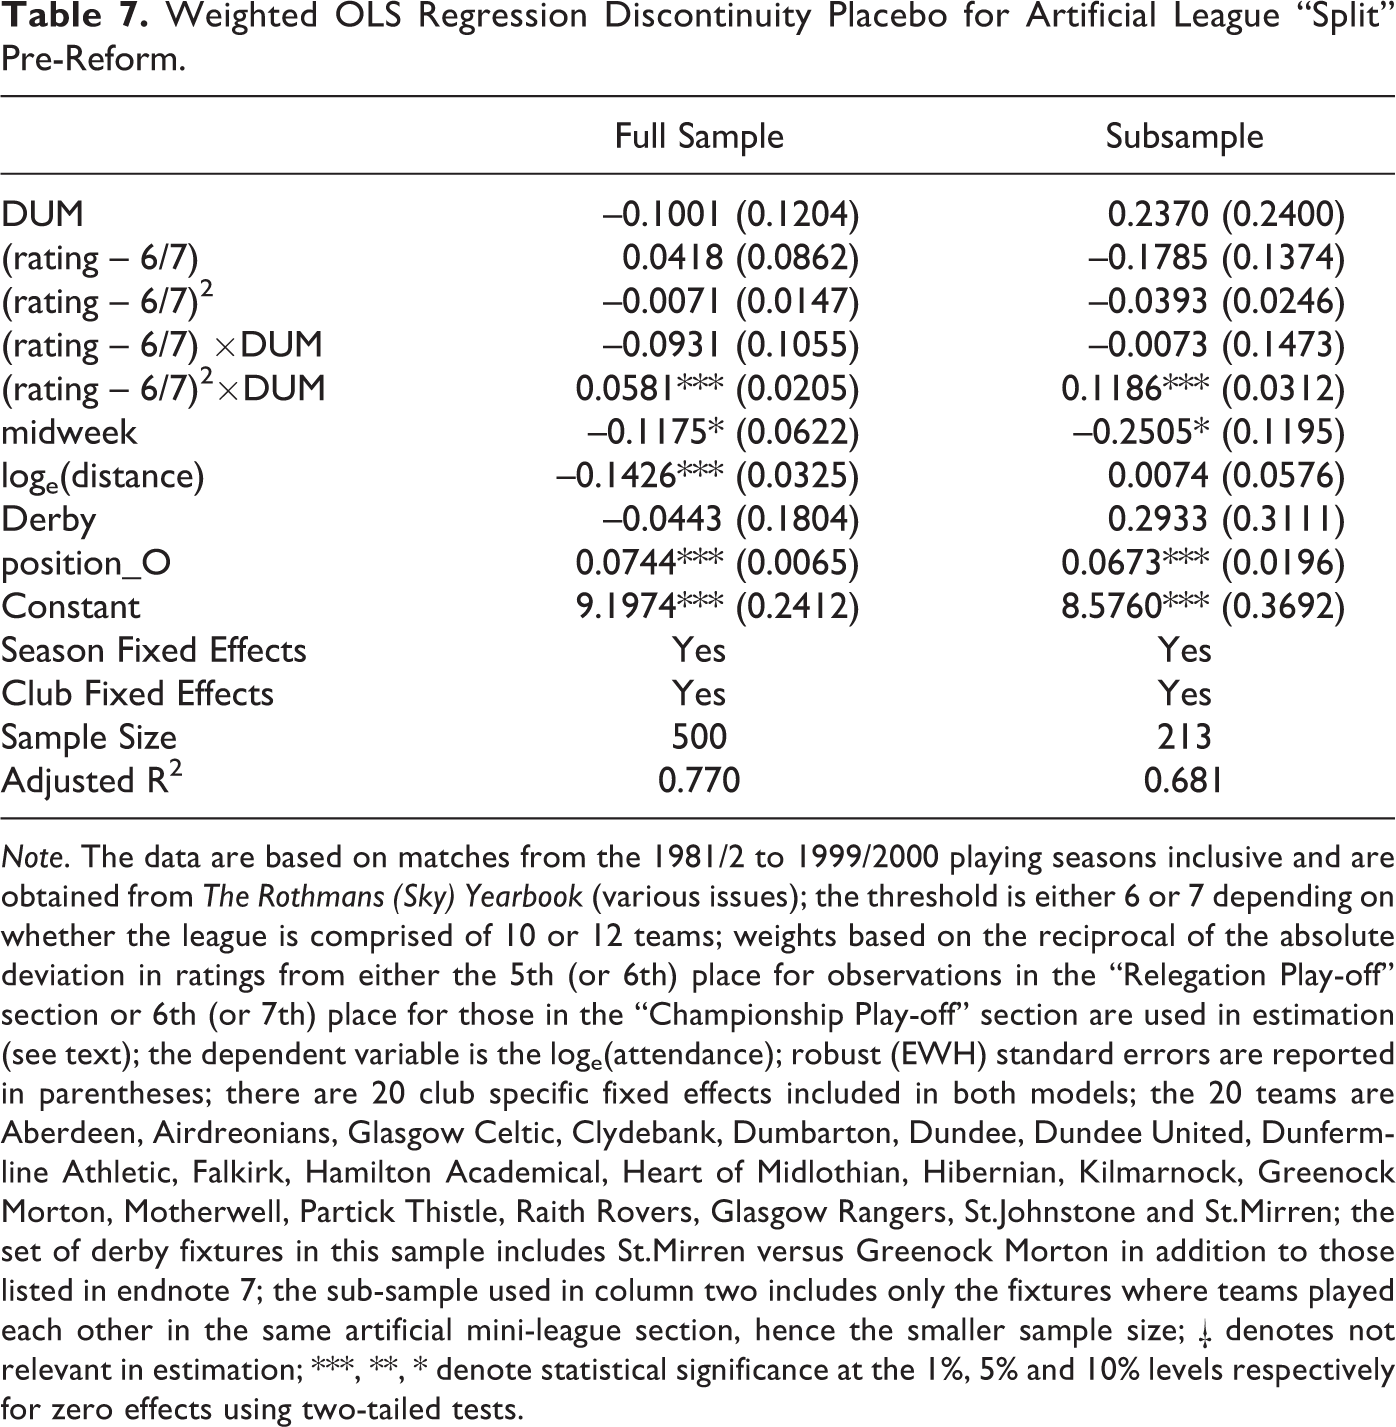
Note. The data are based on matches from the 1981/2 to 1999/2000 playing seasons inclusive and are obtained from The Rothmans (Sky) Yearbook (various issues); the threshold is either 6 or 7 depending on whether the league is comprised of 10 or 12 teams; weights based on the reciprocal of the absolute deviation in ratings from either the 5th (or 6th) place for observations in the “Relegation Play-off” section or 6th (or 7th) place for those in the “Championship Play-off” section are used in estimation (see text); the dependent variable is the loge(attendance); robust (EWH) standard errors are reported in parentheses; there are 20 club specific fixed effects included in both models; the 20 teams are Aberdeen, Airdreonians, Glasgow Celtic, Clydebank, Dumbarton, Dundee, Dundee United, Dunfermline Athletic, Falkirk, Hamilton Academical, Heart of Midlothian, Hibernian, Kilmarnock, Greenock Morton, Motherwell, Partick Thistle, Raith Rovers, Glasgow Rangers, St.Johnstone and St.Mirren; the set of derby fixtures in this sample includes St.Mirren versus Greenock Morton in addition to those listed in endnote 7; the sub-sample used in column two includes only the fixtures where teams played each other in the same artificial mini-league section, hence the smaller sample size; † denotes not relevant in estimation; ***, **, * denote statistical significance at the 1%, 5% and 10% levels respectively for zero effects using two-tailed tests.
As a fourth robustness check, we re-conceptualize the RDD approach and use the round of the match as the “forcing” variable at the “split” rather than the league placing. The treatment is now defined as whether or not the match occurs within the final five rounds of fixtures in a season. Identification is now based on a discontinuity in time rather than in league placings. The estimated effect at the threshold captures whether there is an immediate impact on league attendance just after the league “split.” We estimate specifications comparable to [1] and [2] above using the complete set of 4,332 match-level observations over 19 seasons. Neither specification yields evidence of a statistically significant “jump” immediately after the “split” based on time, which is confirmed by RD plots. 14 Thus, no statistical difference in the threshold effects between games played in the 33rd (immediately pre-“split”) and those played in the 34th (immediately post-“split”) round is uncovered. This finding implies that the effect on attendance actually detected in the aftermath of the “split” is due to a team’s consignment to either of the two mini-league sections rather than to the fixture round at which the league “split” actually occurs.
The final robustness exercise uses an alternative empirical strategy to investigate the key research question. A “difference-in-difference” approach is adopted in lieu of RDD. However, for reasons discussed below, we argue it represents an inferior methodology to the RDD procedure in this application. Therefore, it is best interpreted as an informative complement to the core RDD analysis rather than a substitute for it. The approach uses data from all matches played in the Scottish Premiership since the inception of the “split” league structure in 2000/01. This comprises the same 4,332 match-level observations used for the discontinuity in time analysis immediately above. The “difference-in-difference” specification is expressed as follows:
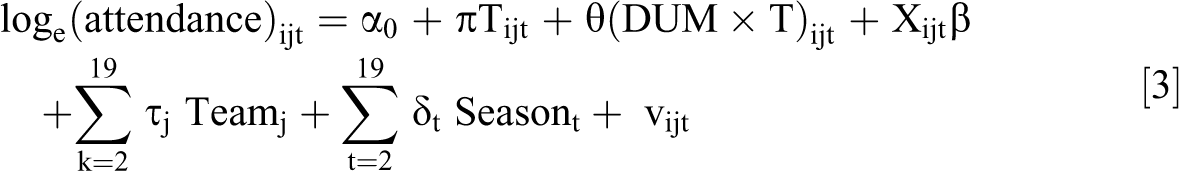
where all variables are defined as earlier but now Tijt is a dummy variable equal to 1 if the match occurs in rounds 34 to 38 of the season and 0 otherwise. In addition, vijt represents the idiosyncratic error term.
The OLS estimate
The OLS estimates for specification [3] are reported in the first column of Table 8 with corresponding summary statistics contained in Table A2 of the Appendix. The estimates for the soccer demand covariates are well determined, of similar magnitude and compatibly signed with those reported for the RDD regression models in Table 4. The “difference-in-difference” estimate for
There are two observations worthy of note in regard to this particular estimate. First, it represents an overall average effect for clubs in the top relative to the bottom section and does not capture the local effect for those clubs within the neighborhood of the threshold, which is the estimate obtained using the RDD procedure. Thus, it is not conceptually comparable to the RDD-based estimate reported in column two of Table 4. Second, and more importantly, a key assumption for causal identification with the “difference-in-difference” procedure here is that the pre-treatment trends in attendance are common across (or parallel between) teams in the two mini-leagues. This assumption is largely unpersuasive in the current context given there is likely to be significant heterogeneity in pre-treatment trends across teams as, for example, the poorer performing teams in the first phase of 33 rounds are more vulnerable to exhibiting a downward trend in their attendance levels than other teams prior to the “split.”
15
The proposition is also extremely difficult to test convincingly. However, a suggestive approach proposed by Autor (2003) is implemented to help inform this issue. This involves interacting the treatment variable with dummies for each pre-“split” round within each season and then testing for the joint statistical significance of these interaction effects. The estimates for the augmented model containing the interactions are reported in the second column of Table 8. As anticipated, the null hypothesis of common pre-treatment trends across the two groups is decisively rejected by the data with a Wald-transformed F-test value of 3.51 ∼ F(32, 4257) obtained. This finding challenges the estimator’s internal validity and renders
Nevertheless, the regression model estimates reported in the second column of Table 8, which allow for heterogeneity in pre-treatment trend effects across the two mini-leagues, potentially provide some informative insights. For example, the estimate for
OLS Difference-in-Difference Estimates for the League “Split.”
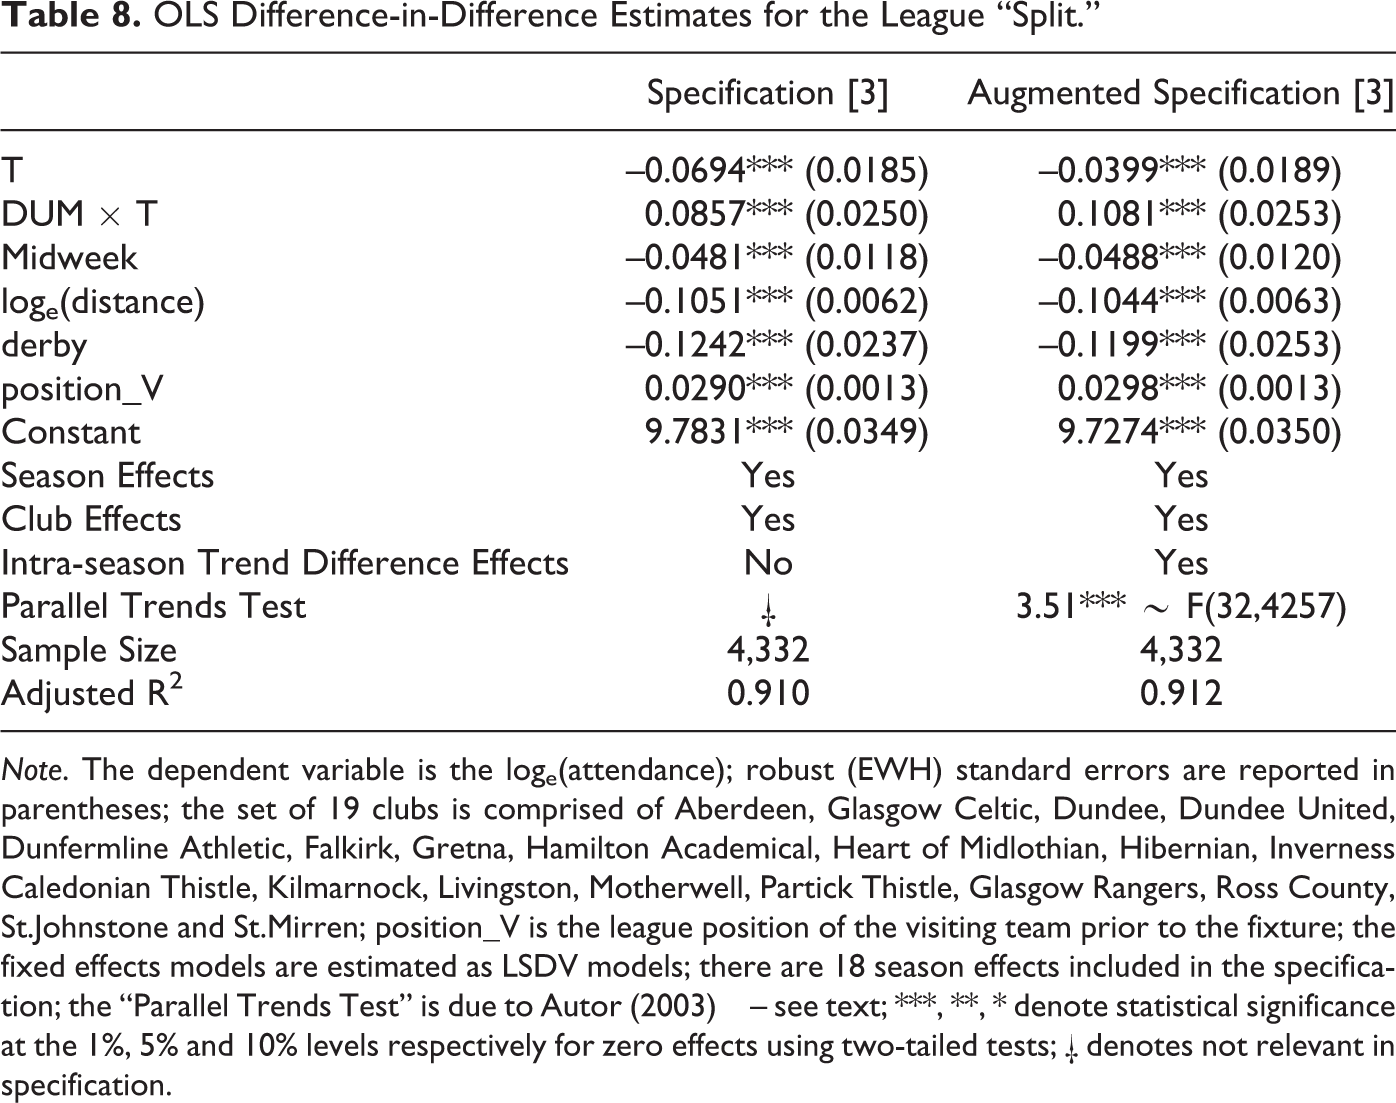
Note. The dependent variable is the loge(attendance); robust (EWH) standard errors are reported in parentheses; the set of 19 clubs is comprised of Aberdeen, Glasgow Celtic, Dundee, Dundee United, Dunfermline Athletic, Falkirk, Gretna, Hamilton Academical, Heart of Midlothian, Hibernian, Inverness Caledonian Thistle, Kilmarnock, Livingston, Motherwell, Partick Thistle, Glasgow Rangers, Ross County, St.Johnstone and St.Mirren; position_V is the league position of the visiting team prior to the fixture; the fixed effects models are estimated as LSDV models; there are 18 season effects included in the specification; the “Parallel Trends Test” is due to Autor (2003) – see text; ***, **, * denote statistical significance at the 1%, 5% and 10% levels respectively for zero effects using two-tailed tests; † denotes not relevant in specification.
In contrast to the difference-in-difference approach used in the final robustness exercise above, the regression discontinuity design possesses stronger internal validity and requires a fairly weak set of assumptions for the identification of the causal effect (see Cook et al (2008)). Hence, the stronger preference for its use in the current application. Nevertheless, RDD generally exhibits weak external validity and this issue has particular salience here. For instance, the key RDD estimate obtained only informs on outcomes germane to the sub-set of teams competing around the “split.” The more distant clubs are from the threshold in either direction, the less generalizable is the empirical finding since the significance of randomness in determining league placings is attenuated for teams either near the top or bottom end of the league at the “split.”
Concluding Remarks
The Chief Executive of the Scottish Professional Football League, summarizing the motivation for retaining the league “split,” was quoted as saying (see Forsyth (2018)):
“The split creates tight finishes top and bottom and sometimes that means helicopter finishes on the last day of the season. Ultimately the hallmarks of our game are passion, drama and excitement and the split creates that.”
This study does not assess the merits or otherwise of this statement but finds that the “split” is implicated in generating an average attendance differential of about 24% between the marginal “winners” and “losers” for the final series of home games played within this tournament design. The average loss for the club that just fails to qualify for the top section is approximately 1,500 spectators per game for home fixtures played after the “split.” 16 On average, each club plays 19 home league matches in a season and the “split” has implications for about two or three of these depending on scheduling arrangements. Thus, the foregone financial benefit for the marginal “loser” is likely to be modest when annualized over an entire playing season. A rough estimate suggests it represents, at the average, about 2.6% of total attendance within a season for the club that just fails to qualify for the “Championship Play-off” section with financial revenues approximately 1% lower as a consequence. 17 Although non-trivial, the forgone benefits are unlikely to make a radical difference to the overall financial position of the affected clubs. The actual benefits for the marginal “winners” are also modest in nature with an increase in their annual revenues in the ball-park of about 1%.
Cook and Campbell (1979) coined the term “resentful demoralization” to describe the behavior of control group patients in clinical RCTs who suffer from an allocation to their non-preferred treatment. This has some resonance here as the clubs ranked top in the bottom section are confined to a football limbo for the last five rounds of matches. Given that little meaningful is at stake in a footballing sense for these teams, dampened ardor in player and spectator interest alike is understandable. For instance, in 15 of the 19 seasons subject to analysis, the Scottish Premiership’s 7th placed team at the “split” was safe from automatic relegation and in the other four was within three points of avoiding that fate. In addition, the sample average proportion of available points won by the 7th placed team at the “split” was not statistically different between phase one (the first 33 rounds of games) and phase two (the last five rounds of games), which is somewhat surprising given, on average, the potentially weaker opposition contesting the bottom section in phase two games. Finally, no statistical difference in average attendance between the top ranked team in the “Relegation Play-off” section at the “split” and the bottom two teams actually fighting relegation was found. 18 Overall, the circumstantial evidence suggests the unluckier team at the “split” appears somewhat demotivated or “demoralized” when entering into the “business end” of the season.
The foregoing issues have not been lost on administrators in other leagues employing variants of the “split” format. In particular, the top tier leagues in Wales and Northern Ireland use a “split” format similar to that prevailing in the Scottish Premiership. However, the design incentivizes better performing teams in the bottom section after the “split” by providing an opportunity to compete with lower ranked teams from the top section in a further play-off tournament for a place in the following season’s European competition. In contrast, qualification for European club competitions in the Scottish Premiership has generally been based on a top four finish. Therefore, it may be desirable for the Scottish Premiership to consider a refinement to its existing structure that ensures the footballing interest of middle ranking teams is sustained right to the end of the season through, for example, the prospect of a European competition place as an inducement.
The existence of significant financial disparities between clubs can impair a league’s competitive balance. Such disparities are sizable within the Scottish Premiership. Nevertheless, our empirical analysis finds no persuasive statistical evidence that the “split” is likely to substantially impact the financial health of clubs through the spectator attendance channel. Therefore, it cannot be reasonably asserted that the “split” either provides a mechanism for widening or deepening financial disparities or is implicated in ossifying the well-documented long-run competitive imbalance of the league. The more adverse effects of the “split” appear to be incurred largely by the “unlucky” club that randomly falls the wrong side of the threshold rather than by the league as a whole.
Footnotes
Appendix
Acknowledgments
The authors are extremely grateful to Dennis Coates and two anonymous referees of this journal for their constructive and supportive comments. Julia Lang is thanked for research assistance and Stephen Morrow for providing information on club financial data. The authors are also grateful to Keith Sharp at the Scottish Football Association for guidance and advice. However, the usual disclaimer applies in all cases.
Declaration of Conflicting Interests
The author(s) declared no potential conflicts of interest with respect to the research, authorship, and/or publication of this article.
Funding
The author(s) received no financial support for the research, authorship, and/or publication of this article.