
Abstract
Higher rates of black mortality compared to whites in the United States are longstanding and well documented. Wide variation across racial and socioeconomic groups suggests that many deaths may be preventable. We hypothesize that higher mortality for African Americans is due to the fundamental causes of structural racism and poverty. We developed a new index, the Racial Isolation of Poverty (RIP), to examine how the race/class nexus of disadvantage is associated with higher rates of mortality for African Americans. A wide range of policies has isolated black people into areas with poorer-quality schools and fewer jobs, where over-policing substitutes for community resources. Geographic isolation by race and income has enabled sub-standard resource distribution to African Americans. Geographic isolation also allowed us to measure the effects of racism in US counties. Two main effects, Racial Isolation (RI), and the interaction of RI with economic deprivation, or RIP, were tested in a cross-sectional fixed-effects model. Both RIP and RI increased mortality for blacks while only RIP increased mortality for whites. Universal policies to promote economic security for all and reparations especially designed to promote economic security and wealth for African Americans are proposed.
Introduction
Poverty and ethnic differences are observable in many countries, but the breadth and persistence of residential segregation by race and income is a unique feature of the American physical landscape. Persistently higher rates of mortality and lower rates of life expectancy among blacks compared to whites in the United States are longstanding and well documented (Adler & Rehkopf, 2008; Kitagawa & Hauser, 1973; McCord & Freeman, 1990). Wide variation in death rates across racial and socioeconomic groups suggest that many deaths are preventable (Bosworth, 2018; Centers for Disease Control & Prevention, 2017).
A range of macro-level structural inequalities, called “upstream social determinants” in public health (Link & Phelan, 1995) and “social stressors” in sociology (Thoits, 2010), may be associated with preventable mortality. Social determinants, the conditions in which people are born, grow, live, work, age and die, are associated with health and mortality. (Office of Disease Prevention & Health Promotion, 2020). Social determinants of health are shaped by the distribution of money, power, and resources at global, national and local levels (World Health Organization, 2020). Social stressors occur when a person faces a situation without the resources to cope or handle it, for example, when income is insufficient to cover the expenses of housing, food, and medicine. When stressors (negative events, chronic strains, and traumas) are measured comprehensively, their damaging impacts on physical and mental health are substantial (Thoits, 2010).
Structural racism and poverty have been singled out by public health scholars as “fundamental causes” of disparities in health, disease, and mortality (Gee & Ford, 2011; Link & Phelan, 1995; National Academies of Sciences, 2017; Williams & Mohammed, 2013). Structural racism and poverty are fundamental to health because both have significant negative influences on a wide range of population health outcomes. Over time they become embodied in the biology of individuals and are manifested as population health inequities (Krieger, 2012). In combination, structural racism and poverty characterize communities that are encumbered by social stressors while being physically isolated from the resources and investments needed to thrive. For this paper, we developed a comprehensive index to measure social stressors in a population group --Racial Isolation of Poverty (RIP)-- to test whether residential segregation by race and poverty is associated with differences in black and white mortality rates.
Poverty is clearly defined by the US government. Data are collected by the Census Bureau, and poverty rates are reported annually by the Department of Health and Human Services (Office of the Assistant Secretary for Planning & Evaluation, 2021). While the federal government routinely collects self-reported data on race and ethnicity, it does not collect data on racism.
Residential segregation resulting from discrimination against blacks and favoritism toward whites offers a proxy measure of racism. Doug Massey calls residential segregation by race the prime example of structural racism (Massey & Denton, 1993a). John Cell analyzed the creation of racial segregation in the US South and in South Africa and identified it as the physical separation into distinctive neighborhoods and communities with the purpose of ensuring that whites are safeguarded from residential closeness to blacks (Cell, 1982). In the US, racist policies legally protected and expanded property, income, and wealth for whites and intentionally restricted access for blacks to not only property, income, and wealth; but also to most housing, neighborhoods, educational institutions, employment, and health care facilities. Historical residential segregation established one of the foundations for structural racism that lasted even after passage of Civil Rights legislation.
The growing understanding of the importance of structural racism in American life has advanced scholarship demonstrating interactions between race, poverty, geography, and health (Chen et al., 2006; Chetty et al., 2016; Hearst et al., 2008; Williams & Collins, 1999). Innovative statistical techniques and the deployment of increasingly powerful computers in data rich environment have made it possible to identify geographic variation in racism (Chae et al., 2015). There is a range of approaches to measuring racism (Aosved et al., 2009; Atkins, 2014; Carter, 2007; Singal, 2017), and no agreement on one. Some studies have found that racial segregation helps explain disparities in health outcomes (Beck et al., 2020; Williams & Collins, 2001). Few studies have examined racial segregation and mortality.
We test whether the fundamental causes of poverty and structural racism explain the persistently higher rates of mortality in the black population compared to the white population in the United States. Our study makes three contributions to the literature: it introduces a novel measure, RIP—which builds on the well-known measure of Racial Isolation (RI); it compiles existing data sources designed to quantify the effects of policies to ensure racism and poverty; and it estimates and compares the effects of these policies on black and white mortality in the United States. To our knowledge, no other paper examines the impact on mortality by race using this range and combination of contextual factors for all non-rural counties in the US.
Our novel measure, RIP, is designed to measure the social and economic stressors of prolonged insecurity in employment, housing, education and healthcare when trying to thrive and raise families in neighborhoods that are isolated by poverty and race. Social stressors have substantial damaging impacts on physical and mental health (Thoits, 2010). We hypothesize that isolating racial groups in poverty through residential segregation generates economic insecurity that damages health in the segregated population groups. Though stress due to economic insecurity may link residential segregation to differential mortality through a biological mechanism, we do not test for a biological relationship. Rather, RIP allows us to directly measure how an accumulation of social and economic stressors differentially affect mortality in black and white population groups.
We begin by examining how policies that intersect race, poverty, and place could lead to differential mortality among black and white Americans. Then we briefly turn to US history to observe who held power and the policy choices they made to structure race and class inequalities. We focus on policies that segregated black and white Americans –especially residential segregation, which paved the way for capital accumulation and wealth for White Americans, and made it nearly impossible for African Americans to accumulate capital and wealth. During the late 18th and 19th centuries, this mostly occurred in the southeastern US and was a legacy of slavery. In the 20th century, government policy segregated cities by socially isolating African Americans. Twenty-first century racism has been characterized by vicious police attacks on African Americans in poor, racially isolated neighborhoods (Hoofnagle et al., 2020) and serial housing evictions for African American women and children (Leung et al., 2021). Throughout US history, these policies have maintained residential segregation by race and class despite civil rights legislation barring racial discrimination.
Our study hypothesis is that structural racism and poverty established and maintained through policies that fostered residential segregation are associated with the persistent disparity in mortality. To test our hypothesis, we deployed an existing index and created another. This enabled us to compare results from RI alone, and from the interaction of RI with economic deprivation, the new measure that we term RIP. After presenting and interpreting regression findings, we propose policy options, including reparations, that are designed to reduce mortality disparities.
Creating Black and White Races and Provisioning and Protecting Wealth for Whites
Public health and isolation by race and class are historically intertwined in the United States. Dividing Americans into races then offering benefits only to whites while suppressing and subordinating blacks has led to disparities in health and mortality (Satcher et al., 2005; Williams & Mohammed, 2013; Racism & Health 1: Pathways and Scientific Evidence). A small number of wealthy white men have held political power and used violence to foster hierarchies based on race, wealth, and income, starting with a system of chattel slavery. Chattel slavery both created enormous wealth for the US, estimated at about US$12 to US$13 trillion in 2018 dollars (Craemer et al., 2020) that was concentrated among a few white men, and undermined potential class solidarity between other white and black Americans.
When slavery was abolished in 1865, slaves were emancipated, and reconstruction initiated. However, shortly after President Lincoln's assassination, the Johnson administration recalled federal troops and permitted former slaveowners to use violence and legislation to create new economic hierarchies based on whiteness and blackness. As Darity and Mullen explain, “The era of ‘private bondage’ had ended, but it was rapidly being replaced by a different invidious harm: public subjugation. … Now, without even the protection of their former enslavers, blacks could be subject to the accusations and whims of all whites, even white children.” (Darity & Mullen, 2020).
The Reconstruction Era ended in 1877 when the government pulled federal troops out of the states that had seceded. The plan to redistribute the vast plantation acreage to African Americans and some poor Whites was never realized. Freed slaves were not compensated for their military service and were left without means of production that would enable them to thrive and accumulate wealth for future generations. Instead, they and subsequent generations of African American citizens were prevented from voting and their property was seized. Federal, state, and local policy thwarted Black Americans’ ability to access income, wealth and capital from the Civil War until 1968, when federal civil rights legislation was passed (Darity & Mullen, 2020).
Wealth takes on particular importance in the US because the country lacks a strong social safety net. Wealth provides a safety net for individual households, families, and communities to ensure that difficulties, such as bouts of unemployment or medical bankruptcy, do not lead to long-term crises, such as loss of housing. Wealth offers choice and power to those who have it. It provides insurance in case of emergency. Should an emergency arise, those without wealth risk living in poverty with its accompanying constraints on their power and choice. Wealth can be deployed for education, as capital, or as equity to borrow money.
The racial wealth gap in the US is very large. The wealth of most Americans is in the form of home ownership. Homeownership rates were 74% for White Americans and 45% for African Americans (Table 7, currenthvspress.pdf (census.gov)). African American families’ median and mean wealth is less than 15% that of white families. Mean wealth for White and African American families is $983,400 and $142,500, respectively. Median wealth for White and African American families is $188,200 and $24,100, respectively [see Figure 1 (Bhutta et al., 2020); also see Figure 1 (McIntosh et al., 2020)]. Unequal wealth distribution by race in the US severely hampers Black American households.
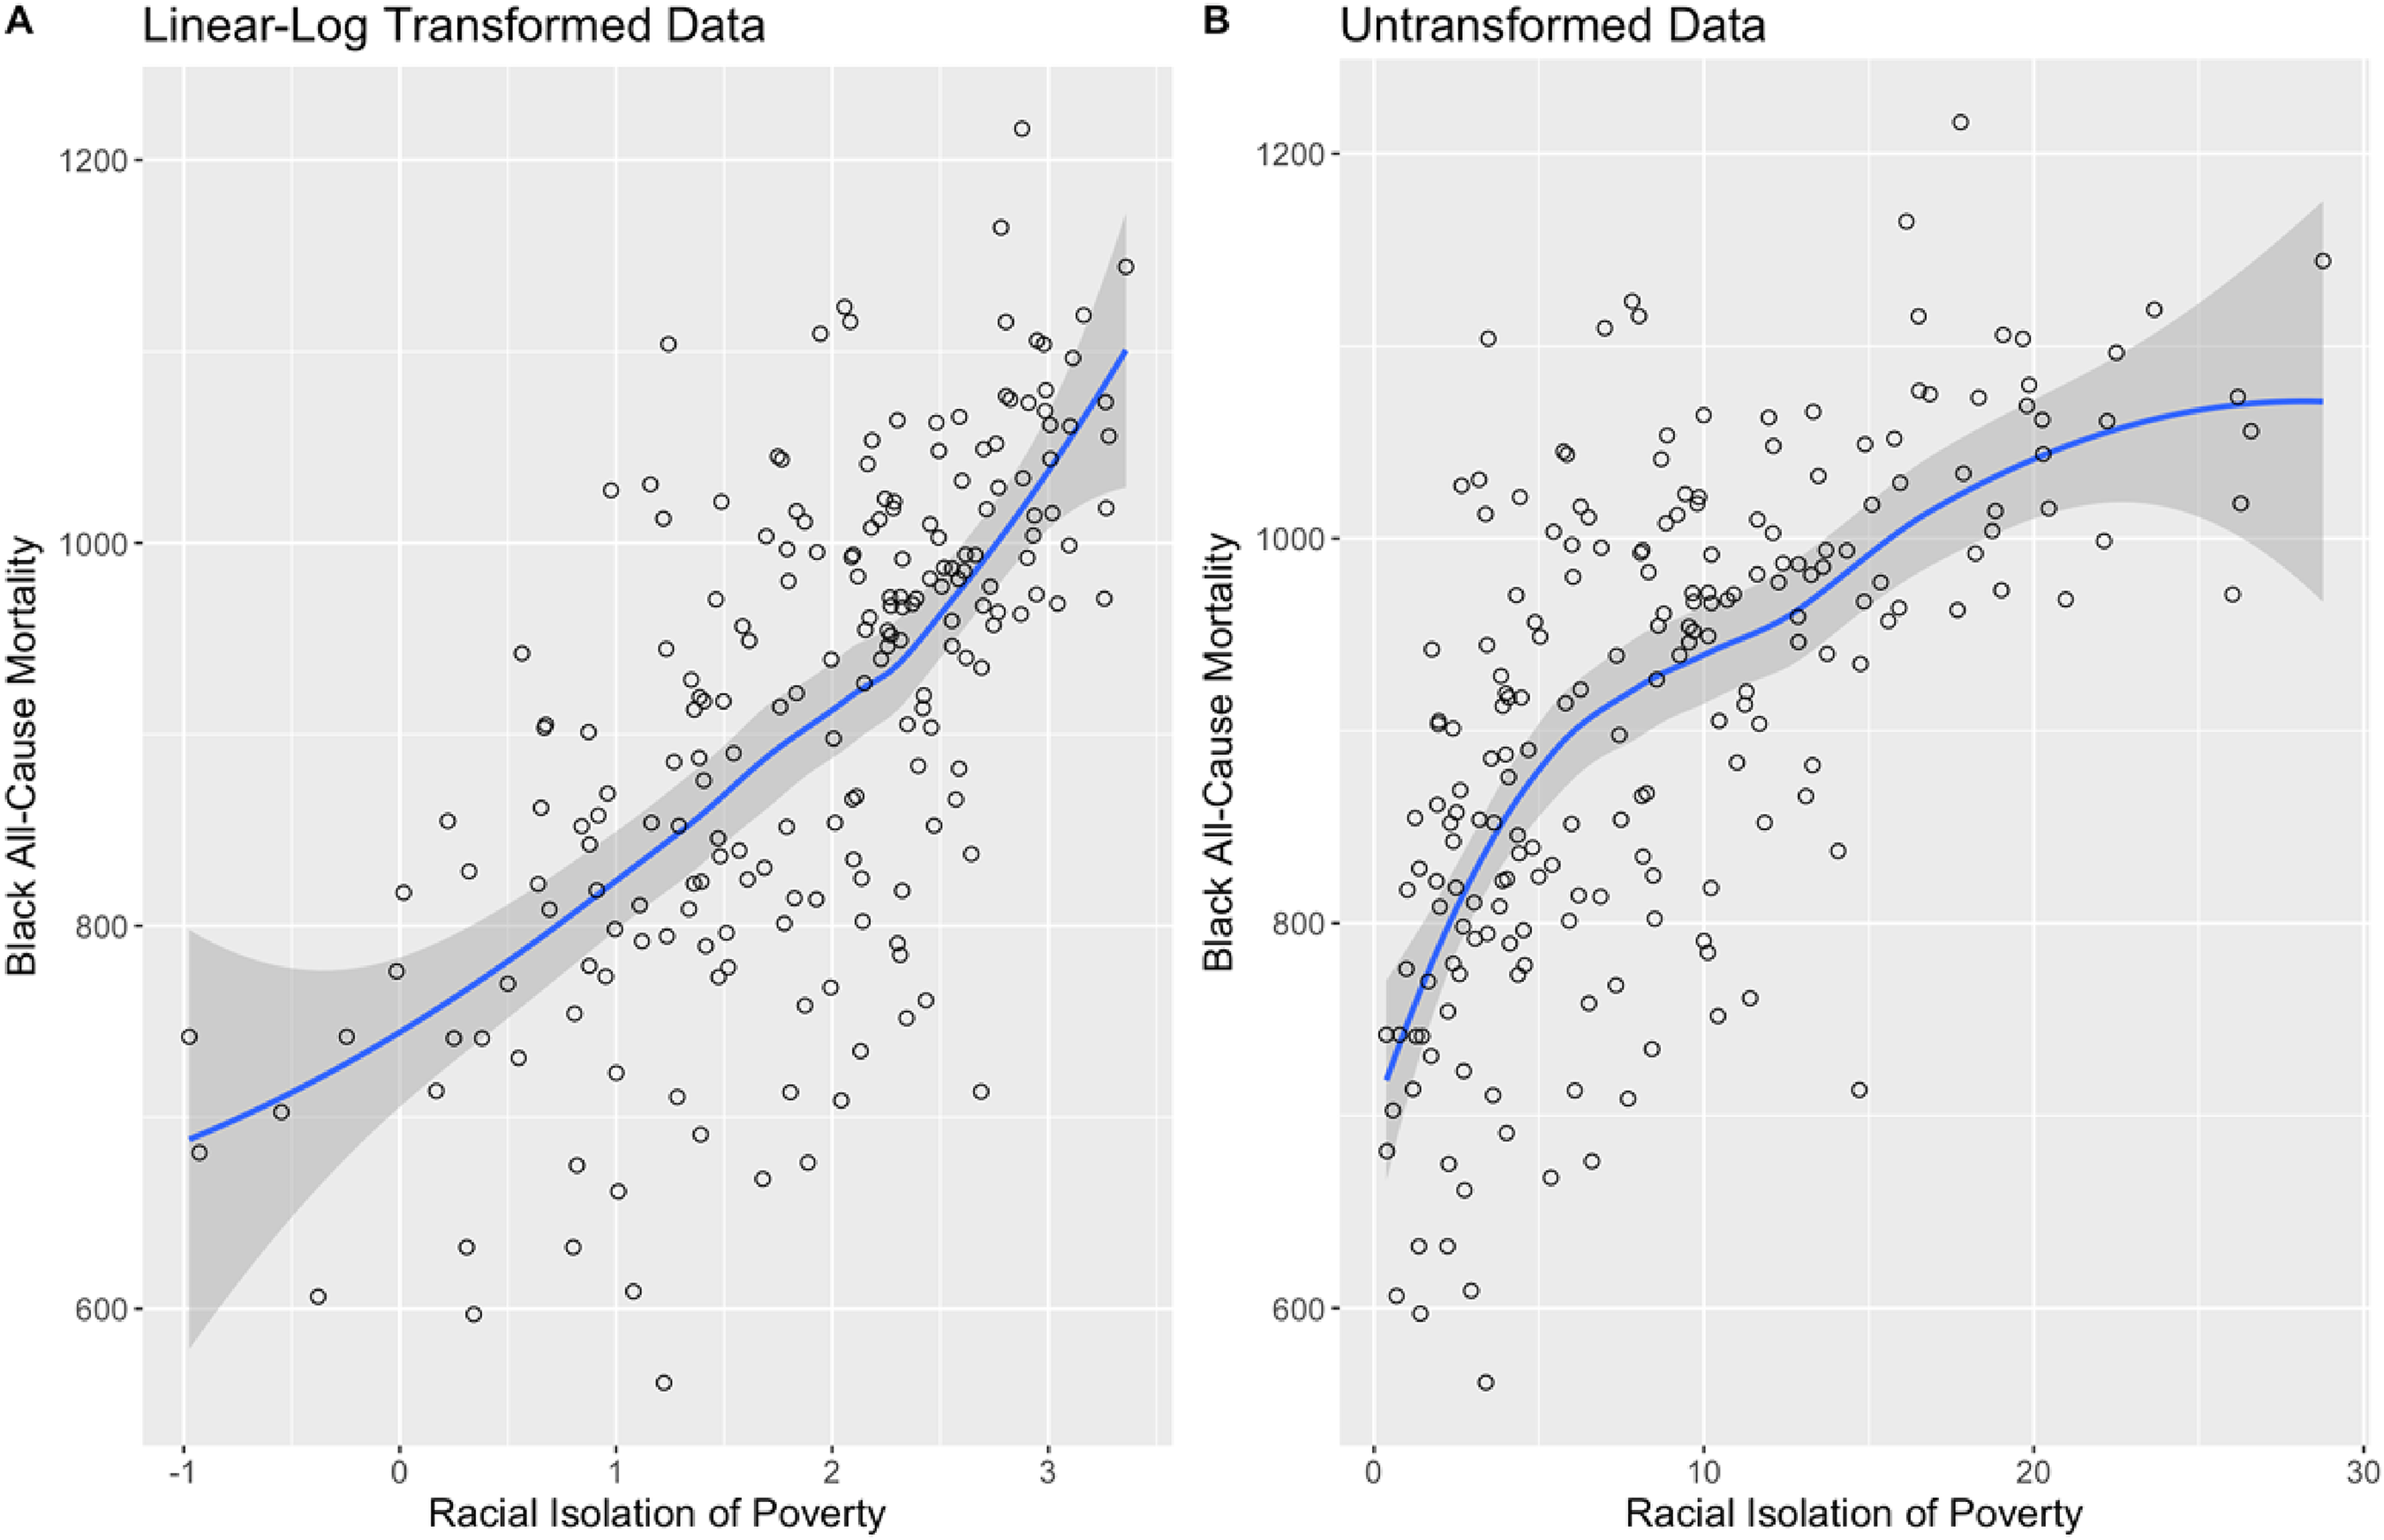
Linear-log transformation of the data.
Alongside residential segregation and racial isolation were constructed judicial and legislative policies designed to criminalize poverty and further isolate African Americans. Ferguson, Missouri, in 2014, is a prime example where the intensity of policing and a punitive judicial environment interacted to isolate and terrorize residents. Neighborhoods where police anticipate crime generates both higher arrest rates and fear of police. Living in a highly policed environment where minor infractions are swiftly punished leads to fear of jail, even fear for one's life (Rothstein, 2014).
Modern policing like what happened in Ferguson began with the War on Drugs. The War on Drugs, declared in 1971 and intensified in 1981, targeted poor African American neighborhoods. Intensification of the War on Drugs initiated three important changes to the US criminal justice system that further isolated African American neighborhoods. First, sentencing for possession of crack cocaine, relatively cheap and widely available in poor black neighborhoods, was disproportionate when compared to sentencing for the more expensive powder cocaine used by wealthy white Americans. Second, prisons for profit emerged with kickbacks for willing judges. Third, predictive policing software was developed to manage the day-to-day activities of patrol officers. These criminal justice policies generated a ten-fold increase in the number of Americans incarcerated for drug offenses from 40,900 in 1980 to 443,200 in 2018 (The Sentencing Project, 2020). Data from the War on Drugs was used when Artificial Intelligence (AI) was introduced to increase productivity and efficiency in policing (Benbouzid, 2019). Resulting algorithmic bias led to intensive policing in poor black neighborhoods and reflects pre-existing bias from social control systems that targeted blacks in the first place.
Socially isolating African Americans in poverty creates circumstances where policing efforts can be more severe, even vicious, and creates the perception that such neighborhoods have more crime and are especially dangerous. In contrast to training police to provide the mental health expertise and negotiation strategies that their work requires, American police are heavily armed, fortified with protective gear, and frequently enter racially isolated poor areas as if they were entering a war zone. Such biased policing enforces residential segregation by race and income.
Higher levels of racial residential segregation and income inequality increase the odds of a black male being killed by police compared to a white male (Johnson et al., 2019; Siegel et al., 2019). Six times as likely to be incarcerated as White men, a large number of African American men are aging in prison since the War on Drugs. A 2017 study by Shannon and colleagues estimates that 3% of the total U.S. adult population and 15% of the African American adult male population has ever been to prison. People with felony convictions account for 8% of all adults and 33% of the African American adult male population (Shannon et al., 2017). Historically circumscribed from employment, housing, education and healthcare, African Americans are incarcerated at high rates which, in many states, bar them from voting, working, or getting credit to purchase a home or start a business.
Residential segregation with social isolation by race and income and very large disparities in wealth (the social safety net for Americans) led us to test whether poverty and racism in African American neighborhoods contribute to premature mortality among African Americans. Despite decades of data and historical evidence, some economists still argue that personal preferences or poor choices explain disparities among black and white Americans. A hypothesis more consistent with the data and historic record is that policies stratifying Americans as black or white, then segregating and depriving black households and neighborhoods, enabled biased policing policies to maintain black neighborhoods in poverty, isolation, poor health and early death even after passage of civil rights legislation. We test this hypothesis in non-rural areas only because populations in rural areas are not adequately dense to reliably measure residential segregation (as described in the Data Overview section below).
Racist Zoning, Housing Policies, and Wealth Accumulation by Race
Public health and residential isolation by race and class are historically intertwined in the United States by federal, state, and local zoning policies. Zoning was introduced by urban reformers in the early twentieth century. New York's Zoning Ordinance of 1916—the first in the nation—was used to segregate land uses incompatible with public health, such as residential and high-polluting industrial uses; however, social segregation and preservation of residential neighborhoods also shaped it (Fischler, 1998). Evolving zoning laws operated to reinforce economic and racial separation. Richard Rothstein demonstrates with extensive historical evidence that policy-based de jure segregation directed against black communities began during post-Civil War reconstruction and has lasted, in practice (de facto), to the present (Rothstein, 2017).
In early 1933, Congress created the Home Owners Loan Corporation (HOLC) to provide low-interest loans for those in danger of losing their homes to foreclosure. During the Great Depression, between 1926 and 1932, the number of foreclosed homes in the United States had increased almost 250%, from 78,356 to 273,384. Between 1928 and 1933 the number of residential construction permits fell by 93 percent. The Federal Housing Administration (FHA) was created in 1934, to stimulate the house building and finance industries. The agency was constructed with little input from organized labor, housing reformers, civil rights activists, or interracial housing advocates. The real estate trade, the building industry, and financial institutions supplied the FHA with most of its personnel and guidelines, and each agreed that racial housing segregation was essential for residential districts to retain their stability and desirability (Gotham, 2000).
To implement racial housing segregation, each neighborhood in America's largest cities was graded on its perceived credit risk by federal government officials. In fact, HOLC simply embraced the existing rating system used by the National Association of Real Estate Boards, making the segregationist practices of the real estate industry official federal policy. The surveyors assigned the most restrictive credit rating -- indicated in red on the maps -- to neighborhoods with African American residents or located near African American neighborhoods. Nearly 90 percent of African Americans in 1940 lived in a census tract marked for credit redlining. Banks undervalued and limited loans to redlined areas (Gotham, 2000). Redlining policies abetted the creation of slum housing for millions of black people who migrated North and West to meet the surge in demand for labor for World War II.
Redlining policies are illegal; however, their legacy survives. Urban scholar and activist Jane Jacobs wrote in The Death and Life of Great American Cities that credit blacklisting maps are self-fulfilling prophecies (Jacobs, 1992). To test Jacobs’ hypothesis, economist Jacob Krimmel compared neighborhoods with credit-restricted "redlined" census tracts to adjacent "yellow-lined" tracts. His study confirmed that tying credit risk to neighborhood boundaries impacted whether and where homes were built. When redlining was legal, home building and housing durability in yellow graded areas far exceeded that in adjacent redlined areas. After redlining was formally outlawed in 1977 with passage of the Community Reinvestment Act, the discontinuities persisted (Krimmel, 2018). Lack of federally insured loans in redlined districts led to less housing construction, overcrowding, and lack of commercial investment in black neighborhoods even after housing discrimination based on race became illegal. In sum, redlining structured investment disparities in housing that would shape the location of employment, schools, and healthcare facilities and it still cripples investment in black neighborhoods today.
Housing projects built by the federal government to address the housing shortage after World War II exacerbated the wealth gap and isolation for black Americans. World War II veterans were offered federally insured, low-interest, long-term loans to purchase housing in new suburbs; however, the VA insured mortgages in neighborhoods with racial restrictions that locked out black veterans. Loans for suburban development, introduced in 1965 by the federal Department of Housing and Urban Development, included the caveat that housing would be available to white owners and renters only, or the loan would be revoked (Rothstein, 2017).
The Fair Housing Act, passed in 1968, banned residential discrimination in a range of housing-related matters, including sales and rentals on the basis of race, color, religion, sex, national origin, familial status and disability. However, enforcement was inconsistent across local jurisdictions (US Government Accountability Office, 2010). Black isolation indices hardly changed from 1970–1990 (Massey, 2001; Massey & Denton, 1993b) and the laws had little impact on reducing segregation (Dreier et al., 2014). Courts decided that once the law was changed and the initial damages claimed by people who sued at the time were resolved, de jure racism was legally over. Subsequent racism, they ruled, was de facto and outside the scope of the court (Rothstein, 2017). In short, the courts were very quick to cut the causal chain, failing to recognize path dependency and the enduring structural effects that continue to promote social isolation of impoverished neighborhoods (personal correspondence with Scott Burris, 2019).
After passage of the Fair Housing Act, race-based segregation slowly declined, but economic segregation increased (Putnam, 2016), largely through exclusionary zoning. Sean Reardon and Kendra Bischoff found that the proportion of families living in rich or poor (as opposed to middle-class) neighborhoods more than doubled since 1970, from 15 percent in 1970 to 34 percent in 2012 (Reardon & Bischoff, 2016). Exclusionary zoning restricts certain types of development such as multifamily housing construction, and establishes stringent standards, such as minimum lot sizes, housing square footage, and height limits. Exclusionary zoning has the effect of maintaining high housing prices in wealthier communities while restricting entry to lower-income families. Once in place, the laws tend to be self-reinforcing because households in a community with single-family zoning view efforts to incorporate more affordable multifamily housing as a threat to their property values and oppose such efforts (Fischel, 1999). By excluding low-income residents, exclusionary zoning discriminates against black people due to their lower incomes and less wealth accumulation (Oliver & Shapiro, 2006). By the 2010s, exclusionary zoning ordinances were standard in almost all US communities. Because discrimination in the form of exclusionary zoning laws is not explicitly based on race, it remains lawful in most states (Kahlenberg, 2017).
After the Fair Housing Act prohibited race-based housing discrimination, zoning laws were used to prevent most African Americans from moving into more affluent, white neighborhoods. Federal and local government policies socially engineered racial segregation through the first two thirds of the twentieth century using tools of racial zoning, racially restrictive covenants, FHA redlining, and police tolerance of white mob violence. Still, from 2012–2016, property values were lower where a majority of residents are African American than in comparable neighborhoods where a majority of residents are White (Perry et al., 2018). With exclusionary zoning, Richard Kahlenberg contends, “we are substituting Jim Crow by race with Jim Crow by income” (Kahlenberg, 2017).
In summary, segregation by race/ethnicity and income has been used in the US to geographically isolate population groups into wealthy –largely White-- enclaves or sub-standard –largely African American-- living conditions. By hoarding resources into wealthier enclaves while restricting resources from poor areas, federal, state and local governments and the for-profit sector have deprived African American neighborhoods of affordable housing, quality schools, well-paid jobs with health insurance and retirement benefits, nearby healthcare services, and has targeted them for over-policing (Raphling, 2019). These sub-standard living conditions expose whole neighborhoods to greater uncertainty, conflict, and threats without providing adequate resources to effectively respond. We posit that constant exposure to these stressors gets embodied in poor health and premature mortality.
Racial Isolation (RI) and Racial Isolation of Poverty (RIP)
To test our study hypothesis, we used two indices to capture the impacts of structural racism and structural racism combined with poverty. For this analysis, we use a standard index of RI initially introduced by Bell (Bell, 1954) and later promoted by Lieberson (Lieberson, 1980, 1981). We build on the logic of this measure to develop the RIP index. We measure and compare the associations of these indices with premature mortality in each race group. The RI measures structural racism alone for African Americans and for Whites. The RIP measures structural racism in the context of racially homogeneous neighborhood poverty. To our knowledge, no other study examines and compares the impact of these fundamental causes on mortality in this way.
RI and RI in combination with economic deprivation, RIP, are our main variables of interest. Our assumption is that living in racially homogeneous, resource-deprived neighborhoods with over-policing constitutes chronic exposure to stress. The logic is as follows: exposure to stressors from poverty and structural racism, especially within the context of racially homogeneous concentrations of poverty exerts long-term effects over time that generate negative health outcomes (Danese & McEwen, 2012), including mortality (Greenwood et al., 1996). In short, RIP is designed to measures the range of social determinants/social stressors that generate negative health outcomes. Because it captures this complexity in a single index, the RIP is a useful proxy measure. We know social stressors are unequally distributed between White and African Americans. Our question is whether they affect premature mortality. Using RI and RIP allows us to investigate the importance of racial isolation alone as a predictor of premature mortality in comparison with racial isolation occurring jointly with racially homogeneous poverty. If RI and RIP help explain black-white disparities in mortality, subsequent researchers can use these indices to identify locations where structural interventions are needed to reduce disparities in mortality. Case studies can be used to understand context, identify specific causes, and design and deploy appropriate interventions (Breen et al., 2019; Roldos & Breen, 2021).
Data and Methods
Overview
Our study examines black and white populations in US non-rural counties in 2010. The analysis uses a cross-sectional design with the unit of analysis being the county. Our measures are based on county-level data tabulated by race. Counties are widely used as relevant spatial-social contexts in health research and are the macro units in this analysis, provided they meet the specified case selection criteria. “Full count” data are used to calculate measures for population and mortality from the US decennial census of population and from US Vital Statistics, respectively. Other county-level measures are calculated using sample data from the American Community Survey (ACS) or other sources (as noted below).
The US population is very unequally dispersed across counties and many counties have small populations. Urban areas comprise only 3 percent of the entire land area of the country but are home to more than 80 percent of the population. Conversely, 97 percent of the country's land mass is rural but only 19.3 percent of the population lives there (America Counts Staff, 2017). Every non rural county in the United States with a sufficiently large population to sustain valid, reliable measurements of mortality and segregation was included in our study. Rural areas are not included and, consequently, only a small proportion of US counties were included. Screening on county population size is necessary to obtain reliable mortality estimates and to ensure valid and reliable segregation index scores for RI and RIP, our main variables of interest. The purpose of establishing reliability and validity is to ensure that data are sound and replicable, and that results are accurate. Regarding mortality measures, mortality rates for counties with small populations yield unreliable point estimates when the counties are too sparsely populated. Specifically, rates for counties with small populations vary greatly year-to-year due simply by chance; it is common for a rate in a sparsely populated county to be high one year and then low the very next year due solely to the large role random factors play in determining the point-in-time (cross-section) measured rate in a small population. Random factors have less impact on rates in large populations because the intrinsic underlying propensity is expressed over a larger number of units. Additionally, local incidence of any particular cause of death is subject to inherently high volatility in small populations even when the underlying “true” mortality rate is constant. The issue is well known in demography and public health, and a large literature on small area estimation uses a variety of advanced methods e.g., using multilevel models to obtain empirical Bayes estimates of rates to improve estimates (Ghosh & Rao, 1994). However, in our analysis, Bayesian methods only can help with the dependent variable. They cannot solve the problem that key independent variables in our analysis - RIP in particular—cannot be measured in rural areas because Census data on poverty are not available at the block level (which is further described in the next paragraph). Therefore, in the present study we adopt the option of restricting the analysis sample to include only counties for which rates are reliable.
Regarding segregation measurement, it is not possible to obtain valid and reliable segregation index scores for rural counties due to lack of relevant data. Census tracts typically contain 6,000–8,000 people. As a result, most rural counties have only 1–3 census tracts and most rural towns are entirely inside one single census tract. Reliable measurement of RI and RIP would require having data from full count tabulations for race by poverty status for small spatial units such as census blocks (Allen & Turner, 2012; Litcher et al., 2010; Litcher et al., 2016). But the poverty data used to calculate the RIP measure is not available for census blocks. Consequently, segregation cannot be measured using census tract data in rural areas. Thus, segregation by poverty cannot be studied in rural areas using census data. Since the requisite data are not available from any source, it is not feasible to calculate valid, reliable index scores for measures of racial isolation and RIP for rural counties.
The problem is that in 2010, tabulations of race by poverty status for subareas within counties are available only from the ACS. The ACS surveys only 1% of the population each year. This sample rate is too small to sustain reliable estimates of population counts for small areas. Accordingly, the US Census Bureau only publishes ACS-based tabulations of race by poverty status for small subareas within counties in five-year summary files. These data are inadequate in two ways. First, estimates of group counts are unreliable due to being based on very small samples. Second, the estimates are only available for spatial units that are too large to sustain segregation analysis in rural areas. Consequently, the margins of error reported by the Census Bureau for ACS-based estimates of group counts for small areas are very large and this sampling variation produces unacceptable levels of error in index scores.
Additionally, the smallest spatial units for ACS-based race by poverty tabulations are census block groups. These units are too large to capture segregation in rural areas (Allen & Turner, 2012; Litcher et al., 2010; Litcher et al., 2016). In general, at least 30–50 spatial units are needed to accurately capture group differences in spatial distribution (Fossett, 2017). This requirement cannot be met when using data for block groups. Out of 1,350 nonmetropolitan counties in 2010, only 5% had 30 or more block groups and fully 67% had only 15 or fewer block groups due to the unequal dispersion of the US population. Study data encompasses counties in every state except Alaska and Wyoming where no counties met the case selection criteria. Accordingly, empirical studies of segregation in rural areas use data for census blocks. But the ACS does not tabulate poverty data for census blocks. Therefore, it is simply not possible to obtain valid, reliable measures of racial isolation of poverty for rural counties. This is regrettable. But recall that 80% of Americans live in urban areas (US Census, 2010).
While the macro units (counties) in the analysis can be described as a population of units meeting the specified case selection criteria, the values on the dependent variable vary over time for both systematic and random reasons. Thus, it is conventional to view a cross-section of measures for macro units as a point-in-time “sample” of the underlying outcomes one will observe for these units over time. Based on this perspective, one would employ usual methods of statistical inference. We present statistical tests to be conservative and satisfy this more conventional view. Readers are free to ignore the statistical tests and interpret the coefficients as population parameters rather than sample estimates. A threshold of at least twenty deaths must have been recorded during the period of observation to compute what the NCHS considers to be a reliable death rate (US Department of Health & Human Services, 2021).
Sample data from the ACS, Small Area Income and Poverty Estimates (SAIPE), and all crimes reported in the FBI Uniform Crime Reporting Program (FBI) were used to measure county-level socio-economic variables. RI and RIP were computed using the relevant ACS 5-year summary file for 2008–2012 (hereafter simply ACS), which has 2010 as the midpoint of the 5-year period. These measures are based on data for persons or households in non-rural US counties. Of the approximately 1700 counties considered for this study, 307 met the NCHS threshold for the white population, and 203 met this threshold for the black population. The numbers reflect the fact that only a subset of counties have white and black populations that can sustain reliable measurement of all variables used in the analysis. Rates, including mortality rates, were computed using the specific content data for the numerator and ACS estimates for the denominator.
In addition to RI and RIP, the main variables of interest, our model includes controls for specific county-level social stressors expected to explain differential mortality by race: percent of residents living at or below poverty (SAIPE, ACS), the percent of renters in the county spending 30% or more of household income on housing (ACS), county arrest rates/10,000 population (FBI), size of non-institutionalized population older than 16 (ACS), and employment population ratio (i.e., percent of adult population who are either employed or unemployed (ACS).
Measures of Mortality
Full count mortality data for the years 2008–2012 from the National Center for Health Statistics (NCHS) at the Centers for Disease Control and Prevention (CDC) were used to calculate the dependent variables. NCHS captures all deaths from all causes across every state in the nation (US Department of Health & Human Services, 2018). Mortality data are from the Underlying Cause of Death 1999–2016 CDC WONDER Online Database released December 2017 (Centers for Disease Control & Prevention, 2020). Deaths among residents of non-rural counties were extracted and pooled for the years 2008–2012 and expressed as county-level death rates age-adjusted to the 2000 U.S. standard population (Ahmad et al., 2001). Separate age-adjusted death rates were calculated for non-Hispanic white and non-Hispanic black populations at the county level. Death rates were calculated for 1) all underlying causes of death, 2) heart disease listed as the underlying cause of death (World Health Organization, 2019a), and 3) preventable cancer (colorectal, lung, breast, cervical, or melanoma) listed as the underlying cause of death (World Health Organization, 2019b).
Heart disease and preventable cancers were examined separately. Heart disease because it is the leading cause of death in the US and the relationship between psychosocial stress and heart disease is well defined (Nabi et al., 2013). In short, much heart disease is preventable (Weir et al., 2016). Preventable cancers were examined because, the five preventable cancer sites account for the vast majority of cancer mortality, all have effective screening modalities, and mortality for these cancers is strongly associated with access to preventive and therapeutic health care services (National Cancer Institute, 2020). Moreover, stress makes the human body more susceptible to cancer (Heid, 2014; Reiche et al., 2004).
Measures of Economic and Social Stressors
Four county-level socio-economic stressors are measured: race-specific housing burden rate, total arrest rate, race-specific employment population ratio, and the poverty rate.
Race-specific housing burden
Housing stability and affordability are strongly related to health (Walker, 2010). We use the conventional definition of housing burden: spending 30% or more of household income on housing (i.e., ratio greater than 0.3 of total income). Housing burden is computed separately for black and white households. Housing burden rates are defined as the estimated proportion of black or white households experiencing housing burden within a given county. The housing burden rate is estimated from the ACS as a three-year average between 2009 and 2011. Total housing costs include monthly rent and utility payments for renters, and monthly mortgage, utility, property tax and insurance payments for owners. Total household income includes combined monthly income for all members of the household.
Housing burden is related to financial stability and wealth because relatively few households, especially black households, have sufficient liquid assets to cover even one month's worth of housing payments in case of an economic emergency such as job loss or sudden illness. With only 15% of the average wealth of white households, black households are less likely to have a cushion against emergencies. Without a cushion, even a relatively minor income shock makes housing loss a very real possibility. As the housing burden increases relative to income, smaller and smaller reductions in income may lead to financial ruin and homelessness.
Housing burden is disproportionate among black households and data are available; therefore, we computed housing burdens for black households and for white households separately. While existing data does not allow researchers to measure access to savings, financial assets, or other wealth at the county level, the ratio of total monthly housing costs to household monthly income, called the housing burden, serves as a useful proxy measure of housing stability.
Total arrest rate
Across the US, policies create, preserve, and maintain white wealth, including over-policing to keep resource-deprived African American neighborhoods isolated and in their place (Nodjimbadem, 2017). The video-taped death of George Floyd in Minneapolis, Minnesota, in 2020, threw into high relief the danger that police pose to African Americans. While not designed as a measure of over-policing, the total arrest rate per 10,000 adults serves as a proxy measure of inequality and stress associated with policing and the justice system. Total arrest rates vary by race and place, with more African Americans being arrested and more arrests occurring in African American neighborhoods. Close and Mason identify the two dynamics of police objectives: 1) police seek to maximize public safety, and 2) police seek to maximize the hit rate (Close & Mason, 2007). Arrest rates seem to be a reasonable proxy for over-policing.
The prevalence of crime, the intensity of policing, and the judicial environment cannot be empirically separated: total arrest rates are used as a proxy measure of their joint effect on mortality. County arrest rates/10,000 population were compiled from the FBI's Uniform Crime Reporting Program for 2010 housed at the National Archive for Criminal Justice Data (Inter-University Consortium for Political & Social Research, 2021). Arrest rates are not consistently reported for rural or unincorporated areas (Uniform Crime Reporting Handbook (fbi.gov)). County arrest rates by race are not available. We measured total county arrest rates for urban areas.
Race-specific employment population ratio
The ratio of the total labor force to the adult population is called the Employment Population Ratio. Because it takes account of the impacts of both labor force participation and unemployment, the Employment Population Ratio is a useful summary measure when labor force participation and unemployment place countervailing pressures on employment (Donovan, 2015). Data from 2008–2012 that centered on 2010 were used to compute the Employment Population Ratio.
Employment is the primary source of income for Americans. Wage, salary, and employment disparities all favor whites. Because African Americans and Whites are segmented into different labor markets (Reich et al., 1973), black and white employment population ratios are calculated separately. Lower levels of labor force participation, and lower wages and salaries characterize the labor markets open to African Americans and contribute to chronic stress among the African American population (Brown & Gary, 1988; Diette et al., 2018; Kuehn, 2013; Laditka & Laditka, 2015).
Poverty rate
Poverty is a widely used measure, a well-known social stressor and, in the public health literature, a fundamental cause of poor health outcomes including premature mortality (Singh, 2003). We used poverty rates from the 2010 SAIPE County Level Data set, as described here: https://www.census.gov/programs-surveys/saipe/guidance/strategy.html. These county-level poverty rates are used to measure poverty as a social stressor. Higher poverty rates are stressors for those directly impacted. They also may be stressors among others who are indirectly impacted. For example, witnessing an eviction, foreclosure or arrest of neighbors or seeing neighbors beat up by police brings with it a sense of powerlessness and desperation and may lead to decline in community efficacy, and sympathetic distress. These are characteristics of social isolation in poverty.
Social Isolation Indices
Segregation is understood to be a multidimensional construct (Stearns & Logan, 1986). At least five distinct dimensions of segregation are recognized in the literature and multiple alternative measures are recognized for each of these five dimensions (Massey & Denton, 1988). The dimensions of “uneven distribution” and “social isolation” are the most widely studied and the most relevant for research on health disparities. Uneven distribution and social isolation can and do vary independently. Many would view social isolation as more directly relevant for health disparities. As we discuss in more detail below, we considered both the dissimilarity index (D) and the separation index (S) as alternative measures of uneven distribution, and we considered the RI and RIP as alternative measures of social isolation. We calculated these measures for counties using data for census tracts within each county obtained from the 2010 Decennial Census and the 2008–2012 ACS Five-Year Summary File. We found that measures of isolation were empirically superior predictors of white-black health disparities. For these reasons, we used the social isolation index in our analysis. We now briefly discuss the two dimensions of segregation and the alternative measures we considered in more detail.
Uneven distribution exists when each group's presence in individual census tracts departs from the group's presence in the county as a whole. The dissimilarity index (D, formula reviewed below) was introduced by Duncan and Duncan (Duncan & Duncan, 1955) and became the most widely used measure of this aspect of segregation. High levels of uneven distribution as measured by D indicate that whites and blacks differ on the percentage for each group that resides in tracts where proportion white matches or exceeds proportion white in the city. Importantly, high values of D do not necessarily mean that groups are physically separated and live apart from each other in different neighborhoods or even that blacks are residentially isolated from whites (Fossett, 2017; Lieberson, 1980; Massey & Denton, 1988; Stearns & Logan, 1986). This raises questions about D's relevance for health disparities. The separation index (S, formula reviewed below) is better suited for indicating when groups live in different areas of the city (Fossett, 2017; Stearns & Logan, 1986). A high value of S indicates that whites and blacks differ in their average level of residential contact with whites; the difference would be 0 (zero) under even distribution and 100 under complete segregation. Like D, S was introduced in the literature in the 1950s (Bell, 1954; Duncan & Duncan, 1955); and S has been used almost as widely as D albeit under a variety of names (e.g., eta squared, the variance ratio index, and others). As alternative measures, D and S are sensitive to different aspects of departure from even distribution. D can take fairly high values even when departures from even distribution are quantitatively small while S will only take high values when departures from even distribution are quantitatively large, producing neighborhoods that are polarized on racial composition (Fossett, 2017; Stearns & Logan, 1986). Based on this quality, S is potentially more relevant for health disparities than D.
As noted earlier, measures of uneven distribution and social isolation are conceptually and empirically distinct. Thus, for example, one cannot infer the value of social isolation measures from knowledge of the values of either D or S. Accordingly, it is generally appropriate to consider direct measures of social isolation when the concept is relevant. Measures of social isolation are often viewed as more relevant for indicating when groups have differential exposure to all manner of neighborhood outcomes including presence of other social groups, poverty, social problems, crime, location-based amenities and disamenities, and access to social services and resources. Social isolation is the measure of interest in the present study.
Social isolation is high for a racial group when its members reside in racially homogeneous enclave areas where they primarily have residential contact and exposure to members of their own group. For racial groups, the standard measure is RI introduced by Bell (Bell, 1954) and popularized by Lieberson (Lieberson, 1980, 1981). Broadly speaking, RI is determined by two factors: the demographic composition of the county and patterns of uneven distribution. Demographic composition sets the “floor” for same group contact under even distribution. Large demographic groups experience greater social isolation under even distribution than smaller groups. Accordingly, when groups are highly imbalanced in size (e.g., whites and blacks in Minneapolis, Minnesota), it is demographically impossible for the larger group to experience low social isolation. In contrast, social isolation for smaller groups can vary over a greater range. It will necessarily be low under even distribution. It will be higher under uneven distribution, but the degree to which social isolation occurs is not a simple function of the value of D (Fossett, 2017). Specifically, for small groups, high levels of social isolation occur only when uneven distribution serves to concentrate the smaller group into a few tracts resulting in much higher-than-expected levels of in-group contact. Because blacks are a numerical minority in all but a few counties, high levels of black social isolation (RIB) are seen only when uneven distribution is pronounced
Since African Americans have less political power than whites, social isolation associated with residential separation from White Americans tends to confer systematic disadvantages in residential outcomes for African Americans. White-Black dissimilarity, the most widely used measure of uneven distribution, has been declining over time, but it remains high, and it typically is 15–20 percentage points higher than dissimilarity for other white-racial/ethnic minority group comparisons (Logan & Stults, 2011). In addition, high levels of black social isolation (RIB) are seen in most large metropolitan areas and levels of social isolation are markedly higher for Blacks than for Latinos or Asians. This can potentially lead to chronic stress for blacks because it magnifies physical and social separation from the privileges enjoyed by most majority non-Hispanic Whites who, on average, tend to reside in more desirable neighborhoods with more attractive amenities, better schools, less environmental toxins, and fewer social problems. Accordingly, all else equal, high levels of black social isolation (RIB) tend to involve greater exposure of the black population to less desirable residential environments with greater social problems (Massey & Denton, 1988; Williams & Collins, 2001). As noted previously, property values tend to be lower in African American than comparable White neighborhoods.
Segregation along socioeconomic lines is pronounced across all major urban areas (Pustejovsky & Tipton, 2016; Reardon & Bischoff, 2011). Measurement of segregation by socioeconomic status is complicated by the fact that the socioeconomic standing of households varies on a continuum. Researchers typically deal with this practical issue by focusing on discrete groups based on income quintiles or poverty status. In the comparison of poverty versus non-poverty households, households in poverty have significant disadvantages in basic socioeconomic circumstances and life chances (Jargowsky, 1997). Uneven distribution of households by poverty status creates neighborhoods fraught with concentrated poverty and severely limited resources. Such neighborhoods are further disadvantaged because, should households need to rely on neighbors for even minor assistance (e.g., a ride to work if a car won’t start), they may find that neither neighbors nor community institutions are able to help.
Black households are more likely to be in poverty. Consequently, the combination of segregation by race and poverty status simultaneously serves to concentrate black households in neighborhoods where poor black households are overrepresented. Poor, predominantly black neighborhoods are doubly disadvantaged due to minority racial status and limited economic resources. We anticipate exposure of African Americans to these doubly disadvantaged neighborhoods will put them particularly at higher risk of mortality. To measure this, we developed a novel index, RIP. Racial Isolation of Poverty for blacks (RIPB) indicates the extent to which the average black household resides in a tract of concentrated black poverty and thus has a disproportionately high level of contact with other black households in poverty. The absolute value of RIPB will be low under the condition of even distribution of racial and socioeconomic groups. Accordingly, a high value of RIPB signals that black households differentially reside in Census tracts with concentrated black poverty.
Ultimately, we found that measures of isolation were empirically superior predictors of white-black health disparities. We considered two relevant measures in our empirical analyses, the dissimilarity index (D) and the separation index (S, also known as the variance ratio and eta squared), the two most widely used measures of uneven distribution in empirical research. Their properties are reviewed in many authoritative methodological studies (Duncan & Duncan, 1955; Fossett, 2017; Iceland et al., 2002; James & Taeuber, 1985; Massey & Denton, 1988; Reardon & Firebaugh, 2002; Stearns & Logan, 1986; Zoloth, 1976) and so do not need to be discussed at length here. Many mathematically equivalent computing formulas are available for both measures. See Fossett for a review of these and several other alternative computing formulas (Fossett, 2017).
Below are formulae for the Dissimilarity Index, the Separation Index, the generic Social Isolation Index, the Racial Isolation Index and the novel index first described in this paper, the Racial Isolation of Poverty Index:


where W and B are the city totals for whites and blacks, “i” is an index for local area (i.e., tract), and wi and bi are the local area counts for whites and blacks in a given local area, pi is proportion white in the local area based on pi = wi/(wi + bi), P is proportion white in the county based on W/(W + B), and Q is proportion black based on either (1-P) or B/(W + B).
Exploratory analyses indicated that, for the purpose of predicting racial disparities in mortality, these measures of uneven distribution did not perform as well as measures of social isolation. This is not surprising because, as we noted earlier, the consequences of segregation that many see as most relevant for group disparities in health outcomes is the concentration and isolation of groups in disadvantaged circumstances. Thus, from that point of view, RIB and RIPB are the more direct measures of exposure to disadvantages in neighborhood living conditions (census tract outcomes) that may impact health outcomes. Accordingly, our empirical analyses include only the measures of social isolation, the best-performing measures.
Measures of social isolation are implemented as variations of the general exposure calculations originally set forth in Bell and later popularized by Lieberson (Lieberson, 1980, 1981).

where N is the county total for the group in question, ni is the count of the group in the local area in question, and yi is the local area residential outcome of interest (e.g., group presence, income level, etc.).
In the case of basic RI for whites (RIW) and for blacks (RIB) the index implementations are as follows


In the case of RIP for whites (RIPW) and blacks (RIPB) the implementations are modified to focus on exposure to same-group poverty households as follows.


RI registers group separation into different regions of urban space. RIP additionally registers the degree to which same-race exposure is specifically in neighborhoods where the group's poorest households are disproportionately concentrated.
Estimation and Inference Using a Linear-log Fixed Effects Model
Standard linear regression is used on a cross-section of county-level measures in the year 2010 for non-rural counties. The linear regression is focused on estimating the relationship between county-level social stressors, RIP, and county-level mortality. State fixed effects are included in the linear regression to account for within-state effects. A logarithmic transformation was used to account for the distribution of the data, and the statistical inference is based on cluster-robust standard errors that adjust for the relationship of errors within states. The standard errors are calculated using a small-sample bias-reduced linearization. This produces conservative estimates of statistical precision under small-sample conditions (Pustejovsky & Tipton, 2016). Due to the small sample size of small counties certain variables were measured using five-year rolling averages centered on 2010. Wherever sample sizes were sufficient 2010 data were used.
A simple linear regression on aggregate cross-sectional data is subject to well-known limitations. However, this is the best approach available to explore the novel and important hypothesis put forth by this study. Some of the key covariates, such as the isolation indices, require large sample sizes to estimate at the county-level, which limit them to census years. Other covariates, such as mortality, are available for several years but do not stretch back far enough to include the 2000 Census. Thus, until we either build estimates that stretch back far enough, or until the 2020 Census data is fully released, this study is limited to a cross section of counties in the year 2010.
The decision to use a logarithmic transformation of the independent variables was based on two considerations: interpretation and functional form. Several of the independent variables use units with no intuitive interpretation. Thus, log-transforming the independent variables provides a consistent interpretation of the point estimates: the marginal impact of a one percent increase in the independent variable on deaths per 100,000 people. Additionally, the relationship between several of the independent variables and mortality is non-linear, which implies the need for a polynomial term or a data transformation. For example, as can be seen in Figure 1 below, the relationship between RIPB and black all-cause mortality becomes roughly linear once RIP is transformed via logarithm. Several other variables remain nonlinear after the data transformation. Overall, the distribution of the model residuals improves after the log-transformation, which allays concerns regarding heteroscedasticity and non-normality of the residuals.
A fixed effects model was chosen to address the unobserved effects of state policies on mortality rates. For example, state Medicaid and Medicare laws impact access to health care in every county within the state, which would impact mortality rates. Including state-level fixed effects takes these policies into account, thus separating the impact of county-level stressors from the impact of state-level policies. Furthermore, since state-level policies also impact county-level stressors such as poverty rates and housing burden, the assumptions required for a random effects model do not hold. Thus, the random effects model is rejected on theoretical grounds in favor of a fixed effects model.
Standard errors are clustered at the state-level in order to account for the correlation of errors within states. The correlation of errors within states leads to artificially small standard error estimates, creating a false impression of statistical precision. The clustered standard errors take the correlation into account and provide unbiased, i.e., larger, estimates of the standard errors in the presence of correlation. However, cluster-robust standard errors are only unbiased when the number of clusters, i.e., states, is sufficiently large. Forty-eight clusters, one for each state in the sample, is a relatively small number of clusters. This once again leads to a downward bias in the estimated standard errors (Pustejovsky & Tipton, 2016). To account for the limited number of clusters in the data, a bias-reduced linearization adjustment proposed by Pustejovsky & Tipton is used (Pustejovsky & Tipton, 2016). This adjustment provides unbiased standard errors in the presence of limited clusters. In other words, this study uses a highly conservative approach to statistical inference to account for the structure of the available data.
Three different measures of the dependent variable, age-adjusted mortality, are used: all-cause mortality, heart-disease related mortality, and preventable-cancer mortality. For each mortality-race combination, this study estimates two different specifications: one using racial isolation as a proxy for chronic stress due to structural racism, and the other using the racial isolation of poverty, RIP, as a proxy for chronic stress due to the combination of structural racism and poverty. As discussed above in the data construction section, the RIP index captures the stress-generation processes embedded in high-poverty, racially segregated communities. This produces a total of six specifications for black mortality, two for each mortality type, and six specifications for white mortality, for a total of 12 model estimates.
Limitations
We note five limitations in this study. First, counties are relatively large units of observation. We used counties as our unit of analysis because census tracts are the neighborhood level units used to measure segregation within counties. Also, the measures we use to represent community stress as well as mortality rates are generally not available below the county level.
Second, racism combined with poverty is theorized as the fundamental causal mechanism. The sociological literature identifies the range of macro-level structural inequalities as stressors or causes of adverse outcomes. Biomedical evidence demonstrates chronic stress is a mediator between fundamental causes and health disparities, In other words, the biomedical literatures view stress as a mediator while the sociological literature views stressors as causal. We cannot directly measure biological stress, nor do we want to. Instead, we measure the effects of stressors on mortality using RIP and RI. A new measure, RIP, was developed for this purpose.
Third, many local variables impact health outcomes and are correlated with poverty, race, and class. The omission of such variables from our analysis introduces omitted variable bias, a type of endogeneity which can bias the estimation of the true causal relationship. The most obvious examples would be environmental pollutants such as the prevalence of lead paint, proximity to superfund sites, air quality, and water quality. The presence of each of these factors is correlated with segregation based on poverty and race. For example, the mechanism for cancer related deaths in low-income black neighborhoods may be proximity to a superfund site, but our model would attribute this effect to RIP. However, it is not random that poor black neighborhoods tend to be exposed to harmful pollutants. Proximity to pollutants is part and parcel of the race/class nexus of disadvantage and should be included in any discussion of the effects of racism on mortality. The limitation here is not conceptual; rather, the limitation is in the inability to precisely estimate the various particular causal pathways. Another possible source of endogeneity is that less healthy people self-select into segregated neighborhoods, thus contributing to higher mortality rates. Again, this type of self-selection is part of the race/class nexus of disadvantage and is much more associated with historic discrimination and low income than with poor choice. To understand the effects of RIP, in addition to examining all-cause mortality, we examined mortality from heart disease and mortality from preventable cancer, causes of death shown to be related to psychosocial stress and preventable.
Fourth, as explained in the data overview above, nonmetropolitan counties are not included in this study due to data limitations. While this excludes a large number of counties, it excludes less than 20% of the US population.
Finally, race-specific covariates would have been preferred for all variables. However, arrest rates, as reported by the Uniform Crime Reporting database, are not available separately for white and black Americans. County poverty rates from the SAIPE dataset are also unavailable separately for white and black populations. When possible, variables were constructed separately for the black and white populations to measure and control for the impact of a community environment stratified by race. Thus, some covariates are race specific and others are not. Despite these limitations, the findings of this study help point researchers toward productive research into sources of the racial mortality gap that can be addressed by public policy and may also lead to larger samples and more detailed data collection and reporting by race.
Results
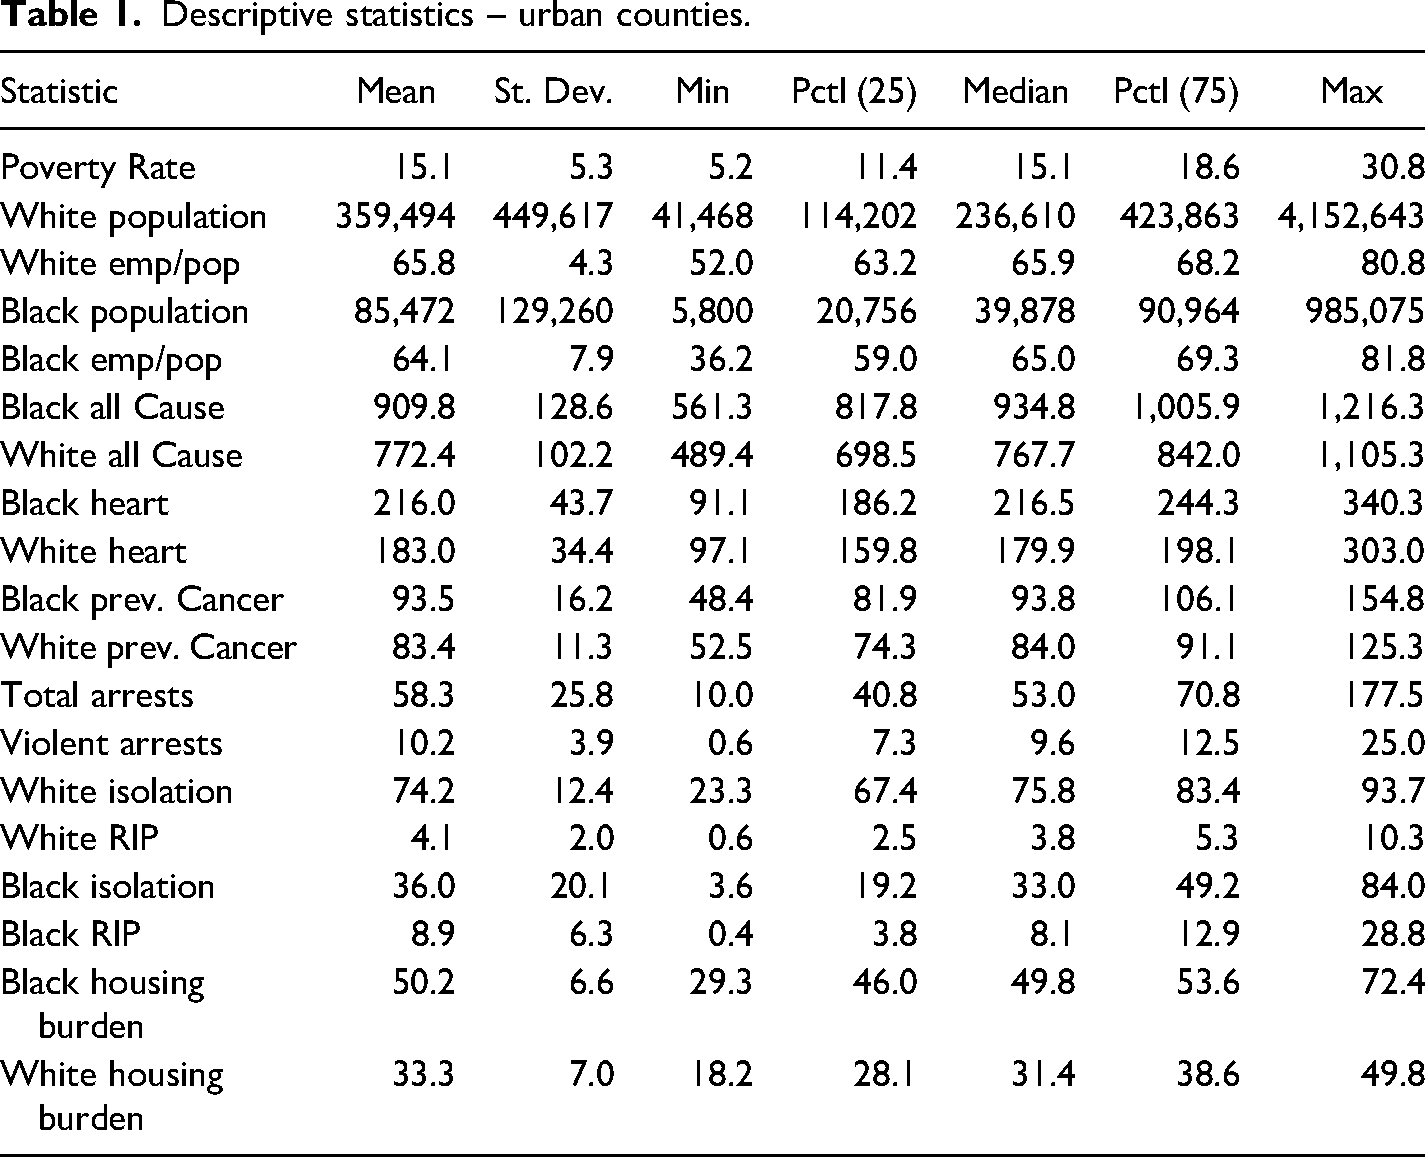
This study tested the hypothesized relationship between race-specific mortality and racialized poverty using a new index, the Racial Isolation of Poverty, RIP. RIP represents the joint incidence of two separate empirical trends: economic deprivation and racial isolation. Descriptive statistics for the data analyzed from 203 urban counties for blacks and 307 for whites, focused on 2010, are shown in Table 1. Three mortality outcomes were compared separately for the African American and White populations: all-cause mortality, heart disease, and cancer. The pathway from RIP to premature mortality for the African American population was tested and compared with RI alone. Strikingly, RIP had a similar effect to RI for African Americans. Only RIP exerted a significant effect on mortality for Whites. Tables 2 and 3 show regression results for black and white mortality respectively.
Descriptive statistics – urban counties.
Black mortality covariates linear-Log fixed effects model.
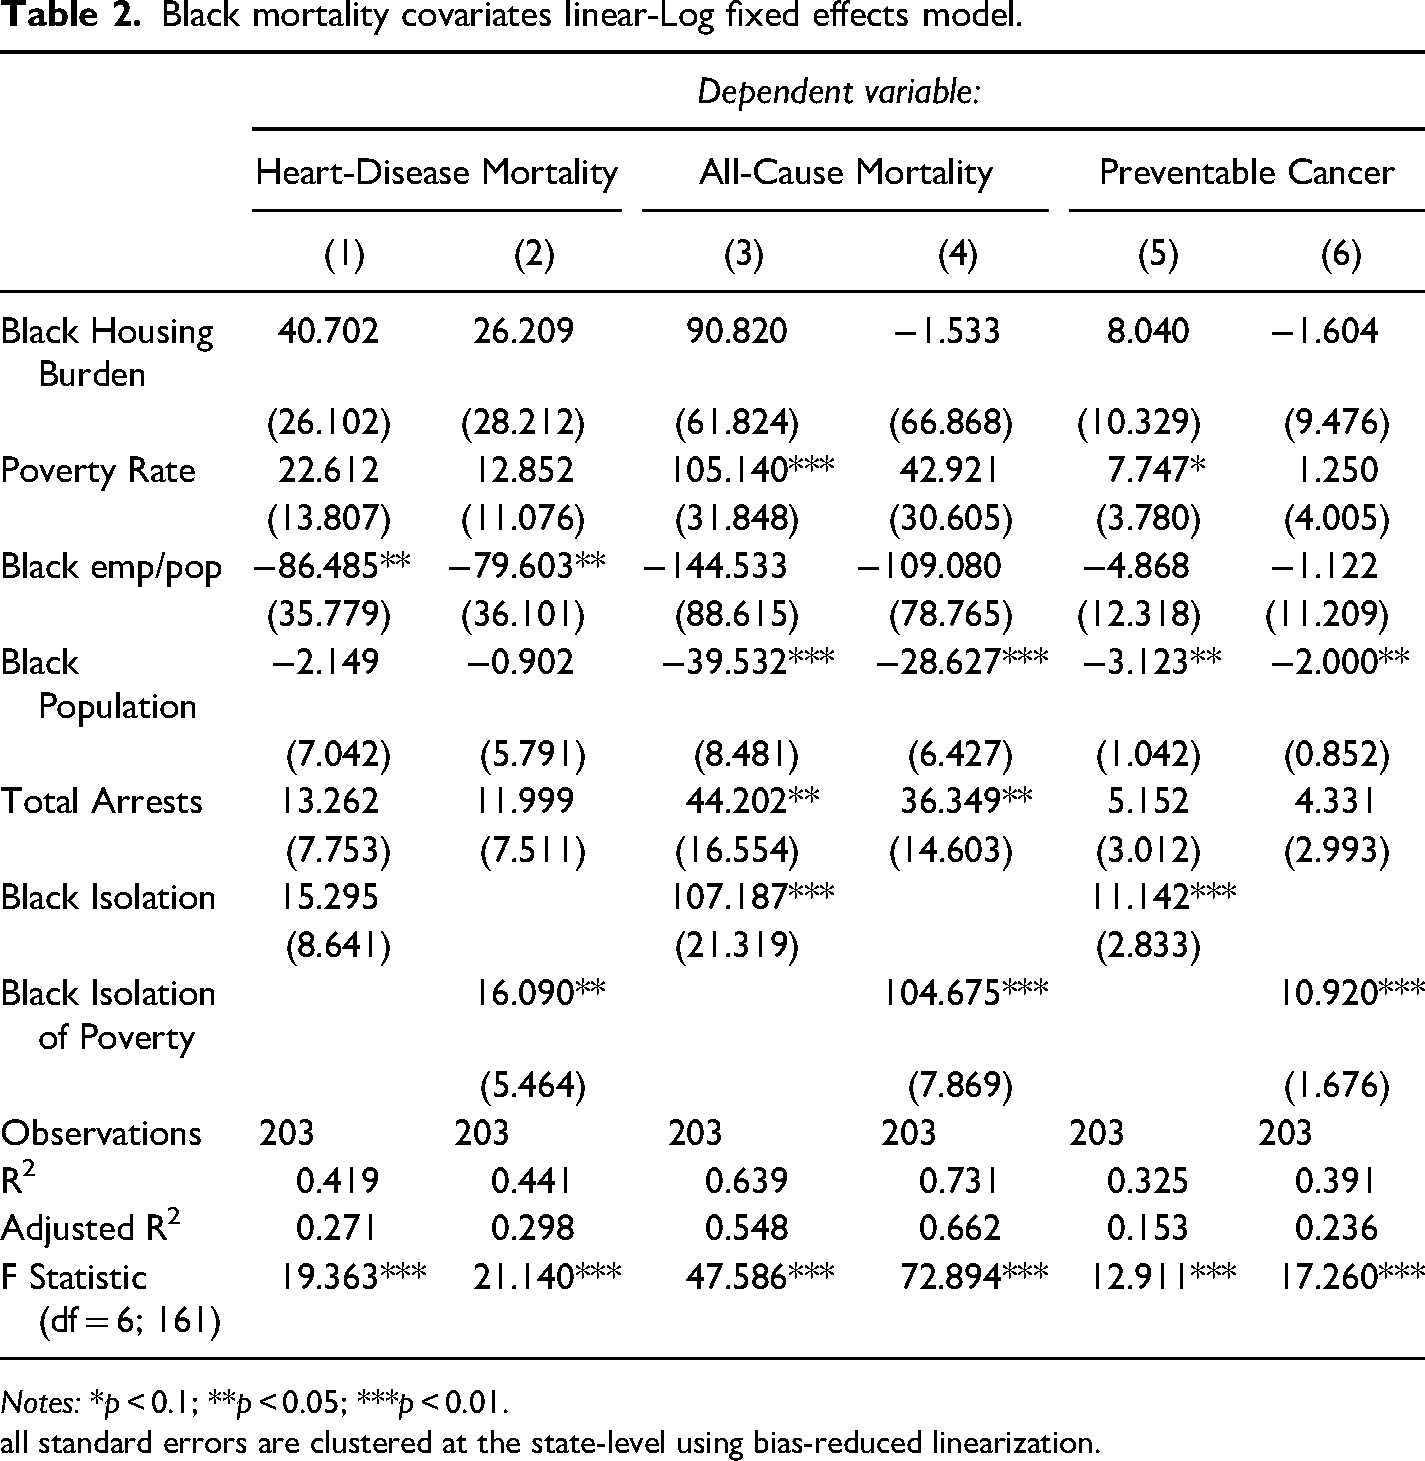
Notes: *p < 0.1; **p < 0.05; ***p < 0.01.
all standard errors are clustered at the state-level using bias-reduced linearization.
White Mortality Covariates Linear-Log Fixed Effects Model.
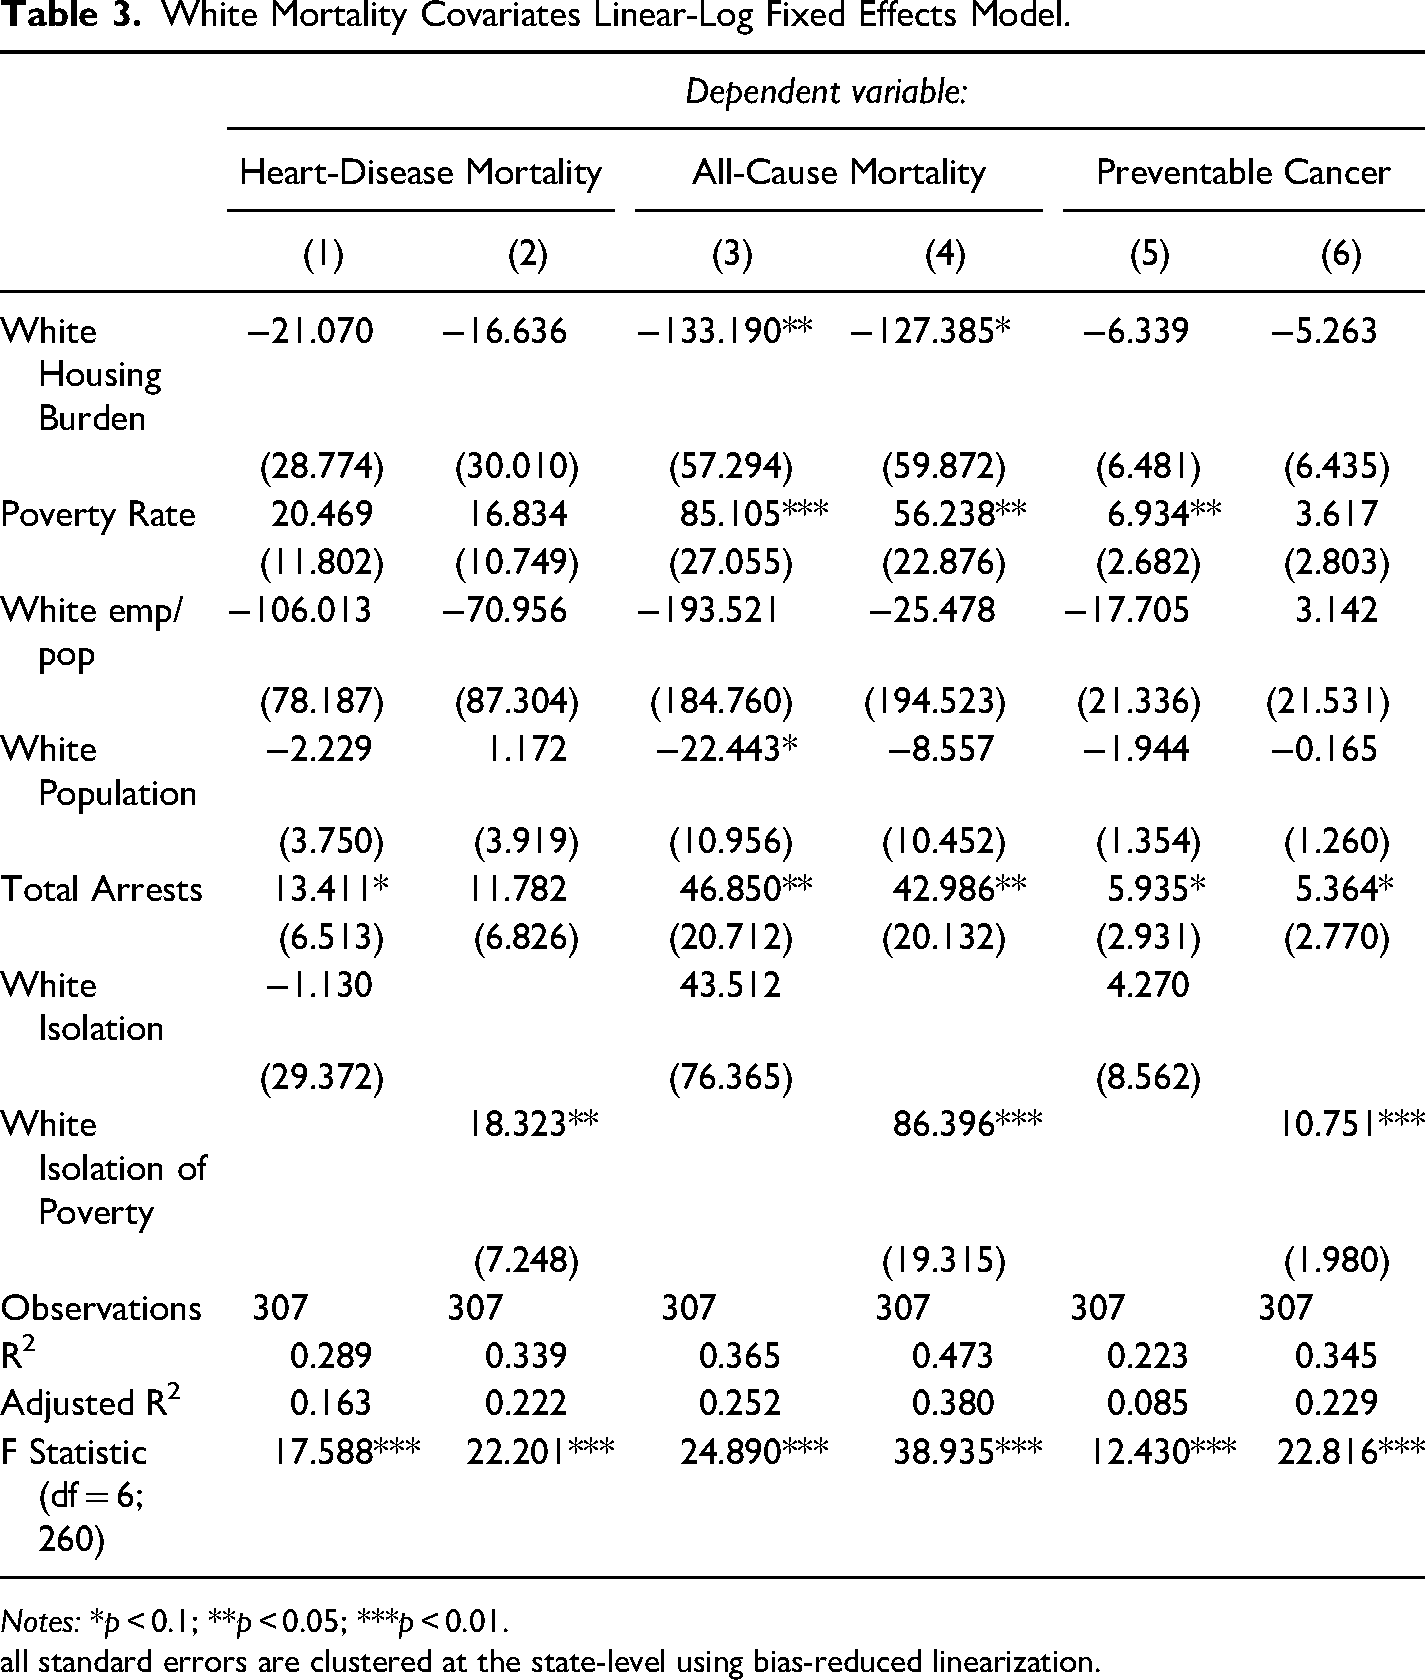
Notes: *p < 0.1; **p < 0.05; ***p < 0.01.
all standard errors are clustered at the state-level using bias-reduced linearization.
Table 2 presents six different regression results for African American mortality --two different specifications for three mortality causes-- using a linear-log fixed effects model. The first specification includes an index of RI. The second includes an index of the RIP. For heart-disease related mortality, a one percent increase in the employment population ratio led to a statistically significant reduction of 86.48 deaths per year per 10,000 people if the specification includes RI, and a reduction of 79.6 deaths per year per 10,000 people if the model includes the RIP. The marginal impact of a one percent increase in the RIP is more precisely estimated than the marginal effect of RI, but both marginal effects are nearly identical in size: an increase of approximately 16 deaths per year. This indicates that for heart disease related mortality, there is no discernable difference between using RI or RIP as a measure of stress for African American mortality. The other social stressors did not have significant detrimental effects on heart-disease related mortality. A larger percentage of African American than White households experience housing burden; however, within the African American population, housing burden was consistently indiscernible from zero in all six specifications. Other measures of social stressors yielded a range of estimates.
Roughly the same patterns emerge in columns 3 through 6: social stressors increase mortality rates with varying degrees of statistical precision, and the effect of RI is nearly identical to that of the RIP. All-cause mortality exhibits a few differences relative to heart-disease related and cancer-related mortality: a 1% increase in the absolute size of the black population leads to declines in deaths from all-cause (-39.53 and −28.63) and from cancer (-3.12 and −2.00) mortality per 10,000. Additionally, both specifications for all-cause mortality explain a large portion of the observed variation.
Table 3 presents white mortality covariates using the same specifications and model as Table 2. Results for white mortality exhibit two main differences compared to results from black mortality. First, housing burden exerts a negative, large, and statistically significant impact on all-cause mortality. Counties with high levels of white housing burden tend to have lower rates of white all-cause mortality compared to otherwise similar counties. This result may be driven by high income counties with high costs of housing inhabited by white residents with high incomes, which would be consistent with our finding that housing burden by itself, isolated from poverty and other social stressors does not have a negative impact on white mortality. The second major difference is the impact of RIP relative to RI. Counties with high rates of white RI do not experience any positive or negative impact on mortality. It simply appears not to matter. However, counties with higher rates of white isolation of poverty, our RIP measure, have much higher rates of mortality across all three types of mortality. Since the model is controlling for the poverty rate at the county level, the negative impact of RIP on white mortality reflects the chronic stress of living in a concentrated poor white neighborhood.
Conclusion
For African Americans, the effect sizes of RI and RIP were nearly identical and consistent for all three causes of death (although RI was not significant for heart disease mortality). Preventable mortality is higher for black people living in racially isolated communities regardless of poverty. We interpret this to mean that racism itself is associated with higher mortality.
RIP was significant for both African and White Americans in 2010. However, only when racial isolation is combined with poverty (RIPW) does it adversely affect whites. Since public policies established residential segregation, new policies are needed to dismantle it. Until then, gaps between African Americans and Whites in income, housing, healthcare, wealth and other social stressors that comprise RIP will continue to confer gaps in mortality. Our study confirms previous findings that multifaceted and multi-scale policies that address both race and class structures are needed to erase the stressors underlying the persistent disparities in mortality faced by African Americans (Kahlenberg, 2017; Oliver & Shapiro, 2006; Pathak, 2017; Reskin, 2012). The next section proposes two types of policies designed to do that.
Policies to Promote Economic Security for All and Reparations for African Americans
In this final section we propose two kinds of policies, universal policies to promote economic security for all Americans and reparations to promote economic security and wealth for African Americans. To reduce health inequalities, the structural conditions that put people “at risk of risks” (Link & Phelan, 1995)—i.e., discrimination, poverty, residential segregation, inadequate schools, unemployment— should be the focus of ameliorative social programs and policies (Thoits, 2010). We believe greater economic equality is one of the initial steps needed to durably address the social isolation, structural racism, and poverty associated with higher mortality rates for African Americans. Policy needs to address both economic insecurity and racism if mortality disparities are to be reduced.
Universal policies to promote economic security
Racial Isolation of Poverty is significant in our analysis for both blacks (RIPB) and whites (RIPW) and needs to be addressed. Racial Isolation of Poverty is sustained by a confluence of local deprivations related to economic opportunity. Many people with steady work do not earn enough to purchase all the essential needs to stay healthy. Universal policies related to employment, housing, education, and health can rebuild the economy, give a stake in America to ordinary people, and create the conditions for a more democratic and inclusive nation. It is well understood that universal policies designed to relieve poverty or provide economic opportunity disproportionately benefit African Americans due to their overrepresentation among low-income groups (Trisi & Saenz, 2021).
Employment
Since 1981, the US federal government has fostered neo-liberal policies to shrink the size of government by privatizing government services and property; reduce taxes, especially for high income households (Williams, 2021); deregulate the economy; and diminish the strength of organized labor. Neither subsequent Republican and Democratic administrations nor the private sector provided living-wage jobs with benefits for the majority of the population or affordable housing and education. Instead, the neo-liberal policies implemented starting in the 1980s, generated income inequality not seen since the Gilded Age (Piketty & Saez, 2003). A living wage, combined with affordable housing, quality education, and universal health insurance, would provide baseline economic security for everyone, but especially for African Americans who are most likely to experience economic insecurity.
Economic security begins with regular income from employment that pays a living wage, which is not the case for most jobs in the US today. Raising the minimum wage is an option. However, unemployment and underemployment are pervasive features in the US economy. Guaranteed job programs where the government is the employer of last resort can raise the effective minimum wage and simultaneously eliminate unemployment for all who are ready and willing to work at a living wage. A Guaranteed Job Program (also known as buffer stock employment, or public service employment) that is permanent, federally funded, and locally administered has the potential to be transformative. Macroeconomic benefits of a Guaranteed Job Program include its countercyclical stabilization mechanism as well as its ability to formalize labor markets, enhance human capital, and establish an effective minimum wage (Darity Jr & Hamilton, 2012; Paul et al., 2018; Tcherneva, 2018; Tcherneva, 2019).
Now that employment and wage discrimination is illegal, a federal guaranteed job program could generate a full-employment economy with living wages and benefits without discrimination on the basis of race or sex. This contrasts sharply with employment programs during the Great Depression, when occupational and wage discrimination prevailed. A contemporary jobs program would move the entire working population toward greater economic security and social equality. Most Americans want to work and are able to work. For those unable, such as students, trainees, parents and other caregivers, universal basic income could provide backup. Creating income security is the foundation for improving mortality rates, especially black mortality rates.
Housing
Homeownership has historically been the best way to build wealth and remains, for most households, more financially beneficial than renting (Boehm & Schlottmann, 2004; Goodman & Mayer, 2018). Current low interest rates create a financial environment conducive to purchasing a home. However, since the Housing Crisis of 2008, it has become difficult for people with anything short of perfect credit to qualify for a mortgage. In 2001, 30% of borrowers had credit scores less than 660; in 2015, only 10% qualified for a mortgage with a credit score less than 660 (Goodman et al., 2016; Shiller, 2000).
Thomas Shapiro concluded, “residential segregation is the lynchpin for race relations and the racial wealth gap” (Shapiro, 2006). One of the most important steps to help stabilize and increase the black homeownership rate is to expand credit availability, especially from the FHA and the US Department of Veterans Affairs (VA). The FHA and VA offer smaller down payment options and are more lenient on credit score requirements than the government sponsored enterprises (GSEs), such as Fanny Mae and Freddy Mac, which fund mortgages. For example, in 2016, 17.3% of FHA originations went to borrowers with credit scores below 640, compared with just 1.2% for the GSEs. More funding is needed for the FHA and VA to help African American borrowers vault barriers to buying a home. Access to affordable, stable, and adequate housing is an important determinant of health (Taylor, 2018). Homeownership is linked to positive health outcomes -- even among low-income homeowners and especially for their children (Boehm & Schlottmann, 2008; Boehm & Schlottmann, 2004; Green & White, 1997; Retsinas & Belsky, 2002).
In 2019, 30% of US households were cost burdened. Renters were more likely to be cost burdened than homeowners. Forty-six percent of renters and 21% of homeowners were cost burdened. Among renters, African Americans have the highest share at 53.7% compared to 41.9% of Whites (Harvard University, 2020). Fundamental features for health equity in housing are safe, stable, affordable housing without any hazards in healthy neighborhoods (Gutman et al., 2019). Unless the affordable shortage is addressed, housing will be increasingly unavailable, much less safe housing in healthy neighborhoods. Massive federal programs are needed to build and maintain affordable housing and to guarantee mortgages without discrimination, especially through the FHA and VA. Universal housing policies would disproportionately increase disposable income, wealth, and health for African Americans.
Education
Adults with higher educational attainment live healthier and longer lives compared to their less educated peers (Zajacova & Lawrence, 2018). Underfunded school systems, especially for African Americans, are another harmful long-run effect of structural racism, social isolation, and poverty. If the federal government were to provide high-quality free public education, including preschool, K-12, and community colleges throughout the land, it would equalize schooling opportunities and help reduce differentials in income and wealth, especially for African Americans.
Local property taxes provide most of the funding for public schools (Wikipedia, 2020). As a result, wealthier school districts can, and generally do, provide better school environments for their students. It was Richard Rothstein's years of research on school segregation that led him to investigate policies leading to housing segregation in The Color of Law.
Across the US, on average, about 45% of public education is funded by local property taxes (Leachman et al., 2017). Higher per-pupil spending tends to be positively associated with better student outcomes (Baker, 2016), and children from poor families who attend better-funded schools have better outcomes in adulthood (Jackson et al., 2015). If states were required to pool and share local taxes as a requirement for federal funding for public schools, it would go a long way toward equalizing state funding across school districts. To sweeten the blow, the federal government could increase its proportion of school funding. Additional funding would give the federal government more say in educational standards, curriculum, building standards, and other features of public education in the US.
A well-educated population is foundational for democracy. Equal funding for education regardless of class, race, or gender is needed to ensure a fully engaged and informed citizenry. Pre-school programs improve a wide range of socio-economic outcomes when those children become adults (Anderson et al., 2003). A community college education in the twenty-first century is equivalent to a high school education in the 20th century (Van de Werfhorst & Andersen, 2005), so public funding for community colleges would simply keep up with credential inflation.
Healthcare
The United States is the only industrialized country lacking universal health care. Even though the US spends nearly twice as much as the high-income country average, the US population has a lower life expectancy and higher suicide rates than average (Organisation for Economic Co-operation & Development, 2019). So where does the money go? High administrative costs and use of specialty physicians for primary care services provide part of the explanation. Rising prices are another contributor: between 2007–14, prices for inpatient and outpatient hospital care rose 42 percent and 25 percent respectively, and prices for surgical procedures in US hospitals greatly exceed those of other countries (Cooper et al., 2019).
Another part of the explanation is high drug prices. The US is the only advanced capitalist country that does not negotiate or cap drug prices, even though the federal government spends millions every year subsidizing clinical trials for private pharmaceutical companies and purchases a large proportion of drugs used by Americans through Medicare and Medicaid. A recent report by the RAND Corporation found prescription drug prices in the United States average 2.56 times higher than those in other countries (Mulcahy et al., 2021). Tax deductible advertising costs are equivalent to drug company research costs. As a consequence, Dean Baker estimated that drug prices in the US were up to 400% too high in 2004 (Baker, 2004). Not surprisingly, the pharmaceutical companies have higher profits than other sectors of the Standard and Poor 500 (Ledley et al., 2020). High drug prices contribute to economic inequality and premature death because the high profits that go to drug company executives and investors make life-saving drugs unaffordable for many (Califf & Slavitt, 2019).
High prices, low wages, and lack of healthcare coverage contribute to medical bankruptcies (Himmelstein et al., 2005). A study published in 2019 found that 66.5% of all personal bankruptcies were tied to medical issues —either because of high care costs or lost pay from time off work (Himmelstein et al., 2019). Eighteen percent of US residents were uninsured in 2010, though this percentage has dropped with implementation of the Affordable Care Act (ACA) (Finegold et al., 2021).
Medicare for All or Single Payer bills to provide healthcare coverage for the entire US population have been proposed during every session in the Senate since 2017. The US spends about 17% of annual GDP on healthcare. Other high-income countries spend about 40% less per capita with better health outcomes. Pollin et al. (Pollin et al., 2018) estimate that, even if demand for services increased 11% with universal coverage under Medicare for All, it would reduce total health care spending in the US by nearly 10%. Most savings would come from lower administrative costs and lower drug prices. Most of the additional taxes paid by businesses and households to fund universal coverage would be offset by premiums, deductibles, co-payments and out-of-pocket costs that consumers would no longer need to pay to private health insurance companies (i.e., “existing sources”). In summary, Pollin estimates that out of total system costs of $37.8 trillion, $24.2 trillion would come from existing sources, and $13.5 trillion would come from tax revenues (Pollin, 2019).
A perverse incentive structure determines who gets health care in the US. Private insurance and high income –not medical need-- are associated with greater utilization of services. Medical services and medications are not coordinated across the different medical markets. Each service requires a separate appointment, often a separate doctor or technician, and always a separate payment. No systematic checks are in place to warn patients when prescriptions are counter-indicated. Studies comparing for-profit and nonprofit facilities show worse health outcomes among for-profit HMOs (Himmelstein et al., 1999).
Perverse incentives have led for-profit corporations to close needed hospitals and other medical services that are not profitable. These cost-cutting measures have reduced access and quality, especially for poor and African American patients. Hospitals that converted from public or nonprofit to for-profit reduced staff (Rosenau, 2003) and reduced by half uncompensated care, which largely serves poor patients (Thorpe et al., 2000). Profit-based health care delivery sanctions people living in poor neighborhoods. Clinics serving low-income and predominantly African American neighborhoods often are understaffed, under-equipped and consequently provide lower quality services to their patients (Landrine & Corral, 2009). Changing this perverse incentive structure into a universal system with negotiated prices as in other high-income countries would move the US toward greater equality in healthcare access and improve population health.
The ACA Triple Aim objectives of cost containment, improved population health, and improved patient experience are good intentions. However, the structure of power and resources in US society undermines the potential of ACA reforms, especially the potential to improve population health. So far, the main focus of reform has been on cost containment (Wilkinson et al., 2017). Nevertheless, access to health insurance improved after the main ACA provisions went into effect in 2014. The ACA reached its target: disparities in health insurance coverage by race declined. The percentage of uninsured adults between 2008 and 2014 decreased by 7.1 percentage points for Hispanics, 5.1 percentage points for Blacks, and 3 percentage points for Whites. Coverage gains were greater in states that expanded Medicaid programs. Further gains, the study authors conclude, will require Medicaid expansion by more states and increased insurance take-up in states that already have expanded Medicaid (Buchmueller et al., 2016).
Improved population health is the ACA objective that would result from addressing poverty and racism. Addressing these fundamental causes would require mainstreaming the practice of screening patients for nonmedical needs related to SDOH and linking them to community-based services. The VA has a comprehensive and successful program to screen and service homeless veterans (https://www.va.gov/HOMELESS/accomplishments/accomplishments.asp). The practice is gaining traction but is not yet widely used outside the VA. Even so, standardized screening tools are available (Billioux et al., 2017; O'Gurek & Henke, 2018).
Though access to healthcare services is critical for individual health, in order to lessen people's lifetime accrual of acute and chronic stressors, policies would need to target upstream factors because these factors ultimately determine population health. Poor neighborhoods and their residents have fewer resources, more morbidities and higher mortality than residents of higher income neighborhoods. Racial discrimination adds to disparities experienced by African Americans. In short, while healthcare is a mediating factor, the fundamental causes of disparities in mortality are the upstream social determinants of poverty and racism.
Reparations for African Americans
RI results were similar to RIP for African Americans, which indicates that policies to specifically address racial discrimination are needed for African Americans. The goal of reparations is not to achieve any policy goal, but to provide just compensation for the intergenerational effects of slavery as well as the long history of legal and institutional discrimination against African Americans. However, because any regime of reparations would directly impact upstream social determinants of health in African American communities, we feel it is important to discuss the potential impact of reparations on the black-white mortality gap.
Researchers, public scholars, and legislators have resuscitated 2 the call for black reparations to address inequality, especially wealth inequality (Bassett & Galea, 2020; Coates, 2014; Darity & Mullen, 2020; Singletary, 2020; Singletary & Decaille, 2020). House of Representatives Bill 40, proposed in 2021, would establish a congressional commission to investigate slavery and its multigenerational effects and to assess the feasibility of compensation. As Darity and Mullen suggest in From Here to Equality, reparations provided to Japanese Americans after their internment during World War II provide a model for reparations for descendants of slaves (Darity & Mullen, 2020)
The purpose of reparations is to provide restitution for past wrongs. African American history and structural racism provide keys to estimating the dollar amount owed. The origins of the racial wealth gap and the justification for reparations for African Americans can be traced to slavery and the theft and terror tactics used to keep African Americans from accumulating wealth and capital during bondage and after emancipation. As previously noted, chattel slavery created enormous wealth, estimated at about US$12 to US$13 trillion in 2018 dollars (Craemer et al., 2020). After emancipation, the promised 40 acres and a mule to black refugees in the south never materialized. During the following 100 years, African Americans were disenfranchised and, when able to acquire land, capital, wealth, or political power, were often terrorized, tortured or murdered, and their property confiscated. Few were allowed to take advantage of land grants when the US government opened the West for settlement after the Civil War or after World War II when the US government offered mortgages in the suburbs. A deadly wave of white terrorism during the early 20th century looted and burned prosperous black towns where African Americans had managed to acquire education, capital and wealth (Darity & Mullen, 2020).
A rich scholarship is available to understand how African Americans were systematically deprived of wealth and capital throughout US history and to understand why reparations are deserved. Home ownership and pension plans are measurable outcomes for assessing wealth equality because wealth for most people today is accumulated via home ownership and pension plans.
The baseline for reparations for African Americans is 1865, when 400,000 acres confiscated from plantations were to be redistributed to 40,000 emancipated slaves in 40-acre plots. The land was not redistributed but the current value of the land can be calculated. Justification for reparations as well as how much and to whom they should be paid is provided in From Here to Equality (Darity & Mullen, 2020). At a minimum the present-day value of 40 acres and a mule can provide the foundation for the calculation of the magnitude of reparations owed to African American descendants of slaves (Darity, 2008).
Darity and Mullen argue that because the federal government is the major proponent of racist policies, it should pay the bill. Reparations could include financing institutions, investing in communities, and directly paying individuals (Darity & Mullen, 2020). However, unless they result in increased productive capacity owned by blacks, Darity cautions, reparations will not have a long-term positive impact on black income and wealth (Darity et al., 2010).
Baby Bonds, although usually envisioned as a universal policy rather than as a reparations policy, is a seed capital program designed to make wealth more inclusive. We envision a “baby bond” plan of much greater scale and magnitude—progressively rising to $50,000 or $60,000 for children in families in the lowest wealth quartile and accessible once the child turns 18 years of age. These individual trusts could grow in federally managed investment accounts with guarantees of at least 1.5–2% annual growth rates. We also would determine eligibility for such a program based upon the net worth position of the child's family rather than their income, e.g., all children whose families fell below the national median for wealth would receive ‘baby bonds’ (Hamilton & Darity, 2010).
Even though the baby bond plan would be distributed based on wealth, not race, Naomi Zwede modelled the effect of baby bonds and found it would generate a large reduction in the racial wealth gap. With universal baby bonds, each racial group would be better off. The overall median estimate increased from $29,000 to nearly $75,000. A racial disparity would remain, but the differential would be diminished so that the median white young adult's household wealth would be approximately $79,000 and the median Black's approximately $58,000 (Zewde, 2019).
Wealth building policies must continue to address economic security, housing, education and healthcare institutions, and reparations to African American individuals and communities until socio-economic disparities between black and white Americans are eliminated and until life chances and socio-economic mobility of children are not restricted by structural racism or by the social class of their parents. A guaranteed federal jobs program is needed to ensure that average real wages do not fall while reparations are helping African Americans catch up. Baby Bonds are proposed to reduce the wealth gap in one generation. Reparations are needed to rebuild whole communities, such as Tulsa, Oklahoma and Rosewood, Florida. Reparations need to reimburse descendants of slaves who were never allotted the promised 40 acres and a mule. Reparations would also offer African Americans the opportunity to learn more about their ancestors. Darity and Mullen propose setting up an Office of Genealogy at the National Archives specializing in the family history of African Americans. The idea would be to search for genealogical proof of slave heritage in order to qualify for reparations (Darity & Mullen, 2020). The purpose and activities of police and the judicial system must be revamped, especially in poor black neighborhoods. Exclusionary zoning should be extinguished, funding for public schools needs to be equalized, and voting needs to be easier and better supported. Increasing the wealth of African Americans can help improve health. For example, people who can afford to purchase medical care and prescriptions tend to have better health.
Both universal policies and reparations are needed to improve mortality rates overall and radically reduce the black/white disparity in mortality. Employment, income, housing, education, wealth, and health of the majority of Americans have deteriorated since 1980. Universal policies are needed to reduce income inequality and promote economic justice for all Americans. Reparations are needed to help black Americans catch up after centuries of residential segregation and isolation. Reparations would target individual descendants of slaves, poor black neighborhoods, and predominantly black institutions. The enormous contributions of African Americans have not been adequately remunerated yet and they need to be. Reparations offer an opportunity for the US to demonstrate true exceptionalism.
We found that the combination of structural racism and poverty are strongly associated with disparities in black/white mortality. Racial isolation alone (RI) made as strong a contribution to black mortality as RIP. Strikingly, only RIP contributed to white mortality; racial isolation alone had no effect.
Our results show that upstream stressors contribute to disparities in black/white mortality. Upstream determinants of health are most effectively addressed with policy solutions (Frieden, 2010). Therefore, we proposed two sets of policies: universal policies designed to generate full employment that would create a sustainable economy in combination with reparations designed to compensate African American descendants of slaves. These remedies would provide a foundation for reducing the black/white disparity in mortality. Our study confirms, as previous studies have suggested, that multifaceted and multi-scale policies are needed to address the race and class structures that cause the persistent disparities faced by African Americans in the United States.
Footnotes
Declaration of Conflicting Interests
The author(s) declared no potential conflicts of interest with respect to the research, authorship, and/or publication of this article.
Funding
The author(s) received no financial support for the research, authorship, and/or publication of this article.