
Abstract
This paper presents an analysis of the extent to which poor pupils in England are clustered in schools with others like them. It is based on a segregation index of pupils eligible for free school meals for every year for which official national data is available. The trend over time has been published before up to 2019, and this paper extends the analysis to 2021, covering both the Covid-19 era so far and the beginning of transitional arrangements for Universal Credit, which have led to a substantial increase in the number of pupils eligible for free school meals. Results show that the segregation of poor pupils between secondary schools has continued to decline annually – a decline that started with the onset of Pupil Premium funding. This decline in segregation has not occurred for other possible indicators of disadvantage, such as pupils having a special educational need or disability, which are not addressed by Pupil Premium funding. Clustering disadvantaged pupils together in parts of a national school system has been linked to worse pupil outcomes overall, lower aspirations, less ethnic cohesion, and reduced trust in society by students. So, this ongoing reduction is encouraging, and is likely to lead to a lower poverty attainment gap in academic outcomes. However, the reduction in 2020 and 2021 is “false” to some extent, based mostly on a sudden increase in the number of pupils officially classed as poor, rather than an improvement in their distribution or evenness. It is, therefore, important to retain Pupil Premium funding or something like it for the time being to see what happens to the attainment gap. And the apparent success of this funding scheme could have implications for school systems worldwide that value fairness in the provision of national opportunities for education.
Introduction
This paper concerns the extent to which children and young people coming from poorer households tend to be disproportionately clustered in particular schools with others like them. We call this phenomenon socio-economic segregation between schools (Gorard et al. 2003). The paper explains what this segregation is, how it can be measured, what causes it, and the damage it creates for the school system. The main part of the paper looks at how this socio-economic segregation has changed in England since 1989, with an emphasis on what has happened since 2019. Looking at the new analysis from 2019 in light of longer-term trends is interesting and revealing in a number of ways. It extends our prior work on the possible impact of Pupil Premium funding, and brings it into the era of Covid-19, and the transitional arrangements for Universal Credit (see below). The paper concludes by considering the possible implications of these new results for policy in England and further afield.
The term segregation as used in the paper is the opposite of evenness in the distribution of student characteristics across the schools in any area or system. If, for example, 10% of students in an area were from Black ethnic backgrounds, and each school in that area had around 10% Black origin students, then we could say that this particular characteristic was evenly distributed between school intakes. If, at the other extreme, Black students only went to schools with other Black students, so that perhaps 10% of schools consisted of all Black intakes, and 90% had no Black students, then we could say that the system was totally segregated. The index we describe later, and use for assessing the level of segregation for any student characteristics, is a measure of this uneven spread between schools. Segregation can be of any individual student characteristic, usually an indicator of potential disadvantage in education.
The main focus of this paper is on economic poverty. In any school system, poorer children tend to be clustered to some extent in particular economic regions, areas of housing, and schools (Jenkins et al., 2008; Gorard, 2015; Roew and Lubienski 2017). Of course, disadvantaged students may also be segregated in a number of ways within the school that they attend. Any damage caused by segregation between schools could also arise from segregation within schools, and schools should act to reduce it (Dalane and Marcotte 2022). However, this paper focuses on segregation between school intakes.
Why does segregation matter?
Socio-economic (SES) segregation between schools, however it happens, creates a system of heavily disadvantaged, and much less disadvantaged schools. Because of the well-established link between disadvantage and lower average attainment this means that the school system will have schools with very different attainment outcomes. Observers, including families but also policy-makers and even some researchers, then attribute the higher attainment in less disadvantaged schools to better teaching or differentially effective schooling. The ensuing competition for places at these apparently more “desirable” schools then exacerbates the segregation itself and so the appearance of differential results.
Socio-economic segregation between schools means that different sections of the population in any local area tend to be educated in isolation from each other. We have previously presented evidence that this has potentially very damaging impacts for the students, the school system, and society more generally (e.g. Gorard et al. 2003, Gorard and See 2013). Research worldwide has consistently reported that socioeconomic segregation between schools leads to worse inequalities in schooling outcomes (e.g. Sciffer et al., 2021). Socioeconomic segregation between schools is strongly associated with higher degrees of social reproduction (Reichelt et al., 2019). In heavily selective school entry systems, such as grammar and secondary modern schools in England, or early-age tracking as used in Germany and elsewhere, the social origin of students has a stronger link to their later social status. Such systems create a kind of social stagnation rather than mobility. The same kind of damage can also occur in non-selective (or ostensibly non-selective) systems, such as those where school places are influenced by religion or the cost of local housing. Any reason for segregation will do.
This may be due to a peer effect whereby young people adapt their expectations towards the average outcome expectations of their friends (Lorenz et al., 2020). According to an analysis of longitudinal data for England by Dickerson et al. (2018), this peer effect is more serious for lower-attaining and more disadvantaged pupils. By disproportionately denying poorer students access to more academic schools, tracked schooling systems tend to concentrate social disadvantage into schools with lower academic expectations of students by their teachers.
There is a long-standing body of evidence showing that equivalent student behaviours, interactions and achievements are interpreted differently in different settings as defined by the peer group. Indeed, the peer group can actually induce different behaviours, interactions and achievements. For example, children clustered in low ability groups tend to demonstrate more hyperactivity and emotional problems (Papachristou et al., 2021).
Going to school in segregated settings is therefore potentially damaging in a variety of ways (Horgan 2007) – such as lowering aspiration, expectations, and participation for individuals. It reduces national and regional social and ethnic cohesion (Danhier 2018; Hewstone et al., 2018). SES-segregated schools are also linked to students’ decreased trust in public and private institutions (Molina and Lamb 2021), and to different experiences of fairness at school (Gorard and Smith 2010, Gorard 2012). SES segregation between schools can also act to deter more qualified teachers from working in heavily disadvantaged schools (Copeland 2018). These issues tend to exacerbate the original segregation in a vicious circle.
However, school desegregation can reverse many of these problems. Exposure to a more varied set of possible friends at school can lead to improved role models for lower attaining pupils (Gorard 2018), and more tolerant wider pupil attitudes such as trust in others (Bhattacharya 2021). Also, actions to improve average attainment, the attainment of all students, the poverty achievement gap, and segregation, are valuably complementary. Acting on one of these issues can easily help with any or all of the others (Kyriakides et al., 2019, 2021).
The extent of socio-economic segregation is therefore a valuable indicator of the health of a school system, and we have been monitoring the situation for England since 1997, using data going back to 1989 (the earliest date for which official records are available).
What causes (de)segregation?
The reasons why segregation occurs forms part of our previous explanatory and in-depth work (Gorard et al. 2013, Gorard 2015, 2022). Perhaps the primary determinant of segregation between schools is residential segregation, and the two patterns are mutually reinforcing. Where areas or blocks of housing are either rich or poor then the schools that their neighbourhoods serve will tend to reflect those students who are rich or poor. Schools mostly reflect the population of the areas they serve (Taylor et al. 2003).
In some countries, including China and the US, schools are funded partly by local taxation. This means that schools in richer areas or provinces will have greater funding and so more resources, and schools in poorer areas will have less. This is an absurd way to finance a
Even when the funding of schools is flatter, as it is in England, schools in richer areas with more expensive houses will still have better average outcomes because of the clear link between average attainment and student SES. These schools might then be seen as more desirable by parents, and families may be willing to pay more for housing near them – the so-called estate agents’ premium. If this happens, the cost of housing near desirable schools rises, thereby exacerbating the difference in raw-score school outcomes compared to poorer areas – the “Belfast” model (Gorard et al. 2003). As discussed above, the whole situation is exacerbated whenever places at schools are rationed and allocated through academic, financial or faith-based selection (Gorard and Siddiqui 2018), including tracking by ability (Strello et al., 2022), as widely used in countries in central Europe, and in some subjects in the US (Loveless 2021). The younger the students are when this tracking takes place, the worse the situation generally is, as it is in Austria, Hungary and Germany where selection occurs from the age of 10 (Sciffer et al., 2021). Any kind of selective intake, including by the faith of the family, leads to segregation. In fact, almost any kind of diversity of schooling, even just a curriculum speciality and even if not ostensibly selective, leads to higher SES segregation between schools (Gorard, 2018; Marcotte and Dalane 2019). Where the factors outlined above change then segregation tends to change with them.
Universal credit
Universal Credit is a benefit payment paid by the state to families on low incomes in England. It was introduced in 2013, and families have since been gradually transferring from other schemes and benefits (Department of Work and Pensions 2022). Since 2018 students from families who receive Universal Credit and also earn less than £7,400 per annum have been automatically eligible for free school meals (Ghosh 2022). Many of these would not have been eligible in previous years, based on different rules. In addition, transitional arrangements made by the government to ease the rollout of Universal Credit, especially due to the Covid-19 pandemic, mean that a student once eligible for FSM would remain recorded so for their entire time at school. Previously FSM-eligibility was repeatedly assessed and students could move in and out of this status. Both of these changes have led to a substantial increase in the number of students listed as eligible for FSM (see below), and there is currently no way of telling from available data which of these students would have been FSM-eligible using the pre-2018 system. For the first time since 1992, when official records moved from FSM take-up (actually eating the free meal) to FSM eligibility (for the meal whether eaten or not), the definition used for FSM status has changed so much that it will noticeably affect the historical time series.
Pupil premium policy
Another factor is that in April 2011, the government introduced Pupil Premium funding for schools in England. The money was allocated annually to all state-funded schools, in proportion to their intake of disadvantaged pupils (Roberts et al., 2021). Disadvantage was defined as coming from a low-income family, known to be currently eligible for free school meals (FSM), and a much smaller number of children who had been looked after by the state continuously for more than 6 months (Education and Skills Funding Agency 2018). In 2012/13, the funding was extended to include pupils known to have been FSM-eligible in any of the previous 6 years (EverFSM6). A smaller premium was also paid for pupils having parents in the armed forces, and for pupils whose parent(s) had died while in the armed forces (Foster and Long, 2018; 2020). Subsequently, similar policies have been introduced in the other home countries of the UK, including Pupil Equity Funding (PEF) in Scotland.
In 2011, £430 was paid for any child who had been looked after by the local authority for at least 6 months. In 2014 this was increased to £1,900, and extended to children looked after for 1 day or more, and children adopted from care or who had left care on a special guardianship or child arrangements (previously known as a residence order). By 2020, the funding was £2,435. Similarly, in 2011, children eligible for free school meals attracted £430 whether in primary or secondary school. In 2012, this was raised to £530 and given for children who had been eligible for free school meals at any point in the prior 6 years. From 2014 onwards, children of primary age started attracting more funding than those of secondary age. By 2020, the figures were £1,345 per EverFSM6 pupil at primary school, and £955 at secondary. The funding for pupils from armed forces families was £200 in 2011, rising to £310 by 2020. For some primary schools, the overall funding amounted to well over £150k per annum, and for some secondary schools well over £300k. This means that Pupil Premium provided about half as much again for disadvantaged students as the standard Age Weighted Pupil Unit (The Sec. ret Headteacher 2020). Most funds other than the Age Weighted Pupil Unit are for specified and audited expenditure. Therefore, the Pupil Premium funding can make a substantial difference to the running of schools.
Pupil Premium funding had two main purposes – to reduce poverty segregation between schools, and reduce the poverty gap in attainment outcomes. The focus of this paper concerns the first of these. But the first does have an impact on the second (see below).
Methods
This paper updates a set of time-series analyses that have illustrated the patterns of socio-economic segregation between all state-funded secondary schools in England. The data from 1989 to 2019 from the School Level Annual Schools Census have been previously published in Gorard (2015, 2018) and Gorard et al. (2019), for example. The new school-level data for 2020/21 for this paper comes from the UK government Find and Compare Schools website (Gov.UK 2022). The file was downloaded, and only the records for state-funded mainstream secondary schools (e.g. not hospital schools) were retained.
Two main indicators are compared. The first is eligibility for free school meals (FSM) in each school year, which is an indicator of a student coming from a family living in poverty. The second is having a recorded Education, Health and Care plan (EHC), as an indicator of a special educational need or disability (SEN). Each indicator was totalled for all mainstream schools in England, and used to create a percentage of all pupils with each indicator (the prevalence of this measure of potential disadvantage). Each indicator was then used to create a Segregation Index.
This index is a measure of unevenness. A segregation residual is first computed for each school. The calculation starts with the number of FSM-eligible (or SEN or whatever) pupils in each school, divided by the number of FSM pupils in all maintained schools in England, and then subtracts this from the number of all pupils in each school, divided by the number of pupils in all schools. The absolute values of the residuals for all schools are then totalled, and divided by two. More formally, GS = 0.5 * (∑|Fi/F - Ti/T|)
Where:
Fi is the number of disadvantaged children in school i
Ti is the total number of children in school i
F is the total number of disadvantaged children in England
T is the total number of children in England.
This provides the proportion of all disadvantaged students who would have to exchange schools in order for all schools to have their ‘fair share’ of disadvantaged students.
The Segregation index has a long pedigree in a number of guises (Gorard and Taylor 2002). For example, Duncan et al. (1961) introduced an index which they call ‘delta’, which was in turn adapted from the Hoover coefficient used in populations studies (Hoover 1941). All three of these are effectively the same index, found by comparing the distribution of the out-group with the distribution of the population. The approach is termed strongly compositionally invariant, meaning that it has to be preferred in situations when the prevalence of the indicator used changes over time, as it is done in the examples used in this paper.
The trends over time for FSM-eligibility prevalence and national FSM segregation, and EHC/SEN prevalence and national EHD/SEN segregation, were cross-plotted over time from 1989 to 2021. The graphs are based on annual points, but are presented as line graphs to aid readability. Finally, the prevalence and segregation figures for each indicator were correlated using Pearson’s R.
Findings
The full time-series illustrating the prevalence of FSM and the segregation (or unevenness) of FSM-eligible pupils since 1989 is shown in Figure 1. FSM segregation has a kind of cyclical pattern, with a high in 1990 as the Education Reform Act 1988 came into force, and again in 2007 before the economic downturn. However, since 2009 the level of segregation has declined steadily and annually. These changes are at least partly driven by the economy. We noted in Gorard et al. (2019) that until around 2012 the level of segregation mirrored the prevalence of FSM-eligible pupils (with a correlation of −0.46). In eras where there were more pupils recorded as living in poverty, such as after the worldwide economic crash of 2008, these appeared to be more evenly spread between schools. When the economy improved, as it did after 1995, the number of FSM-eligible pupils dropped, and their segregation between schools increased. Prevalence of FSM-eligibility and FSM segregation between schools, England, 1989–2021.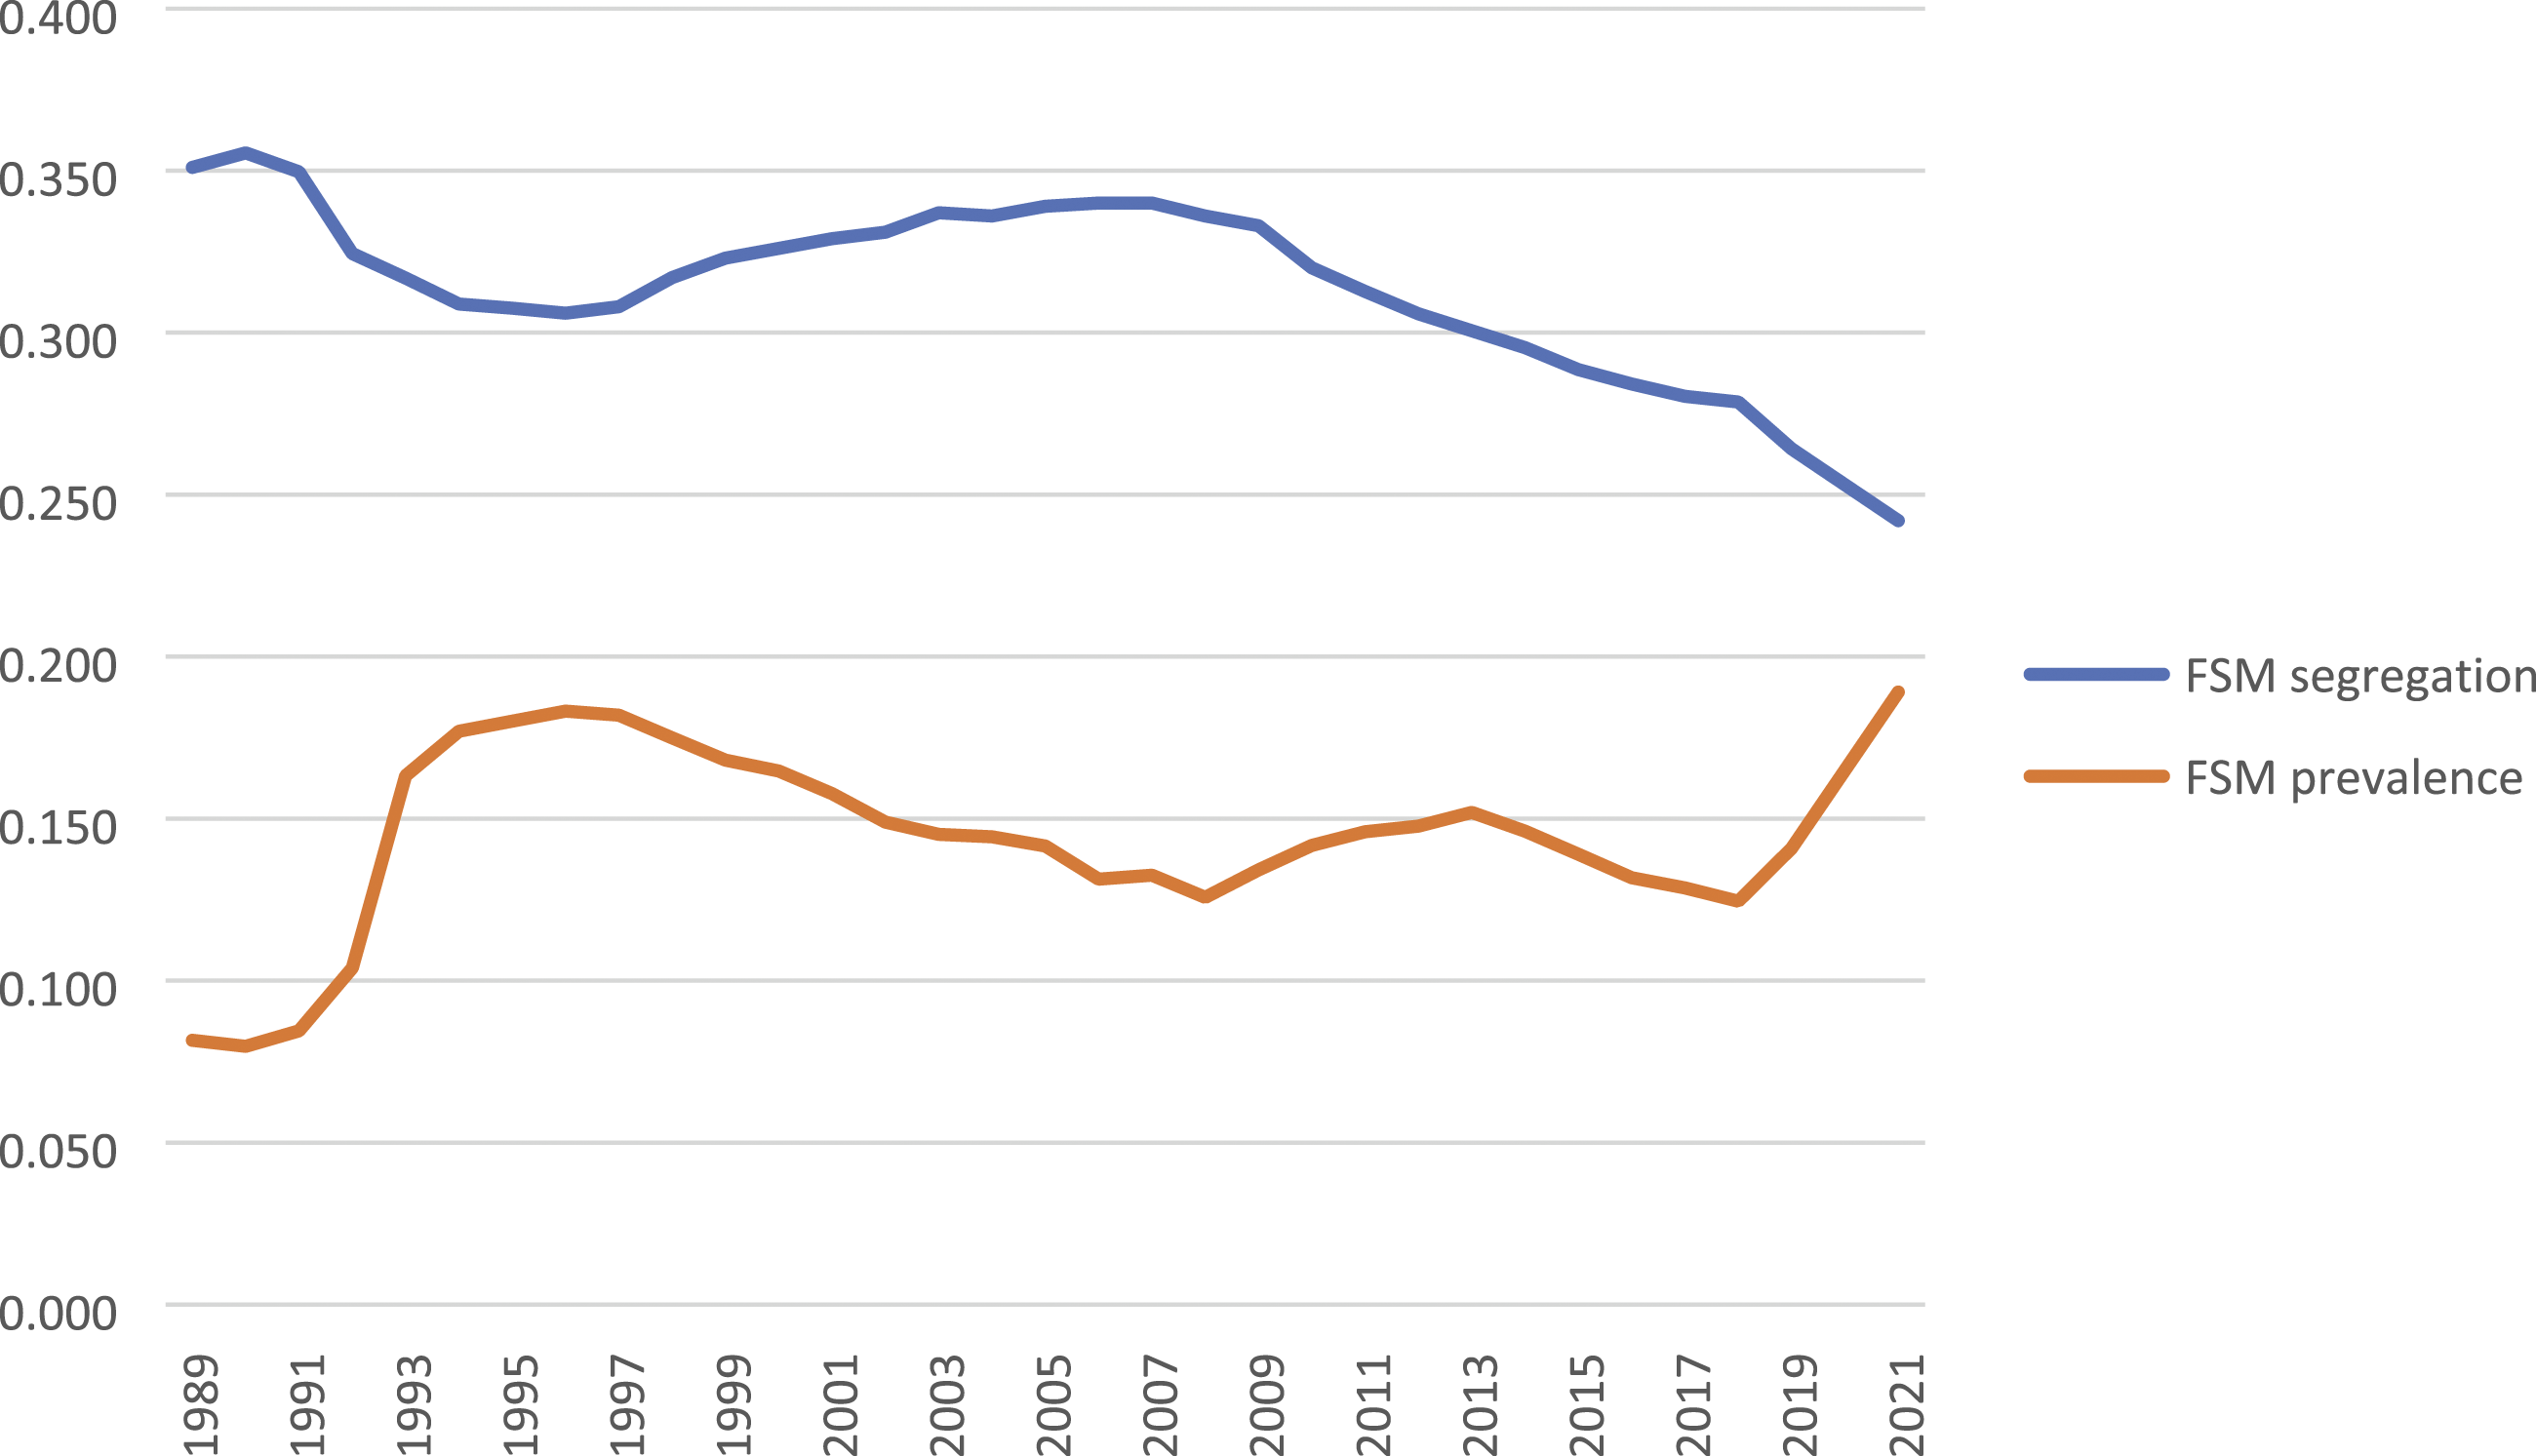
This change in segregation levels over time is
The one period in the time-series when the prevalence of disadvantage and its segregation between schools were not mirror images was from 2012 to around 2018. Both the number of children registered as FSM-eligible and their segregation between schools declined – for at least 6 years. As discussed in full in Gorard et al. (2022), this period coincides with the onset of the Pupil Premium Policy in England. This anomalous reversal of a historical pattern, that has otherwise held for as long as data is available, could well be due to the Pupil Premium funding given to schools from 2011 onwards.
From 2011, schools received additional funding for each pupil that was FSM-eligible (see above). It is feasible that secondary school intakes started to desegregate almost as soon as disadvantaged pupils were known to bring additional funding to schools, so making them “less unattractive to schools” to use the official phrasing. Most school leaders have reported that the new funding immediately affected their activities, although only a few felt that it had affected their admissions (Ofsted 2012). However, Freedman and Horner (2008) envisaged a kind of unconscious bias in the process of allocating school places, even within the existing guidelines. And these planners wanted to give “schools located in more disadvantaged communities the resources to attract middle-class parents” (p.9). In 2014, the government published a revised admissions code that permitted all admission authorities in England to prioritise disadvantaged children in their admission arrangements (Foster and Long 2020). The Pupil Premium funding may then have provided the incentive for such prioritisation. These changes in segregation could therefore be the result of the Pupil Premium, making poorer pupils seem “less unattractive” both consciously and unconsciously.
In order to show that the changes from 2011 to 2018 did not occur with other forms of segregation, Figure 2 shows the equivalent time series for the prevalence and segregation of pupils with special education needs or disability who had a statement of needs (SEN), or more recently who had an Education, Health and Care Plan (EHC). Here prevalence and segregation mirror each other to a lesser extent, and so are correspondingly more corelated (−0.83). From 1989 to 1996 the number of pupils in mainstream schools identified as having a special need grew - more than doubling. This is largely due to better diagnosis, and the policy of inclusion whereby many special schools were closed and their intakes moved to more mainstream settings. This is associated with a dramatic fall by 2006 in how segregated between schools these special needs children were. Prevalence of SEN/EHC and SEN/EHC segregation between schools, England, 1989–2021.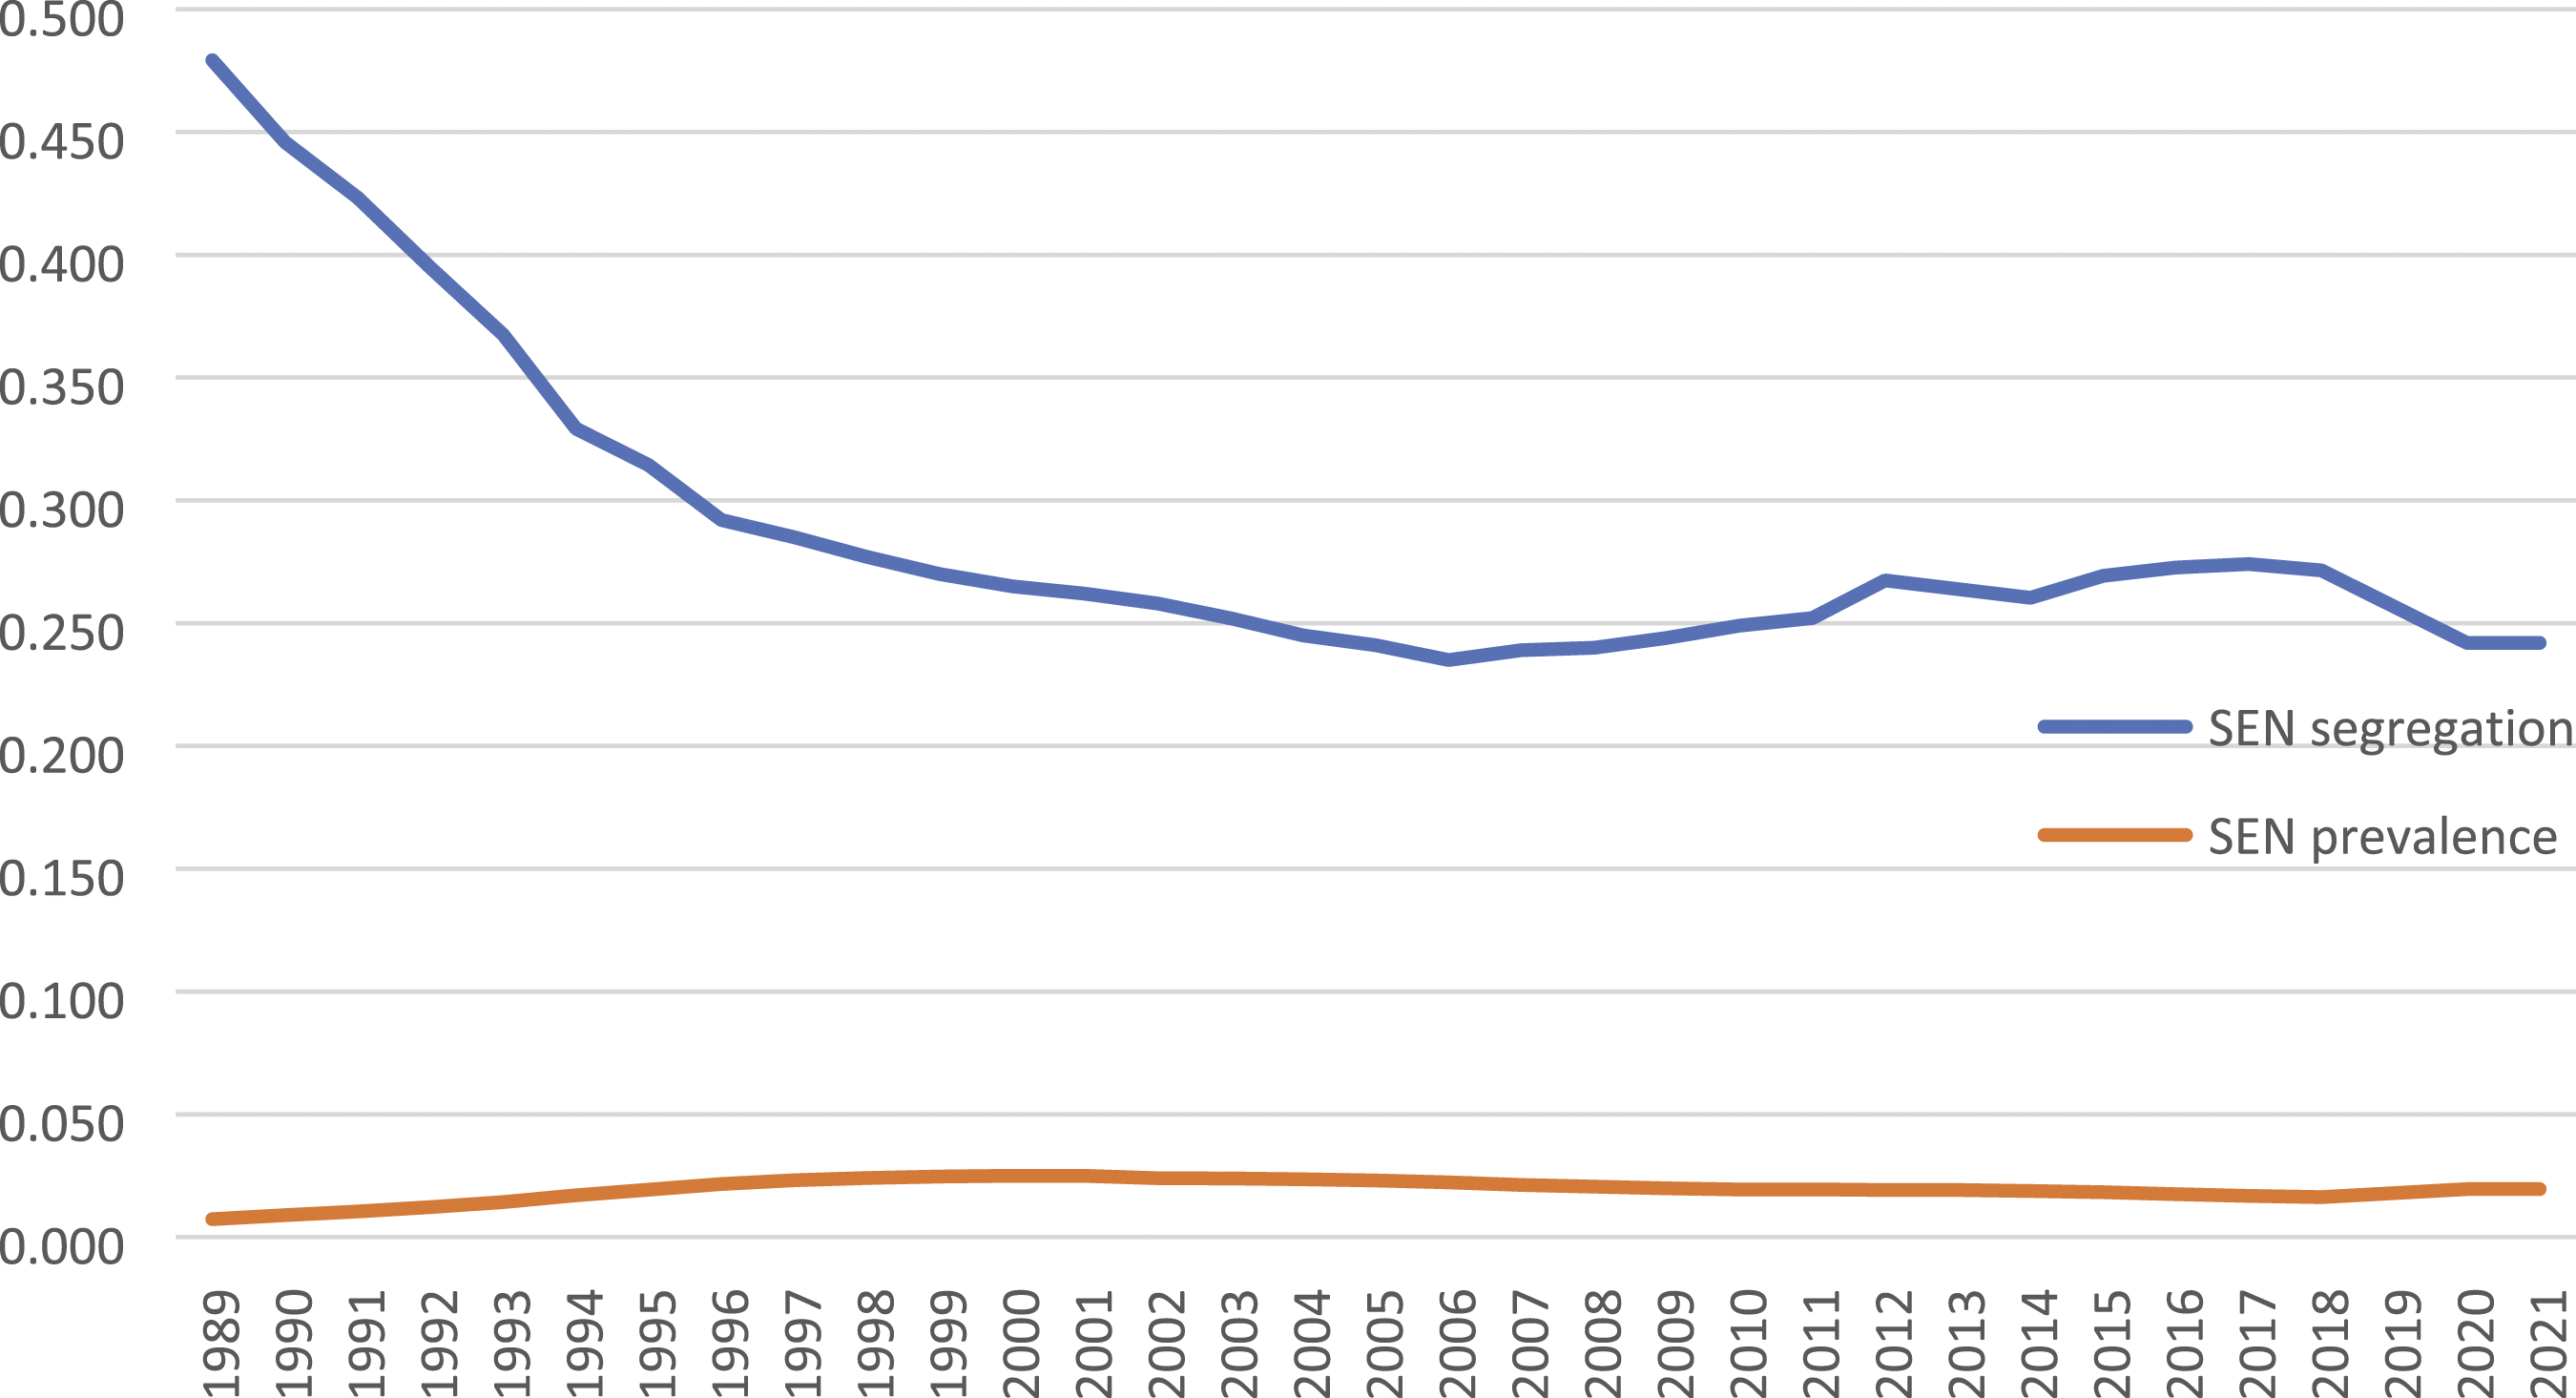
From 1997 onwards the number of SEN/EHC pupils has remained more stable, dipping slightly from 2007 to 2010, while segregation has varied considerably since 2010. There is no evidence here of the unusual and continuing decline of segregation that was noted for FSM-eligibility since 2011. This makes it more likely that the changes from 2011 in Figure 1
Discussion
Limitations
The new analysis in this paper for 2020-21 is based on school-level data concerning pupil eligibility for free school meals or not. It is, therefore, impossible to say anything about different year groups in schools, or about the patterns for different groups of disadvantaged pupils such as those permanently or only temporarily eligible for free school meals. The dataset does not include information on pupils living in care, and so these have to be ignored, except where they are also FSM-eligible. Perhaps the biggest problem, which we have solved elsewhere for years up to 2019 (e.g. Gorard, 2022), is that this data cannot be used to disentangle the impact of economic and policy changes to the proportion of FSM-eligible pupils, and the impact of something like Pupil Premium funding, on the pattern of segregation. Here, Pupil Premium funding is suggested as a part cause of declining segregation chiefly based on the period 2012–2018 when both declined, for the only time since records began. Segregation has continued to decline since 2019, and this must be at least partly due to the increase in FSM-eligibility created by transitional arrangements for Universal Credit, and perhaps an underlying increase in FSM-eligibility (although this is hard to discern because of the rule changes). However, there is clearly no sign that the decline in segregation noted since 2012 is stopping.
The importance of distributed pupil intakes
As shown in Gorard et al. (2022) and previously, there is a strong correlation between the level of poverty segregation between schools in any English school system (national, regional or local), and the poverty attainment gap. And this holds true internationally as well. When segregation declines, as it has done in England since 2011, the attainment gap also tends to drop – all other things being equal (see also Gorard et al. 2021 and Gorard 2022b). This is good for justice, equal life chances, and society, and fits in with government (and cross-administration) plans. A more even distribution of disadvantage between schools makes the whole school system fairer, and allows individual schools to focus their energy where it is most needed. Of course, other factors and policies can hinder this progress, such as the decision to make all statutory assessments in England harder from 2014–2016 (which increased the poverty attainment gap quite dramatically, as shown in Gorard et al. 2022).
Fairer schools systems will be open access (rather than selective in any way), and as similar as possible in structure and process across the system, even in well-developed school systems. School places should not be rigidly allocated in terms of nearby housing, lest the schools then reflect any local residential segregation by SES, ethnicity, or related student characteristics. School desegregation by SES may also involve the temporary use of bussing to school, or the use of lotteries to decide over-subscribed places at any school.
Money can then play an important further role in equalising the nature of school intakes. It is relatively easy to envisage how allocating money like Pupil Premium funding to schools on the basis of their disadvantaged pupil intakes might make such pupils less unattractive to schools in general, and so could reduce their historic clustering of such pupils in specific under-subscribed schools. Also, because schools in England can now use disadvantage as a positive criterion for allocating contested school places, the funding could have had an almost immediate (and continuing) impact on school intakes, both directly and by reducing any unconscious bias against potentially harder-to-teach pupils. This is not to say that this is what schools are doing. It has long been known that schools tend to favour local residents (via feeder schools, distance travelled and so on) when allocating contested places (Gorard et al. 2003 and Gorard 2018). The disadvantage criterion is newer and is likely only ever to affect a minority of school places. It is not envisaged so likely that schools with their fair share or more of disadvantaged pupils already would be affected consciously or unconsciously by the Pupil Premium.
One reason an over-subscribed school might be reluctant to offer places to poorer children (even if unconsciously) is that, on average, these pupils could be harder to teach. The extra funding given to schools as Pupil Premium can be used to implement evidence based catch-up programmes or pay for the cost of extra staff time in supporting poorer children. This is what makes the policy clever – it is both an incentive to desegregate, and a way of funding programmes to reduce the poverty gap.
Pupil Premium funding is currently the best explanation for the improvement in segregation, which suggests that the policy should be continued for the time being in England, and that similar schemes could be rolled out in more developed systems elsewhere on the basis of the overall evidence in its favour.
Footnotes
Declaration of conflicting interests
The author(s) declared no potential conflicts of interest with respect to the research, authorship, and/or publication of this article.
Funding
The author(s) received no financial support for the research, authorship, and/or publication of this article.