
Abstract
Objectives:
It is unclear how the incidence of each pediatric diabetes subtype changed during the COVID-19 pandemic. We assessed changes in the incidence of pediatric type 1 diabetes, pediatric type 2 diabetes, and prediabetes during the COVID-19 pandemic.
Methods:
We analyzed data from young people aged <19 years without prior diabetes in a large integrated US health care system from March 2017 through February 2023 using interrupted time-series analyses to compare prepandemic and pandemic rates and trends in the incidence of type 1 diabetes, type 2 diabetes, and prediabetes.
Results:
Of 288 574 pediatric patients, 242 were diagnosed with type 1 diabetes, 239 with type 2 diabetes, and 4438 with prediabetes. The incidence of type 1 diabetes did not change after pandemic onset in the interrupted time-series analysis. Although the incidence of type 2 diabetes and prediabetes changed with a single interruption analysis, an exploratory model of 2 interruptions revealed a better fit for each: for type 2 diabetes, the model showed a significant rise (128%; P < .001) and subsequent decrease after the early pandemic period; for prediabetes, it revealed a 142% increase (P = .005) with a rising trend (12% per month) early in the pandemic, followed by a 9% monthly downward trend.
Conclusion:
Among this population, the COVID-19 pandemic did not affect the incidence of pediatric type 1 diabetes but was associated with significant increases in the incidence of type 2 diabetes and prediabetes, particularly early in the pandemic. Future work can build on these results to better understand how pandemic-related factors, including activity restrictions and COVID-19 disease, affected rates of pediatric type 2 diabetes and prediabetes and inform future public health practices.
The COVID-19 pandemic, declared on March 11, 2020, and caused by the SARS-CoV-2 virus, led to widespread restrictions in the United States, including virtual schooling, face masking, and cancellations of sports among children and adolescents.1,2
Before the COVID-19 pandemic, in 2017-2018 in the United States, the incidence of type 1 diabetes was reported as 22.2 per 100 000 children and adolescents, rising approximately 2% per year, and the rate of type 2 diabetes was 17.9 per 100 000 children and adolescents, rising 5.3% annually.3,4 A meta-analysis of articles published through March 2022 indicated a 9.5% global rise in type 1 diabetes among children during the pandemic. 5 A report earlier in 2022 based on US health insurance claims data showed a twofold greater risk of diabetes among children diagnosed with COVID-19 infection as compared with those without a COVID-19 diagnosis. 6 Another study noted a 57% increase in the incidence of pediatric type 1 diabetes at a regional tertiary hospital in the first year of the COVID-19 pandemic when compared with previous years. 7 A study of type 1 and type 2 diabetes rates from 2016 to 2021 among young people aged <19 years in an integrated health care system indicated a rise in both during the pandemic. 8 Studies and case reports early in the pandemic alerted health care providers to potential unexpected medical complications resulting from the pandemic, including its effect on overall diabetes incidence.5-8 However, discrete rates of type 1 diabetes, type 2 diabetes, and prediabetes among children in a large, diverse, integrated health care system during an extended period have not been clearly delineated.
This study examined the incidence rates of type 1 diabetes, type 2 diabetes, and prediabetes in a large pediatric population during a 6-year period that included 3 pandemic years to clarify patterns of change over time in the incidence of each type of diabetes among young people aged <19 years. In an interrupted time series (ITS), a time series of a particular outcome is interrupted at a known point in time and analyzed to determine whether the interruption is associated with a change in the temporal pattern of observations. 9 Using ITS analyses, we sought to determine discrete changes in the incidence of type 1 diabetes, type 2 diabetes, and prediabetes among young people aged <19 years after the onset of the COVID-19 pandemic.
Methods
Cohort and Data
We extracted retrospective data from electronic health records and health insurance claims for young people aged <19 years who had ≥1 encounter at Kaiser Permanente Mid-Atlantic States (KPMAS), a large integrated health care system in the US mid-Atlantic region, from March 2017 through February 2023. The study population at each point in the time series (denominator) included patients who met the age and encounter criteria, had ≥4 months of continuous health plan membership (allowing for a gap of up to 3 months), and had no evidence of preexisting type 1 or type 2 diabetes. Preexisting diabetes was identified by diagnosis codes per the International Classification of Diseases, Ninth Revision, Clinical Modification 10 (250, diabetes mellitus) or International Classification of Diseases, Tenth Revision, Clinical Modification (ICD-10-CM 11 ; E10, type 1 diabetes mellitus; E11, type 2 diabetes mellitus) recorded before March 1, 2017, or by diabetes diagnoses documented in the electronic health record problem list within 90 days of enrollment for those who joined KPMAS after that date.
We identified incident cases (numerator) of type 1 and type 2 diabetes if we found ≥2 occurrences of any of the following: an ICD-10-CM diagnosis code (E10 or E11) 11 in the problem list, an encounter, a primary or principal hospital diagnosis, or a qualifying laboratory value (hemoglobin A1c >6.4). However, we excluded patients from the diabetes case definition if they had concomitant ICD-10-CM codes O24 (gestational diabetes), O99.891 (pregnancy-related diabetes), and N18 (diabetes secondary to chronic kidney disease) 11 because these codes represent alternative causes of hyperglycemia.
For prediabetes, we used a single occurrence among the following: ICD-10-CM diagnosis code R73.03 (prediabetes) or R73.09 (abnormal hemoglobin A1c) 11 in the problem list, an encounter, a primary or principal diagnosis, or qualifying laboratory data (hemoglobin A1c, 5.7-6.4). We conducted medical record reviews to validate all incident cases of type 1 and type 2 diabetes and a random subset of prediabetes and to validate diabetes type. In rare instances of conflicting diagnoses, a pediatrician reviewed medical records to determine a clinically appropriate diagnosis, with preference given to the diagnosis assigned by the patient’s endocrinologist. For patients diagnosed with type 1 and type 2 diabetes, we captured their initial diagnosis. For patients with prediabetes, we captured only their first prediabetes diagnosis, although they could subsequently develop type 1 or type 2 diabetes in our study. We calculated monthly incidence rates of type 1 diabetes, type 2 diabetes, and prediabetes separately as primary outcomes. We standardized all incidence rates per 100 000 people aged <19 years.
ITS and Statistical Analysis
We analyzed these monthly data during the 72 months of the study period using ITS modeling. To evaluate the association of the onset of the COVID-19 pandemic with trends in the incidence of all 3 subtypes of diabetes, we used Poisson segmented regression models with the total number of patients as an offset. We estimated incidence rate ratios (IRRs) from the ITS analyses for the 3 outcomes (type 1 diabetes, type 2 diabetes, and prediabetes). Our main model was a Poisson segmented regression model with level and slope change. The interruption date used in the main model was March 1, 2020, the month containing the official start of the COVID-19 pandemic.
We subsequently conducted exploratory analyses to consider more complex models to fit the data. We divided the study period into 3 segments: the period before the first interruption (March 1, 2017–July 31, 2020) or prepandemic, the first interruption period (August 1, 2020–July 31, 2021) or early pandemic, and the second interruption period (August 1, 2021–February 28, 2023) or later pandemic. We assumed a level and slope change for the 2 interruption periods and analyzed the full model and the most parsimonious model for the interruption segments by eliminating nonsignificant terms from the full model. We then applied the Bayesian information criterion (BIC) to test for the best-fitting model. 12 BIC is widely used for model selection, and a model with a lower BIC is preferred. 13
We conducted all analyses using R version 4.3.1 (R Core Team). All P values were from 2-sided tests, and we considered results to be significant at P < .05. To account for overdispersion and residual autocorrelation, we used the Newey–West method to estimate the SEs of model parameters. 14
This study was reviewed and approved (approval 2055381-1) by the KPMAS Institutional Review Board (FWA 00002344, IRB 00000783), with waivers of informed consent and Health Insurance Portability and Accountability Act authorization for research. It was conducted in accordance with applicable federal law via appropriately applied guidelines for minimal-risk data-only studies.
Results
Our cohort included 288 574 unique pediatric patients (Table): 242 were diagnosed with type 1 diabetes, 239 with type 2 diabetes, and 4438 with prediabetes. Sex, representation across the pediatric age spectrum and socioeconomic quartiles, and racial and ethnic diversity were evenly distributed in our population.
Characteristics of the final study population of young people aged <19 years at Kaiser Permanente Mid-Atlantic States after exclusions (N = 288 574), March 2017 through February 2023 a
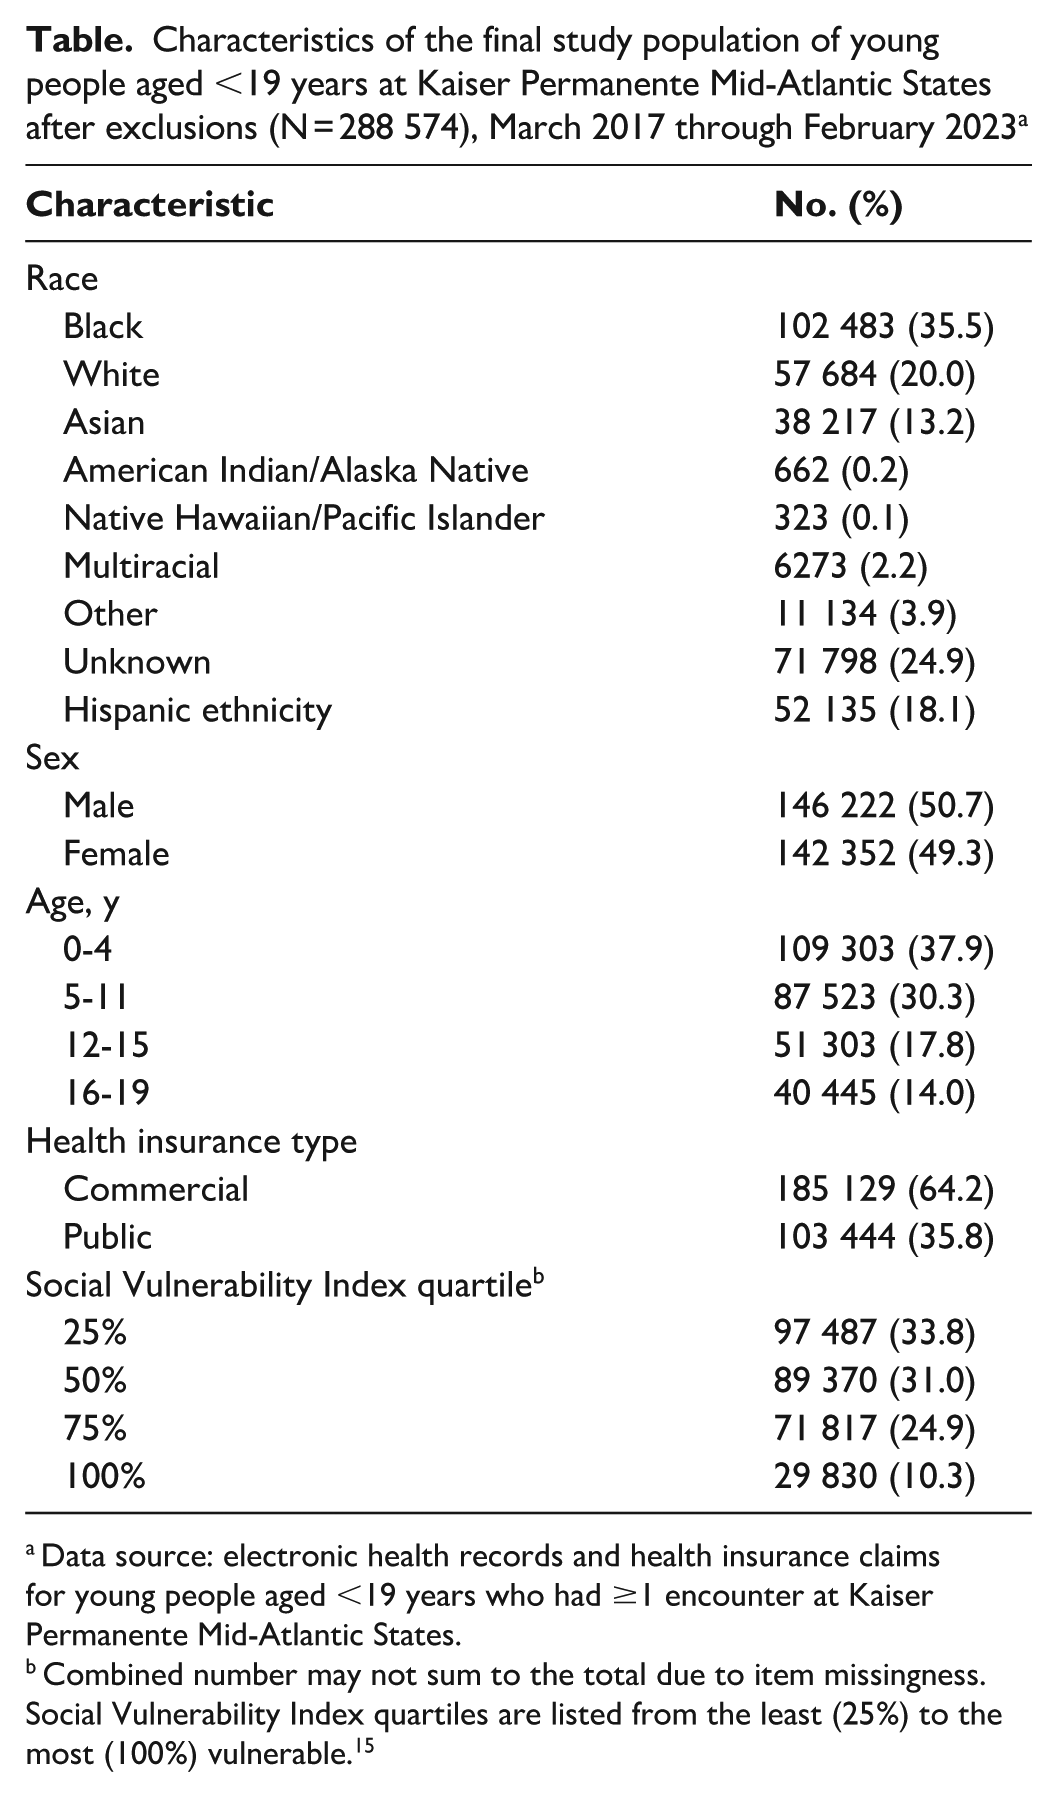
Data source: electronic health records and health insurance claims for young people aged <19 years who had ≥1 encounter at Kaiser Permanente Mid-Atlantic States.
Combined number may not sum to the total due to item missingness. Social Vulnerability Index quartiles are listed from the least (25%) to the most (100%) vulnerable. 15
Using our single-interruption main model, we calculated IRR estimates from the ITS analyses for the 3 outcomes (type 1 diabetes, type 2 diabetes, and prediabetes) before and after the interruption. We obtained observed monthly incidence rates per 100 000 people aged <19 years with predicted incidence rates of type 1 diabetes, type 2 diabetes, and prediabetes from Poisson regression for the main analyses. Using ITS analysis, we found that the monthly type 1 diabetes diagnosis rate did not change significantly at any time during the study period regardless of the pandemic onset interruption date (ie, level change: IRR = 0.97 [95% CI, 0.75-1.26]; P = .82) (Figure 1A; eTable 1 in the Supplement). From the monthly rates, we calculated an incidence rate of 18 to 27 cases per 100 000 people aged <19 years per year (eTable 2 in the Supplement).
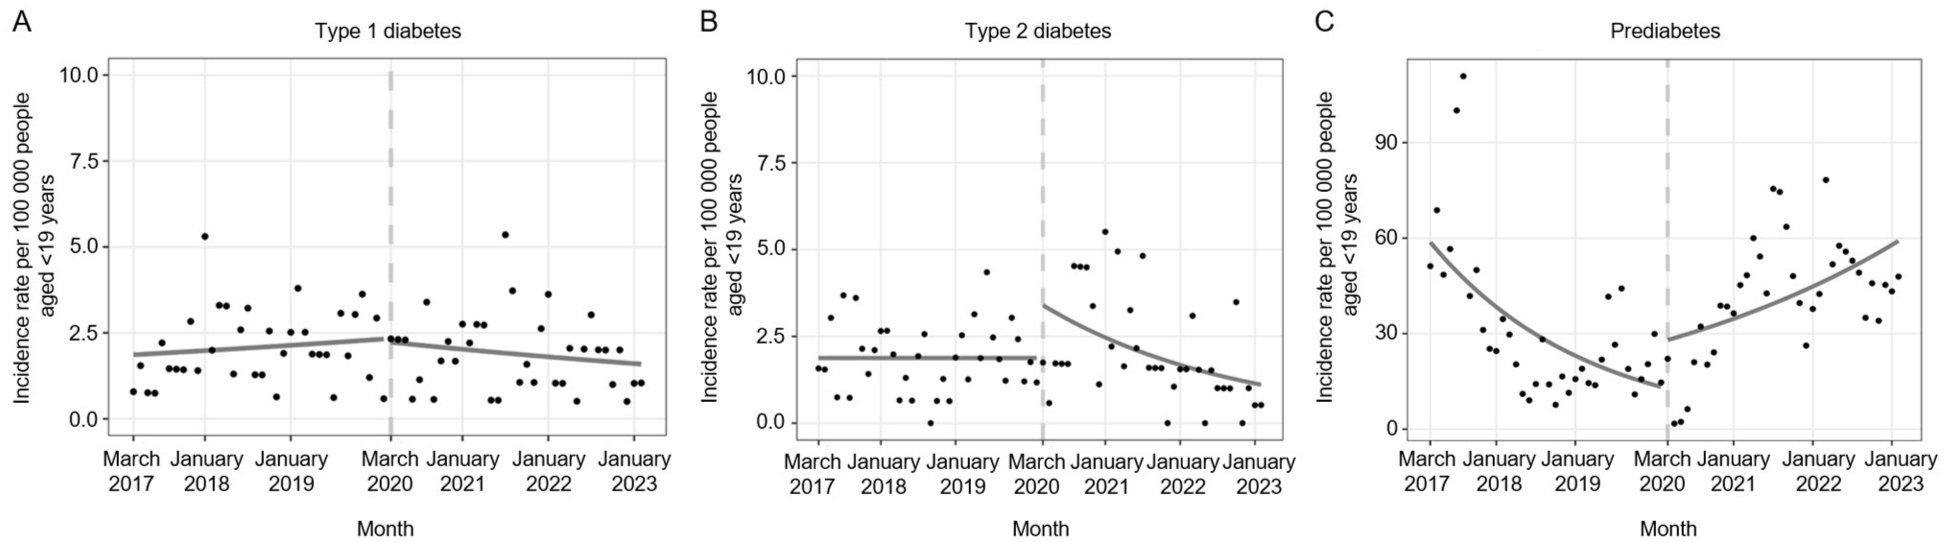
Main interrupted time-series analyses depicting incidence rates for (A) type 1 diabetes, (B) type 2 diabetes, and (C) prediabetes among young people aged <19 years within Kaiser Permanente Mid-Atlantic States from March 2017 through February 2023. Observed monthly incidence rates per 100 000 people aged <19 years are presented with dots, and predicted monthly incidence rates are depicted with solid lines. The predicted lines were obtained from segmented Poisson regression. Dashed vertical lines indicate interruption dates for the interrupted time-series analyses. Data source: electronic health records and health insurance claims for young people aged <19 years who had ≥1 encounter at Kaiser Permanente Mid-Atlantic States.
The apparent level increase in incidence of type 2 diabetes was not significant for the single-interruption main ITS model analysis, although the slope change was significantly different at P = .046 (Figure 1B; eTable 1 in the Supplement). The monthly diagnosis rate increased 87% (ie, level change: IRR = 1.87 [95% CI, 0.96-3.65]; P = .07) immediately after the pandemic, and every month following the onset of the pandemic was associated with a 3% decrease in the rate (ie, slope change: IRR = 0.97 [95% CI, 0.94-1.00]; P = .05) as compared with the trend before the pandemic.
The single-interruption main ITS model estimated that the monthly diagnosis rate of prediabetes decreased 4% each month (ie, baseline trend: IRR = 0.96 [95% CI, 0.93-0.99]; P = .004) before the onset of the pandemic (Figure 1C; eTable 1 in the Supplement). After the onset of the pandemic, the model estimated that the incidence rate increased 107% (ie, level change: IRR = 2.07 [95% CI, 0.64-6.65]; P = .22) as compared with the rate just before, but the level change was not significant. We found a significant upward trend change in the rate of prediabetes when compared with the trend before the pandemic (ie, slope change: IRR = 1.07 [95% CI, 1.02-1.12]; P = .007).
Exploratory Analyses
Visual inspection of the time-series trends from the main analysis suggested that instead of a single interruption in March 2020, a pattern of delayed onset of an increased incidence, followed by a reduced incidence, occurred for type 2 diabetes and prediabetes. Two interruption dates (August 1, 2020, and August 1, 2021) appeared to best fit the data.
We calculated IRR estimates from the 2-interruption exploratory analyses for the type 2 diabetes and prediabetes groups. Observed monthly incidence rates per 100 000 people aged <19 years with predicted incidence rates were obtained from the most parsimonious 2-interruption models for type 2 diabetes and prediabetes (Figure 2).
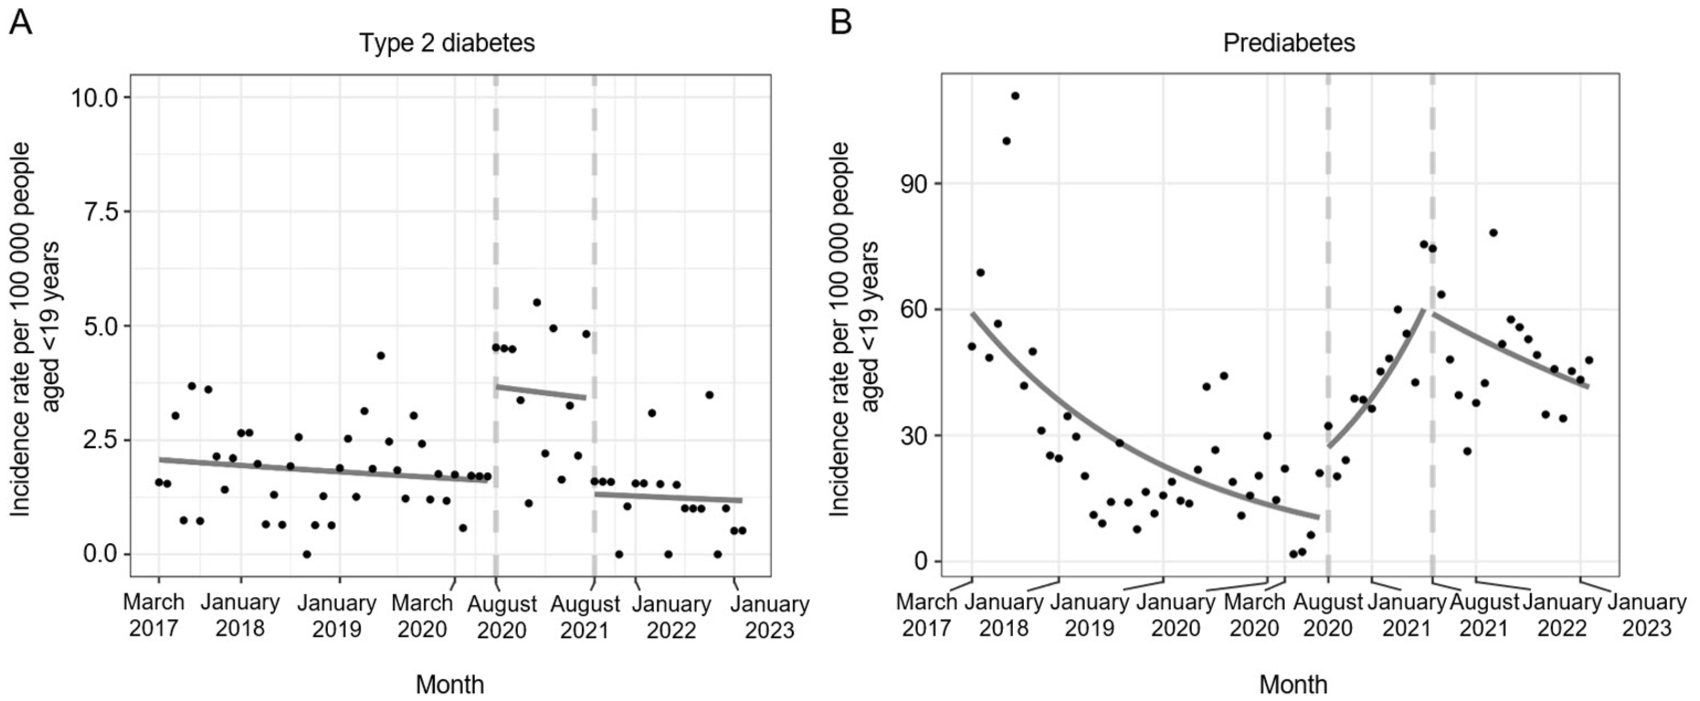
Exploratory interrupted time-series analyses depicting incidence rates for (A) type 2 diabetes and (B) prediabetes among young people aged <19 years within Kaiser Permanente Mid-Atlantic States from March 2017 through February 2023. Observed monthly incidence rates per 100 000 people aged <19 years are presented with dots, and predicted monthly incidence rates are indicated by solid lines. The predicted lines were obtained from segmented Poisson regression. Dashed vertical lines indicate interruption dates for the interrupted time-series analyses. Data source: electronic health records and health insurance claims for young people aged <19 years who had ≥1 encounter at Kaiser Permanente Mid-Atlantic States.
The parsimonious 2-interruption ITS model analysis showed that the monthly diagnosis rate of type 2 diabetes did not change significantly before the onset of the first interruption (ie, baseline trend: IRR = 0.99 [95% CI, 0.99-1.00]; P = .14) (Figure 2A; eTable 3 in the Supplement). During the early pandemic, the incidence rate increased 128% (ie, level change: IRR = 2.28 [95% CI, 1.61-3.23]; P < .001). We did not incorporate changes in trend in this model because they were not significant in the full model (IRR = 0.98 [95% CI, 0.95-1.01]; P = .14). After the onset of the second interruption, the parsimonious model demonstrated that the incidence rate decreased 61% immediately after the onset of the second interruption (IRR = 0.39 [95% CI, 0.29-0.52]; P < .001).
The parsimonious 2-interruption model indicated that the diagnosis rate for prediabetes decreased 4% each month (ie, baseline trend: IRR = 0.96 [95% CI, 0.94-0.98]; P < .001) before the first interruption of August 2020 (Figure 2B; eTable 4 in the Supplement). With the onset of the early pandemic and its associated restrictions, the model showed that the incidence rate increased 142% (ie, level change: IRR = 2.42 [95% CI, 1.30-4.50]; P = .005) immediately after the first interruption. During the early pandemic period, a significant trend change occurred in the rate of prediabetes as compared with the trend before the first interruption. Every month following the first interruption was associated with a 12% higher incidence rate (ie, slope change: IRR = 1.12 [95% CI, 1.07-1.18]; P < .001). A significant trend change occurred in the rate of prediabetes during the later pandemic period when compared with the early pandemic period. Every month following the onset of the second interruption in August 2021, the incidence rate decreased 9% versus the trend during the early pandemic (ie, slope change: IRR = 0.91 [95% CI, 0.86-0.96]; P = .001).
In comparing the single-interruption main and 2-interruption exploratory analysis models, the BIC preferred the models from the exploratory analysis. For type 2 diabetes, the models from the single-interruption main and 2-interruption exploratory analyses (parsimonious model) had BIC values of 312 and 292, respectively; for prediabetes, the models had BIC values of 1371 and 1096, respectively.
Discussion
Incidence rates of type 2 diabetes and prediabetes, not type 1 diabetes, rose among people aged <19 years during the COVID-19 pandemic. Other studies have suggested a rise in pediatric diabetes during the pandemic but relied on case reports or were reported in referral hospital settings.5,7 Few studies differentiated by each diabetes type or included prediabetes. Here, we used a strict definition of diabetes and excluded ICD-10-CM codes that attribute diabetes to other conditions. In so doing, we limited our case ascertainment. Nevertheless, we discovered an increase in type 2 diabetes and prediabetes cases in our population during the early pandemic period.
It is well understood that type 1 diabetes and type 2 diabetes are different disease processes, and in the current study, we found them to have different patterns. The Poisson single-interruption main model fit the data for type 1 diabetes and found no significant monthly change during the study period in our population. The calculated rate of 18 to 27 cases per 100 000 people aged <19 years per year in our sample was consistent with other US estimates.3,16 Our analyses did not find that children were at higher risk of developing type 1 diabetes during the COVID-19 pandemic as compared with prepandemic despite previous studies that suggested a causal link between diabetes and COVID-19.17,18 The presumed viral trigger for the onset of type 1 diabetes may have been delayed during the year of pandemic restrictions, although the following study year had ample opportunities for viral infections with no resulting increase in type 1 diabetes incidence.
Type 2 diabetes and prediabetes are conditions of insulin resistance. One could clinically understand prediabetes as a risk factor for type 2 diabetes were it to progress further. It is known that in recognizing prediabetes, a patient could reduce the risk for type 2 diabetes through lifestyle modifications.19-21 The early pandemic had a complex array of lifestyle changes along with exposure to a new virus with a potential metabolic impact. 22 Many of the early pandemic changes corresponded with increased body mass index among children and adolescents.23-25 In addition to a transition back to in-person school, the later pandemic saw the development of vaccines, viral mutations, and the resumption of group activities, including sports, which allowed for a return to more active and healthier lifestyles than earlier times in the pandemic. This change may have also affected diabetes incidence rates.
Although we cannot distinguish the effects of the SARS-CoV-2 virus from these nonviral changes, our exploratory analyses revealed important trends for type 2 diabetes and prediabetes, with 2 interruptions representing a temporary change. This 2-interruption model was demonstrated to be a better fit for our data than the single-interruption main model. The time lag may have allowed for the proliferation of COVID-19 and for the biological effect of infection and lifestyle changes to affect health. COVID-19 testing data initially did not include children and evolved to home testing, which did not necessarily become part of the health record; however, population-level data are available. COVID-19 case numbers in our region rose markedly in the first 4 months of the pandemic. 2 In addition, the early pandemic period corresponded generally with the time of pandemic restrictions throughout the mid-Atlantic region. The second interruption date was after a period of gradual reopening of in-person sports and other activities and roughly aligned with the return to in-person instruction offered in schools across our region.26-29 We recognize that the reopening dates differed in various communities and that some individuals were permitted to continue virtual schooling, and we were unable to measure these data for each patient. The return to in-person schooling made available a more active lifestyle for children and adolescents generally, which allowed for health status improvement for many. It is possible during the later pandemic that improvements in lifestyle allowed patients to avoid progression to type 2 diabetes and for a lower incidence of prediabetes.
Other studies have reported on the effects of the pandemic’s restrictions on children’s physical and mental health, particularly in body mass index.25,30-32 The trend in prediabetes for our members was similar to that of type 2 diabetes, with a sharp temporary increase during the early pandemic and a recovery afterward with a downward trend, although not yet reaching the baseline prepandemic rate during the study period. This temporal association occurred despite a background of ongoing and increasingly widespread COVID-19 exposure and infection. Although COVID-19 infection became more widespread over time, we did not see concomitant increases in incident type 2 diabetes and prediabetes; instead, we found decreases later in the pandemic. This finding suggests that something other than COVID-19 infection was contributing to these changes in glucose control in children, such as lifestyle changes later in the pandemic or an alternative mitigating factor.
Overall, our findings add to the literature by identifying temporal patterns of type 2 diabetes and prediabetes incidence. The subject of future research should include understanding why the incidence of type 2 diabetes and prediabetes rose during the early pandemic and which factors explain these patterns: the pandemic lifestyle, changes in nutrition or activity, viral infection, viral mutations, underlying patient risk factors, COVID-19 vaccines, or other.
Limitations
This study had several limitations. First, our population was based in the mid-Atlantic region of the United States and may not be generalizable to populations with policies that permitted in-person school and activities during the early pandemic. Second, the study was restricted to KPMAS members; therefore, it consisted of individuals who have access to health insurance and a robust health care system. Notably, the patients in this study were from diverse socioeconomic backgrounds, including one-third being publicly insured. Third, our sample size was restricted by membership; thus, our study may not have had the same statistical power as larger national studies. However, because our study sample was from a regional population, we believe that our data reflect a more accurate picture than tertiary hospital–level data alone or smaller samples.
Fourth, this study did not capture the onset of diabetes after the study period or whether it occurred outside the KPMAS service area or network-affiliated hospitals at the time of diagnosis. Patients with a >3-month lapse in membership or cessation of health insurance coverage were excluded from our study. In these situations, a diagnosis could have been missed. However, the pandemic circumstances included protections for continued health insurance coverage for children; as such, this effect was likely minimized.
Fifth, a testing bias existed where only those presenting for care were tested. Symptoms of type 1 and type 2 diabetes would, however, be difficult to ignore, and we assume that these patients would have sought care. Prediabetes could occur subclinically and could have been underestimated in our study. In addition, diagnosis depends on health care provider attention to prediabetes and diabetes screening and can vary.
Sixth, referral patterns and access to care were different during the early pandemic and may have resulted in more referrals to tertiary hospitals than primary care centers for children because community hospitals had a high census of patients with COVID-19, which limited access to care for other conditions. Access to preventive care was temporarily reorganized and underused initially but was fully available within 5 months of the pandemic’s start in our network. KPMAS pivoted to a virtual-first format initially but continued to provide access to urgent care, laboratory services, office care in certain centers, and ongoing hospital access. Because KPMAS includes a regional children’s hospital, we expect that we were able to capture a diabetes diagnosis when it occurred in our members.
Finally, for this study, we assumed that the entire pediatric population was similarly exposed to pandemic restrictions imposed at an unprecedented time. We were not able to stratify health plan members by lifestyle factors such as level of physical activity during the early pandemic or by attendance at in-person versus virtual school. Family structure, behavioral health factors, and nutrition likely played roles as well. This level of detail would be important to examine in future studies, as would longitudinal data for individual patients and the vulnerability of certain groups to the development of type 2 diabetes and prediabetes.
Conclusions
Our study suggests an association between the early COVID-19 pandemic and increased incidence of type 2 diabetes and prediabetes among young people. We did not find an association between type 1 diabetes and the COVID-19 pandemic. Future studies can build on these findings to better understand the relative contributions of environmental factors, including pandemic restrictions and/or COVID-19 disease, on rates of prediabetes and type 2 diabetes among young people.
Supplemental Material
sj-docx-1-phr-10.1177_00333549251403376 – Supplemental material for Trends in the Incidence of Pediatric Type 1 Diabetes, Type 2 Diabetes, and Prediabetes Before and During the COVID-19 Pandemic
Supplemental material, sj-docx-1-phr-10.1177_00333549251403376 for Trends in the Incidence of Pediatric Type 1 Diabetes, Type 2 Diabetes, and Prediabetes Before and During the COVID-19 Pandemic by Jeralyn Jacobs, Seohyun Kim, Yi-Shin Sheu, Karen Chesbrough, R. Clayton Bishop and Nancy S. Weinfield in Public Health Reports®
Footnotes
Acknowledgements
The authors thank the Mid-Atlantic Permanente Medical Group (MAPMG) and the Mid-Atlantic Permanente Research Institute for supporting this work as part of the MAPMG Physician Research Scholars Program.
Declaration of Conflicting Interests
The authors declared no potential conflicts of interest with respect to the research, authorship, and/or publication of this article.
Funding
The authors received no financial support for the research, authorship, and/or publication of this article.
Supplemental Material
Supplemental material for this article is available online. The authors have provided these supplemental materials to give readers additional information about their work. These materials have not been edited or formatted by Public Health Reports’s scientific editors and, thus, may not conform to the guidelines of the AMA Manual of Style, 11th Edition.
References
Supplementary Material
Please find the following supplemental material available below.
For Open Access articles published under a Creative Commons License, all supplemental material carries the same license as the article it is associated with.
For non-Open Access articles published, all supplemental material carries a non-exclusive license, and permission requests for re-use of supplemental material or any part of supplemental material shall be sent directly to the copyright owner as specified in the copyright notice associated with the article.