
Abstract
Objectives:
The Centers for Disease Control and Prevention/Agency for Toxic Substances and Disease Registry (CDC/ATSDR) Social Vulnerability Index (SVI) is used to guide policy making and resource allocation for emergency responses. However, limited research has explored the extent to which each variable contributes to the overall calculation of the SVI. We used a factor analysis approach to determine whether specific drivers of vulnerability exist at the state and national levels.
Methods:
We used the 2020 CDC/ATSDR SVI dataset to perform factor analysis separately for each state and nationally. We determined factor weights and scores and conducted a comparative analysis with CDC/ATSDR SVI. The final SVI for each census tract ranged from 0 to 1, with higher values indicating greater vulnerability.
Results:
At the national level, our factor analysis approach identified 4 primary variables that affected vulnerability the most: the percentage of the population below 150% of the federal poverty level (weight, 0.262), with housing cost burden (ie, households that spend >30% of their income on housing-related costs; weight, 0.226), in a racial and ethnic minority group (weight, 0.232), and without a high school diploma (weight, 0.138). However, at the state level, some analyses assigned low weights to the primary national-level drivers.
Conclusions:
Our study highlights the need to consider context-specific vulnerability measures when characterizing community social vulnerability. The factor analysis SVI provides nuanced insight into vulnerability drivers at the national and state levels, laying the groundwork for more precise disaster response planning, resource allocation, and community resilience initiatives.
Social vulnerability is a salient issue in the context of emerging infectious diseases and increasing frequency of natural disasters related to climate change. Social vulnerability is a term used by the Centers for Disease Control and Prevention (CDC) to describe the degree to which a community is at risk of harm from natural disasters or other hazards because of underlying factors such as poverty, lack of access to resources, and social marginalization. 1 CDC published the first iteration of the Social Vulnerability Index (SVI) database in 2011 in partnership with the Agency for Toxic Substances and Disease Registry (ATSDR) to identify communities that may be at increased risk of adverse health outcomes during public health emergencies. 2 Since then, the CDC/ATSDR SVI (hereinafter, SVI) has been applied broadly to identify socially vulnerable populations, allocate resources, and inform disaster response planning, most recently during the COVID-19 pandemic.3-6 We framed this study in the context of the SVI because of its widespread adoption in informing resource allocation during the COVID-19 response.7,8 Given the timely relevance of the SVI and demonstrated applicability in decision-making scenarios, it appeared to be the most suitable index for this study.
The 2020 SVI uses 16 census variables that can affect a community’s vulnerability 9 and operates on 2 principal assumptions. First, a latent factor of SVI, portrayed by the 16 variables, is used to collectively measure vulnerability. Second, these variables contribute equally to vulnerability. With the CDC/ATSDR approach, each variable is weighted equally in the calculation, contributing the same amount to the overall index score. 9 The SVI assigns equal weights to all variables, not based on an assumption of equal contribution to vulnerability, but rather to provide flexibility for various use cases. This design allows users to adjust the weights according to specific applications. In our analysis, however, we followed the assumption of equal weights as presented in the published index to better understand the contribution of individual variables to the index score. The SVI’s equal weighting approach may have limitations. First, it may overlook strong correlations between variables used in its calculation, risking an overemphasis of factors represented by multiple correlated measures and an underrepresentation of factors captured by fewer, less correlated measures. Second, it assumes that the influence of variables on vulnerability is consistent across the United States, overlooking any regional heterogeneity in how certain factors may affect vulnerability.
We therefore sought to explore an alternative approach to estimating SVI by using a single-factor analysis method. We maintained the assumption that a single latent factor is described by the 16 variables used by CDC/ATSDR, but we explored the effect of these measured variables on the latent vulnerability factor and the potential for variability in the effect of variables on SVI by state. We used a single-factor analysis to identify variables that are most heavily weighted in the calculation of the SVI and hypothesized that certain variables contribute more heavily to the overall SVI score than others and that these key drivers may vary from state to state.
Methods
Data
We used the 2020 CDC/ATSDR SVI database 10 as our source for this analysis because it provided the most recently updated data available at the time of the study. This dataset included census tract–level data describing the proportion of the population with associated variables in 4 areas: socioeconomic status (poverty, unemployment, housing cost, education, and health insurance), household characteristics (age >64 y, age <18 y, disability status, single-parent households, and English-language proficiency), racial and ethnic minority status (percentage of the census tract that is non-White), and housing type and transportation (multiunit structures, mobile homes, crowding, no vehicles, and group quarters) (Table). We removed census tracts that did not have an estimated total population or residential population.
Variables used in a factor analysis from the CDC/ATSDR SVI 2020 database with loading, uniqueness, and weight from the national-level factor analysis for each variable a
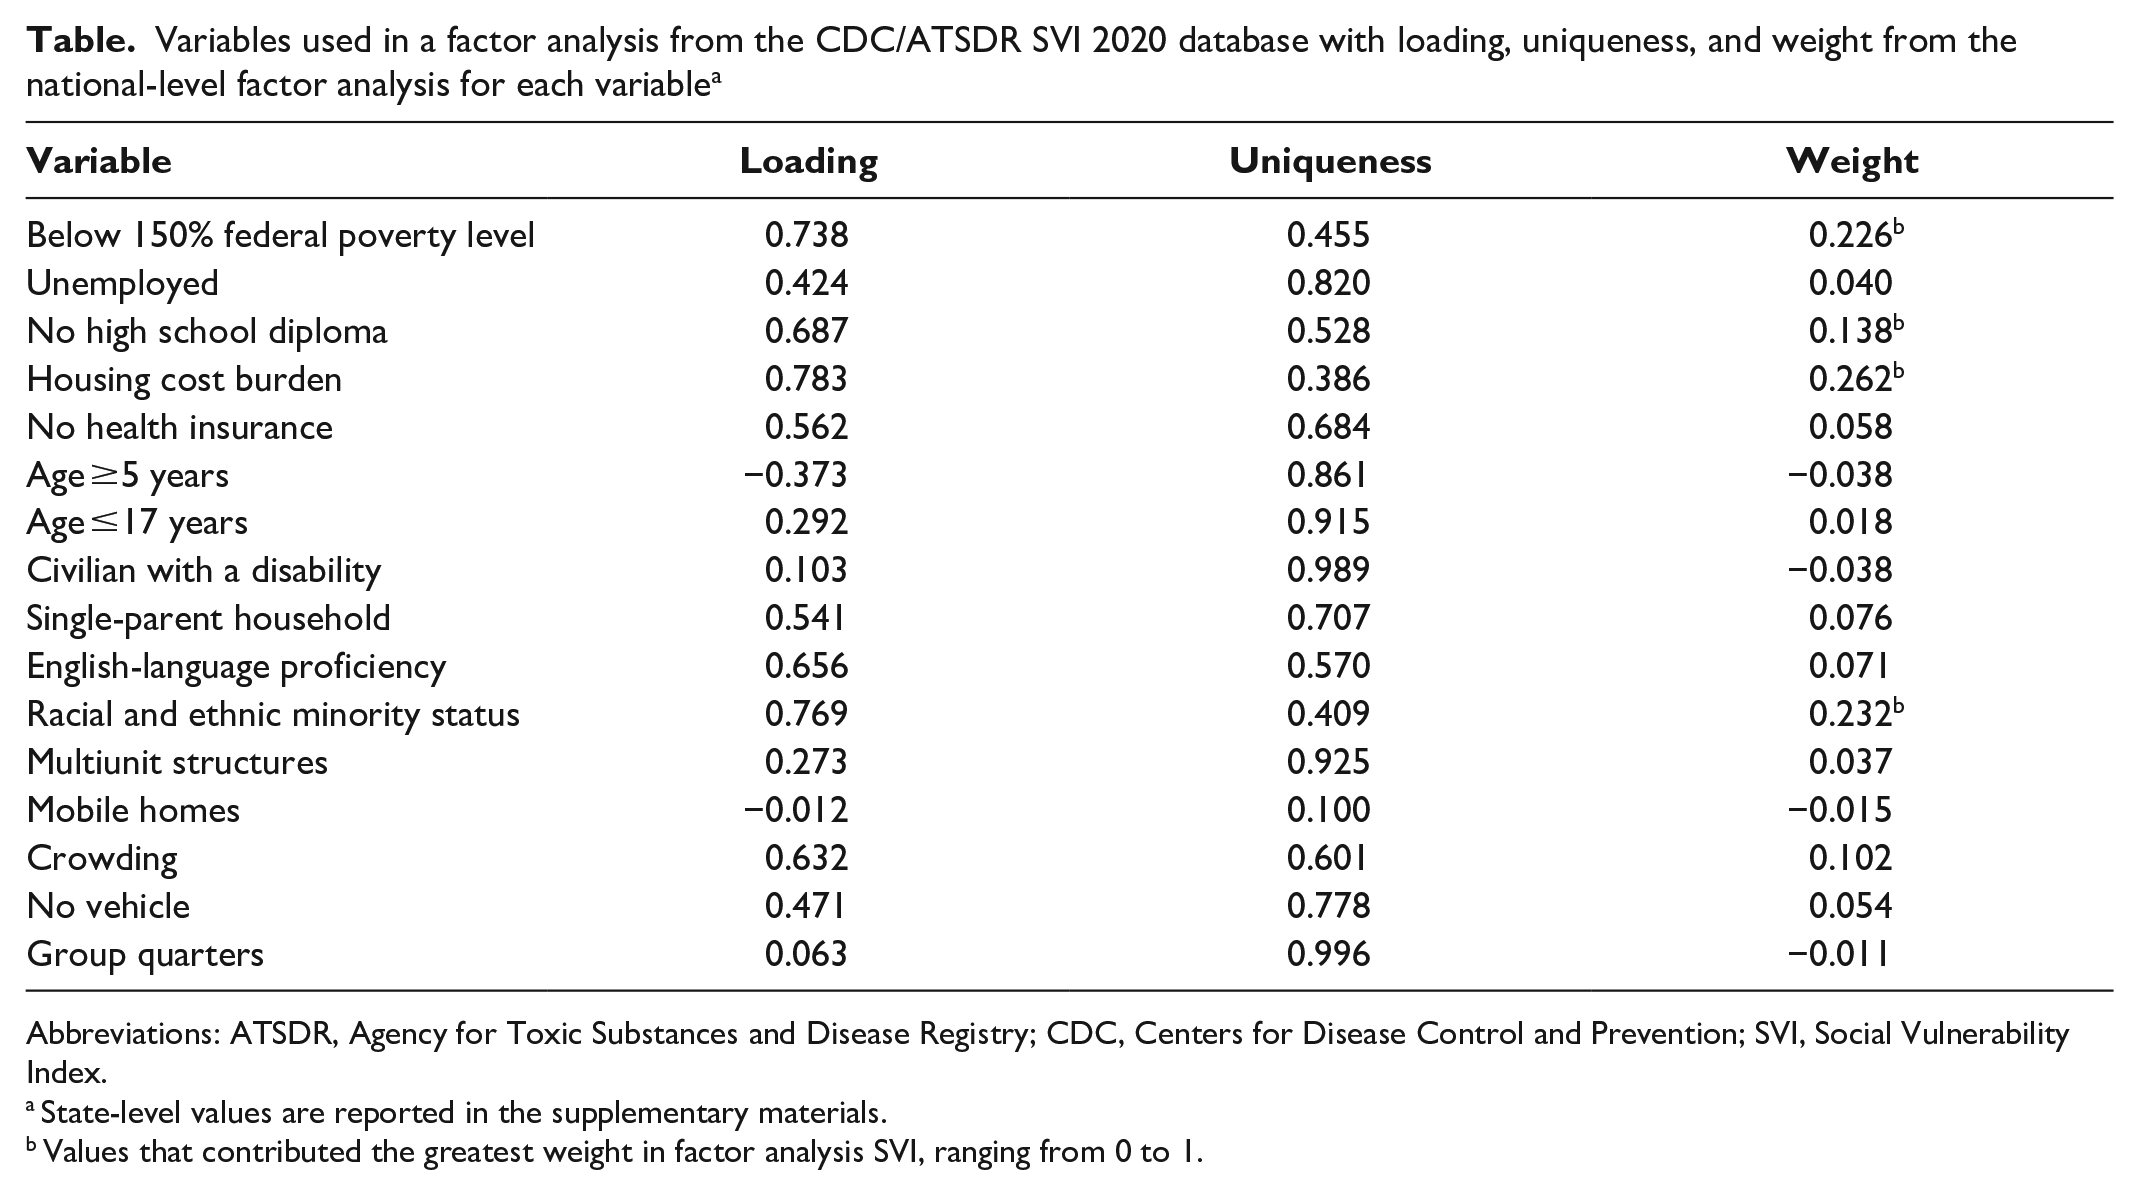
Abbreviations: ATSDR, Agency for Toxic Substances and Disease Registry; CDC, Centers for Disease Control and Prevention; SVI, Social Vulnerability Index.
State-level values are reported in the supplementary materials.
Values that contributed the greatest weight in factor analysis SVI, ranging from 0 to 1.
Statistical Methods
CDC/ATSDR SVI
To calculate the CDC/ATSDR SVI, we followed the methodology established by CDC.
9
Briefly, we ranked each census tract based on the 16 census tract variables (Table). We defined
Factor analysis SVI
We performed a single-factor analysis of the same variables used in the CDC/ATSDR SVI calculation. This approach assumed the existence of an underlying latent factor and that the observed census tract variables were correlated realizations of this latent variable. This approach means that for each census tract
Next, we normalized each
We calculated 1 factor analysis SVI using all the available census tracts in the United States. Additionally, we ran the factor analysis separately for each state, which allowed the analysis variables to have separate estimated weights for each state.
Statistics and Comparisons
We present the estimated factor weights for the nationwide analysis and for each state. We rescaled the
Results
We included 98.7% (83 331 of 84 414) of census tracts in the United States in the analysis after removing those without an estimated total population or residential population.
National Factor Analysis
In our national-level analysis, we calculated a KMO value of 0.80. The loadings, weights, and uniqueness for the national-level factor analysis are presented (Table), with weights being the most important metric in determining a variable’s effect on vulnerability. We identified 4 primary drivers of vulnerability at the national level from the census variables: percentage of the population without a high school diploma, in a racial and ethnic minority group, living below 150% of the federal poverty level, and with housing cost burden (ie, households that spend >30% of their income on housing-related costs). Among these variables, the percentage of the population with housing cost burden had the highest weight (0.262), followed by being in a racial and ethnic minority group (0.232), living below 150% of the federal poverty level (0.226), and not having a high school diploma (0.138) (eFigure1 in Supplemental Material, Table).
State-Level Factor Analysis
The state-level factor analysis found substantial variability in the magnitude of KMO values among states. KMO values ranged from 0.71 in Vermont to 0.88 in Connecticut (eFigure 2 in Supplemental Material). While many state-level drivers aligned with the national-level drivers of vulnerability—percentage of population in a racial and ethnic minority group, living below 150% of the federal poverty level, with housing cost burden, and without a high school diploma—our analysis uncovered unique patterns that diverged from these national-level trends. In 9 states, the influence of racial and ethnic minority status was less pronounced (weights <0.15); in 19 states, the influence of housing cost burden was less pronounced (weights <0.15); and in 40 states, the influence of a high school diploma was less pronounced (weights <0.15) (eFigure 1 in Supplemental Material).
Moreover, we observed variations in states where specific variables had higher weights than anticipated based on the national-level analysis:
• No vehicle (national-level weight, 0.05): Hawaii (0.33), Vermont (0.35), West Virginia (0.25), and Maine (0.28)
• No health insurance (national-level weight, 0.06): Texas (0.17), Utah (0.16), and Kansas (0.17)
• English-language proficiency (national-level weight, 0.07): Hawaii (0.22), New Hampshire (0.13), Oregon (0.13), and Texas (0.11)
These findings emphasize the complexity of vulnerability drivers at the state level, highlighting deviations from the national-level drivers of vulnerability across states (eFigure 1 in Supplemental Material).
Comparing Factor Analysis SVI With the CDC/ATSDR SVI
We found differences in the distributions of the national factor analysis SVI (rescaled to be between 0 and 1) and the CDC/ATSDR SVI (eFigure3 in Supplemental Material). As a result of how it was constructed, the CDC/ATSDR SVI was uniformly distributed on the interval [0,1], while the factor analysis SVI had a strong right skew, potentially providing greater insight into the relative vulnerability of communities.
Overall, we found a high degree of correlation between the CDC/ATSDR and the factor analysis SVI rankings for the national analysis (r = 0.84; P < .001) (Figure A) and state-level analysis (r = 0.92; P < .001) (Figure B). The factor analysis SVI tends to down-weight drivers that are ranked as being more vulnerable by the CDC/ATSDR SVI, and these drivers are more pronounced at the national level.
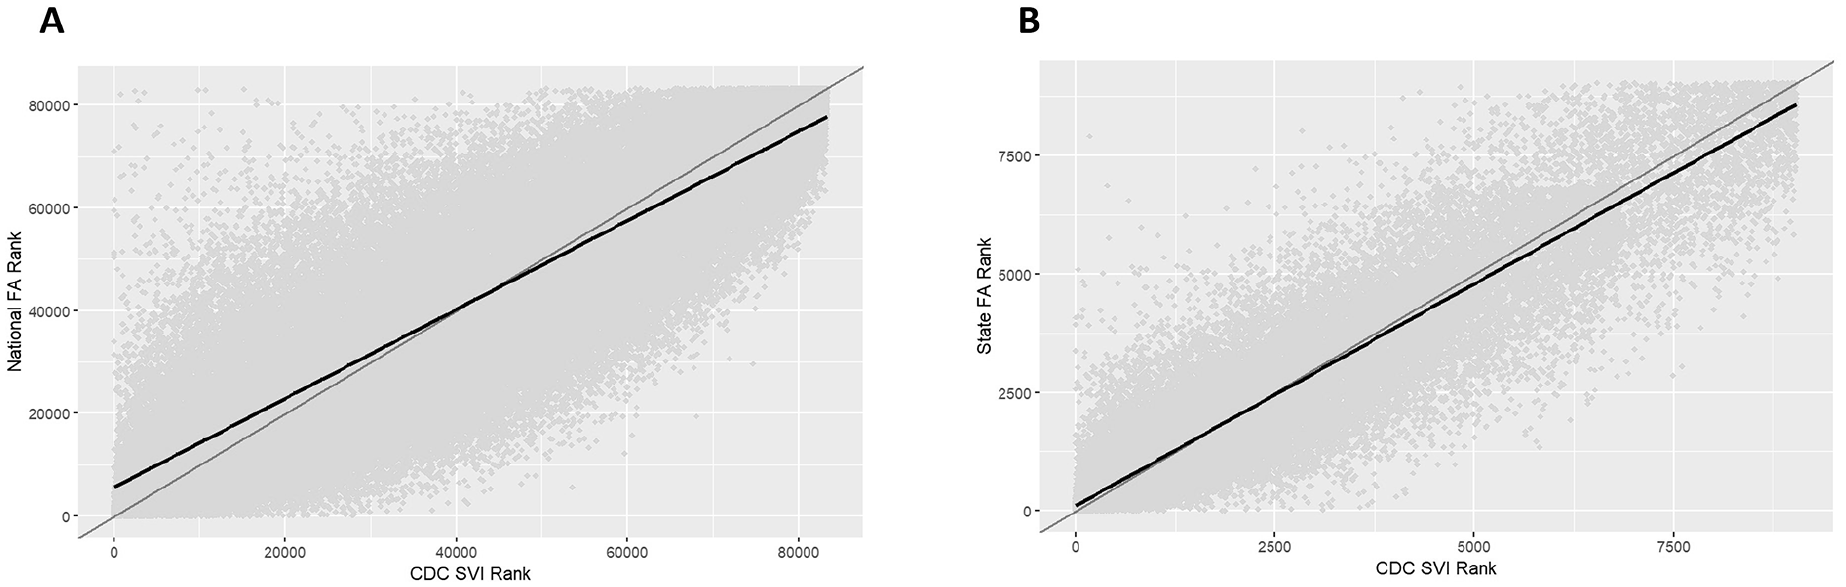
Comparison of the 2020 CDC SVI with the (A) national-level factor analysis SVI and (B) state-level factor analysis SVI. SVI scores for all methods are transformed to ranks in this comparison. The gray line indicates perfect correlation, and the black line is a best-fit line to the data. Abbreviations: CDC, Centers for Disease Control and Prevention; SVI, Social Vulnerability Index. Data source: Centers for Disease Control and Prevention/Agency for Toxic Substances and Disease Registry. 10
We considered the overlap between the top 10% most vulnerable communities identified by the factor analysis SVI and the CDC/ATSDR SVI. The top 10% most vulnerable communities were identified for factor analysis SVI, for CDC/ATSDR SVI, and for each state-level factor analysis SVI (eFigure 4A, 4B in Supplemental Material). Nationally, we observed patterns in regions of the United States and in the amount of agreement between the factor analysis SVI and the CDC/ATSDR SVI for identification of the most vulnerable communities. The overlap between the national factor analysis SVI and the CDC/ATSDR SVI ranged from 40.0% in Idaho and Wyoming to 79.2% in Rhode Island; for the state-level factor analysis, the SVI ranged from 36.7% in New Mexico to 79.3% in Connecticut (eTable in Supplemental Material). In general, the CDC/ATSDR SVI and factor analysis SVI scores tended to have the largest discrepancies in the census tract SVI in the South and West of the United States and greater agreement in the Midwest and parts of the Northeast (eFigure 4A, 4B in Supplemental Material).
Discussion
We present an alternative approach to estimating SVI using a single-factor analysis method. While some studies have compared vulnerability indices and explored their applicability in various contexts, 18 our analysis uniquely focused on the underlying drivers of vulnerability in the CDC/ATSDR SVI. Given the CDC/ATSDR SVI’s use in guiding resource allocation, this approach is particularly valuable for developing targeted intervention strategies that address a population’s unique needs. We also demonstrated substantial geographic variability in the predictors of vulnerability.
The significance of our approach lies in its ability to identify variability in vulnerability drivers at the national and state levels. Such distinctions can allow for precise identification of vulnerability, thus aiding in targeted disaster response planning and resource allocation. Our national-level analysis identified 4 critical vulnerability drivers: percentage of the population below 150% of the federal poverty level, percentage of households with housing cost burden, percentage of the population that is in a racial and ethnic minority group, and percentage of individuals without a high school diploma. Yet, our state-level analysis revealed state-level differences in these vulnerability indicators. Discrepancies in the national- and state-level analyses revealed that each state likely experienced different drivers of vulnerability.
This understanding of state variations in vulnerability drivers is pivotal. The CDC/ATSDR SVI’s equal weighting of variables may overlook certain state-specific factors and overemphasize other less important factors in a state or census tract. These differences could be consequential in the allocation of resources, policy making, and interventions for improving community resilience, especially in areas such as the South and the West, areas known for their diverse population composition, economic conditions, and geographic constraints. While our study cannot be definitive about these differences, it begs further investigation into these differences, including external validation and multidimensional factor analysis. Our study also addressed an essential concern in the evaluation of the SVI: whether the most vulnerable communities are identified. Notably, we observed discrepancies between the 10% most vulnerable communities identified by the CDC/ATSDR SVI and those identified by the factor analysis SVI. These differences may stem from state variations in key vulnerability factors, underscoring the need for an approach that recognizes and addresses these variations. This tailored approach ensures that the most socially vulnerable communities receive priority in emergency preparedness and response. For example, in Hawaii, the lack of personal vehicles emerged as a primary driver of vulnerability. In the wake of the 2023 fires in Maui, officials in the area may consider access to transportation as a priority for rebuilding and emergency preparedness efforts. Such efforts may theoretically lessen the effect of a similar emergency on the most socially vulnerable communities. Similarly, in Kansas and Texas, the high rates of uninsured people, partly because of the nonexpansion of Medicaid, 19 are prominent drivers of vulnerability. Theoretical scenarios suggest that expanding Medicaid in these states could reduce susceptibility to disasters. These insights from the factor analysis SVI emphasize the importance of not only identifying state-specific vulnerability factors but also considering strategies that could mitigate these vulnerabilities in emergency scenarios.
Limitations
The factor analysis SVI approach had several limitations. First, at the national level, the number of census tracts for each state varies widely, which could skew factor loadings (eFigure 5 in Supplemental Material) in the analysis so that states with a high number of census tracts (California) are more represented than states with fewer census tracts (Rhode Island). A state-level analysis accommodated for this limitation. Second, we lacked a validation method to understand which SVI measure is most indicative of true vulnerability but, rather, compared our estimates of SVI with those currently used by CDC. Further validation studies are needed to ascertain the ability of these SVI measures to accurately identify communities most affected by natural disasters and other hazards. Third, a single factor does not represent the information from all 16 variables based on the uniqueness (eFigure 6 in Supplemental Material), such as the percentage of mobile homes (1.00), the percentage of in-group quarters (0.996), and the percentage of civilian noninstitutionalized population with disability (0.989). Moreover, a single factor does not represent all the information in the 16 variables that could be related to SVI. Factor analysis revealed that using 2 or even 3 factors might be required to describe the variability in the data. Finally, while our analysis covered 98.7% of census tracts in the United States, we intentionally excluded census tracts without any population. We based this decision on the premise that uninhabited tracts do not contribute to the SVI in a meaningful way, because the SVI aims to assess and address the needs of human populations in the face of disasters and emergencies.
Conclusions
We used factor analysis to identify variables that contribute more weight to SVI than the CDC/ASTDR SVI method, which may more effectively identify drivers of vulnerability. Our state-level analyses are particularly relevant to state disaster response and community resilience planning. We underscore the need for a nuanced understanding of social vulnerability and the crucial importance of contextualizing vulnerability in specific geographic and sociodemographic settings. Our methodology offers the potential for providing more accurate data to guide decision-making in disaster response and community resilience, illuminating the importance of nuanced, region-specific measures of vulnerability.
Supplemental Material
sj-docx-1-phr-10.1177_00333549251313986 – Supplemental material for Rethinking Vulnerability: Using Factor Analysis to Assess Census Tract–Level Vulnerability
Supplemental material, sj-docx-1-phr-10.1177_00333549251313986 for Rethinking Vulnerability: Using Factor Analysis to Assess Census Tract–Level Vulnerability by Cole Jurecka, Eric Cavana, Yanjia Zhang, Elizabeth A. Erdman, Pallavi Aytha Swathi, Joshua A. Barocas and Laura F. White in Public Health Reports®
Supplemental Material
sj-jpg-5-phr-10.1177_00333549251313986 – Supplemental material for Rethinking Vulnerability: Using Factor Analysis to Assess Census Tract–Level Vulnerability
Supplemental material, sj-jpg-5-phr-10.1177_00333549251313986 for Rethinking Vulnerability: Using Factor Analysis to Assess Census Tract–Level Vulnerability by Cole Jurecka, Eric Cavana, Yanjia Zhang, Elizabeth A. Erdman, Pallavi Aytha Swathi, Joshua A. Barocas and Laura F. White in Public Health Reports®
Supplemental Material
sj-jpg-6-phr-10.1177_00333549251313986 – Supplemental material for Rethinking Vulnerability: Using Factor Analysis to Assess Census Tract–Level Vulnerability
Supplemental material, sj-jpg-6-phr-10.1177_00333549251313986 for Rethinking Vulnerability: Using Factor Analysis to Assess Census Tract–Level Vulnerability by Cole Jurecka, Eric Cavana, Yanjia Zhang, Elizabeth A. Erdman, Pallavi Aytha Swathi, Joshua A. Barocas and Laura F. White in Public Health Reports®
Supplemental Material
sj-jpg-7-phr-10.1177_00333549251313986 – Supplemental material for Rethinking Vulnerability: Using Factor Analysis to Assess Census Tract–Level Vulnerability
Supplemental material, sj-jpg-7-phr-10.1177_00333549251313986 for Rethinking Vulnerability: Using Factor Analysis to Assess Census Tract–Level Vulnerability by Cole Jurecka, Eric Cavana, Yanjia Zhang, Elizabeth A. Erdman, Pallavi Aytha Swathi, Joshua A. Barocas and Laura F. White in Public Health Reports®
Supplemental Material
sj-jpg-8-phr-10.1177_00333549251313986 – Supplemental material for Rethinking Vulnerability: Using Factor Analysis to Assess Census Tract–Level Vulnerability
Supplemental material, sj-jpg-8-phr-10.1177_00333549251313986 for Rethinking Vulnerability: Using Factor Analysis to Assess Census Tract–Level Vulnerability by Cole Jurecka, Eric Cavana, Yanjia Zhang, Elizabeth A. Erdman, Pallavi Aytha Swathi, Joshua A. Barocas and Laura F. White in Public Health Reports®
Supplemental Material
sj-png-2-phr-10.1177_00333549251313986 – Supplemental material for Rethinking Vulnerability: Using Factor Analysis to Assess Census Tract–Level Vulnerability
Supplemental material, sj-png-2-phr-10.1177_00333549251313986 for Rethinking Vulnerability: Using Factor Analysis to Assess Census Tract–Level Vulnerability by Cole Jurecka, Eric Cavana, Yanjia Zhang, Elizabeth A. Erdman, Pallavi Aytha Swathi, Joshua A. Barocas and Laura F. White in Public Health Reports®
Supplemental Material
sj-png-3-phr-10.1177_00333549251313986 – Supplemental material for Rethinking Vulnerability: Using Factor Analysis to Assess Census Tract–Level Vulnerability
Supplemental material, sj-png-3-phr-10.1177_00333549251313986 for Rethinking Vulnerability: Using Factor Analysis to Assess Census Tract–Level Vulnerability by Cole Jurecka, Eric Cavana, Yanjia Zhang, Elizabeth A. Erdman, Pallavi Aytha Swathi, Joshua A. Barocas and Laura F. White in Public Health Reports®
Supplemental Material
sj-png-4-phr-10.1177_00333549251313986 – Supplemental material for Rethinking Vulnerability: Using Factor Analysis to Assess Census Tract–Level Vulnerability
Supplemental material, sj-png-4-phr-10.1177_00333549251313986 for Rethinking Vulnerability: Using Factor Analysis to Assess Census Tract–Level Vulnerability by Cole Jurecka, Eric Cavana, Yanjia Zhang, Elizabeth A. Erdman, Pallavi Aytha Swathi, Joshua A. Barocas and Laura F. White in Public Health Reports®
Footnotes
Correction (August 2025):
This article has been updated with minor grammatical or style corrections since its original publication.
Declaration of Conflicting Interests
The authors declared no potential conflicts of interest with respect to the research, authorship, and/or publication of this article.
Funding
The authors disclosed receipt of the following financial support for the research, authorship, and/or publication of this article: This work was supported by the National Institutes of Health (R35GM141821 to L.F.W. and Y.Z.) and the National Institute on Drug Abuse (DP2DA051864 to J.A.B., C.J., and P.A.S. and K01DA051684 to J.A.B.).
Supplemental Material
Supplemental material for this article is available online. The authors have provided these supplemental materials to give readers additional information about their work. These materials have not been edited or formatted by Public Health Reports’s scientific editors and, thus, may not conform to the guidelines of the AMA Manual of Style, 11th Edition.
References
Supplementary Material
Please find the following supplemental material available below.
For Open Access articles published under a Creative Commons License, all supplemental material carries the same license as the article it is associated with.
For non-Open Access articles published, all supplemental material carries a non-exclusive license, and permission requests for re-use of supplemental material or any part of supplemental material shall be sent directly to the copyright owner as specified in the copyright notice associated with the article.