
Abstract
Objectives:
In the United States, hepatitis C is the most commonly reported bloodborne infection. It is a leading cause of liver cancer and death from liver disease and imposes a substantial burden of hospitalization. We sought to describe regional differences in hepatitis C virus (HCV)–related hospitalizations during 2012 through 2019 to guide planning for hepatitis C elimination.
Methods:
We analyzed discharge data from the National Inpatient Sample for 2012 through 2019. We considered hospitalizations to be HCV-related if (1) hepatitis C was the primary diagnosis or (2) hepatitis C was any secondary diagnosis and the primary diagnosis was a liver disease–related condition. We analyzed demographic and clinical characteristics of HCV-related hospitalizations and modeled the annual percentage change in HCV-related hospitalization rates, nationally and according to the 9 US Census Bureau geographic divisions.
Results:
During 2012-2019, an estimated 553 900 HCV-related hospitalizations occurred in the United States. The highest hospitalization rate (34.7 per 100 000 population) was in the West South Central region, while the lowest (17.6 per 100 000 population) was in the West North Central region. During 2012-2019, annual hospitalization rates decreased in each region, with decreases ranging from 15.3% in the East South Central region to 48.8% in the Pacific region. By type of health insurance, Medicaid had the highest hospitalization rate nationally and in all but 1 geographic region.
Conclusions:
HCV-related hospitalization rates decreased nationally and in each geographic region during 2012-2019; however, decreases were not uniform. Expanded access to direct-acting antiviral treatment in early-stage hepatitis C would reduce future hospitalizations related to advanced liver disease and interrupt HCV transmission.
Keywords
Hepatitis C virus (HCV) infection increases the risk for liver disease, cancer, and death. From January 2017 through March 2020, an estimated 2.2 million adults in the United States had current HCV infection. 1 From 2012 through 2019, the annual estimated number of new acute HCV infections in the United States increased 133%, while the rate of acute HCV infections more than doubled. 2 Although most people with acute infection go on to develop chronic hepatitis C, they frequently remain asymptomatic for decades and might not seek care until they have already developed severe sequelae, such as decompensated cirrhosis or hepatocellular carcinoma. 3
Hepatitis C imposes a substantial hospitalization burden on the US health care system. A recent analysis identified a steady decrease in the annual HCV-related hospitalization rate nationally in the United States through 2019 after release of direct-acting antiviral agents (DAAs) in 2013; however, national decreases in hospitalization rates were not observed equally among categories of age, race and ethnicity, or health insurance. 4 In the same analysis, the largest national increases in HCV-related hospitalization rates from 2000 through 2019 occurred among adults aged 55-64 years, Medicaid recipients, and non-Hispanic Black people. 4
Because access to DAAs has been limited by health insurer–implemented treatment restrictions (eg, fibrosis, sobriety, prescriber restrictions) that have varied geographically over time, 5 we hypothesized that HCV-related hospitalization rates would differ across the United States at the regional level. To reduce hepatitis C morbidity and mortality, health departments, health care systems, and policy makers may use regional data to understand the scope of their current hepatitis C prevalence, develop focused interventions, optimize allocation of resources, and track progress over time. We sought to describe regional differences in HCV-related hospitalization rates, demographic and comorbidity characteristics among HCV-related hospitalizations, and trends in HCV-related hospitalizations during 2012-2019 to guide planning for hepatitis C interventions and elimination.
Methods
We used data from the National Inpatient Sample (NIS), a database developed for the Healthcare Cost and Utilization Project and sponsored by the Agency for Healthcare Research and Quality. The NIS is the largest publicly available all-payer inpatient health care database in the United States, approximating a 20% stratified sample of discharges from US community hospitals, excluding rehabilitation and long-term acute care hospitals. 6 Hospitalizations are the unit of observation in the NIS. This analysis used deidentified public use data and did not require institutional review board approval per the policy of the Centers for Disease Control and Prevention.
The NIS uses US Census Bureau divisions 7 for geographic categorizations; this classification scheme became available in the NIS database beginning in 2012. 8 The 9 geographic divisions are New England (Connecticut, Maine, Massachusetts, New Hampshire, Rhode Island, Vermont), Middle Atlantic (New Jersey, New York, Pennsylvania), East North Central (Illinois, Indiana, Michigan, Ohio, Wisconsin), West North Central (Iowa, Kansas, Minnesota, Missouri, Nebraska, North Dakota, South Dakota), South Atlantic (Delaware, District of Columbia, Florida, Georgia, Maryland, North Carolina, South Carolina, Virginia, West Virginia), East South Central (Alabama, Kentucky, Mississippi, Tennessee), West South Central (Arkansas, Louisiana, Oklahoma, Texas), Mountain (Arizona, Colorado, Idaho, Montana, Nevada, New Mexico, Utah, Wyoming), and Pacific (Alaska, California, Hawaii, Oregon, Washington) (Figure 1).
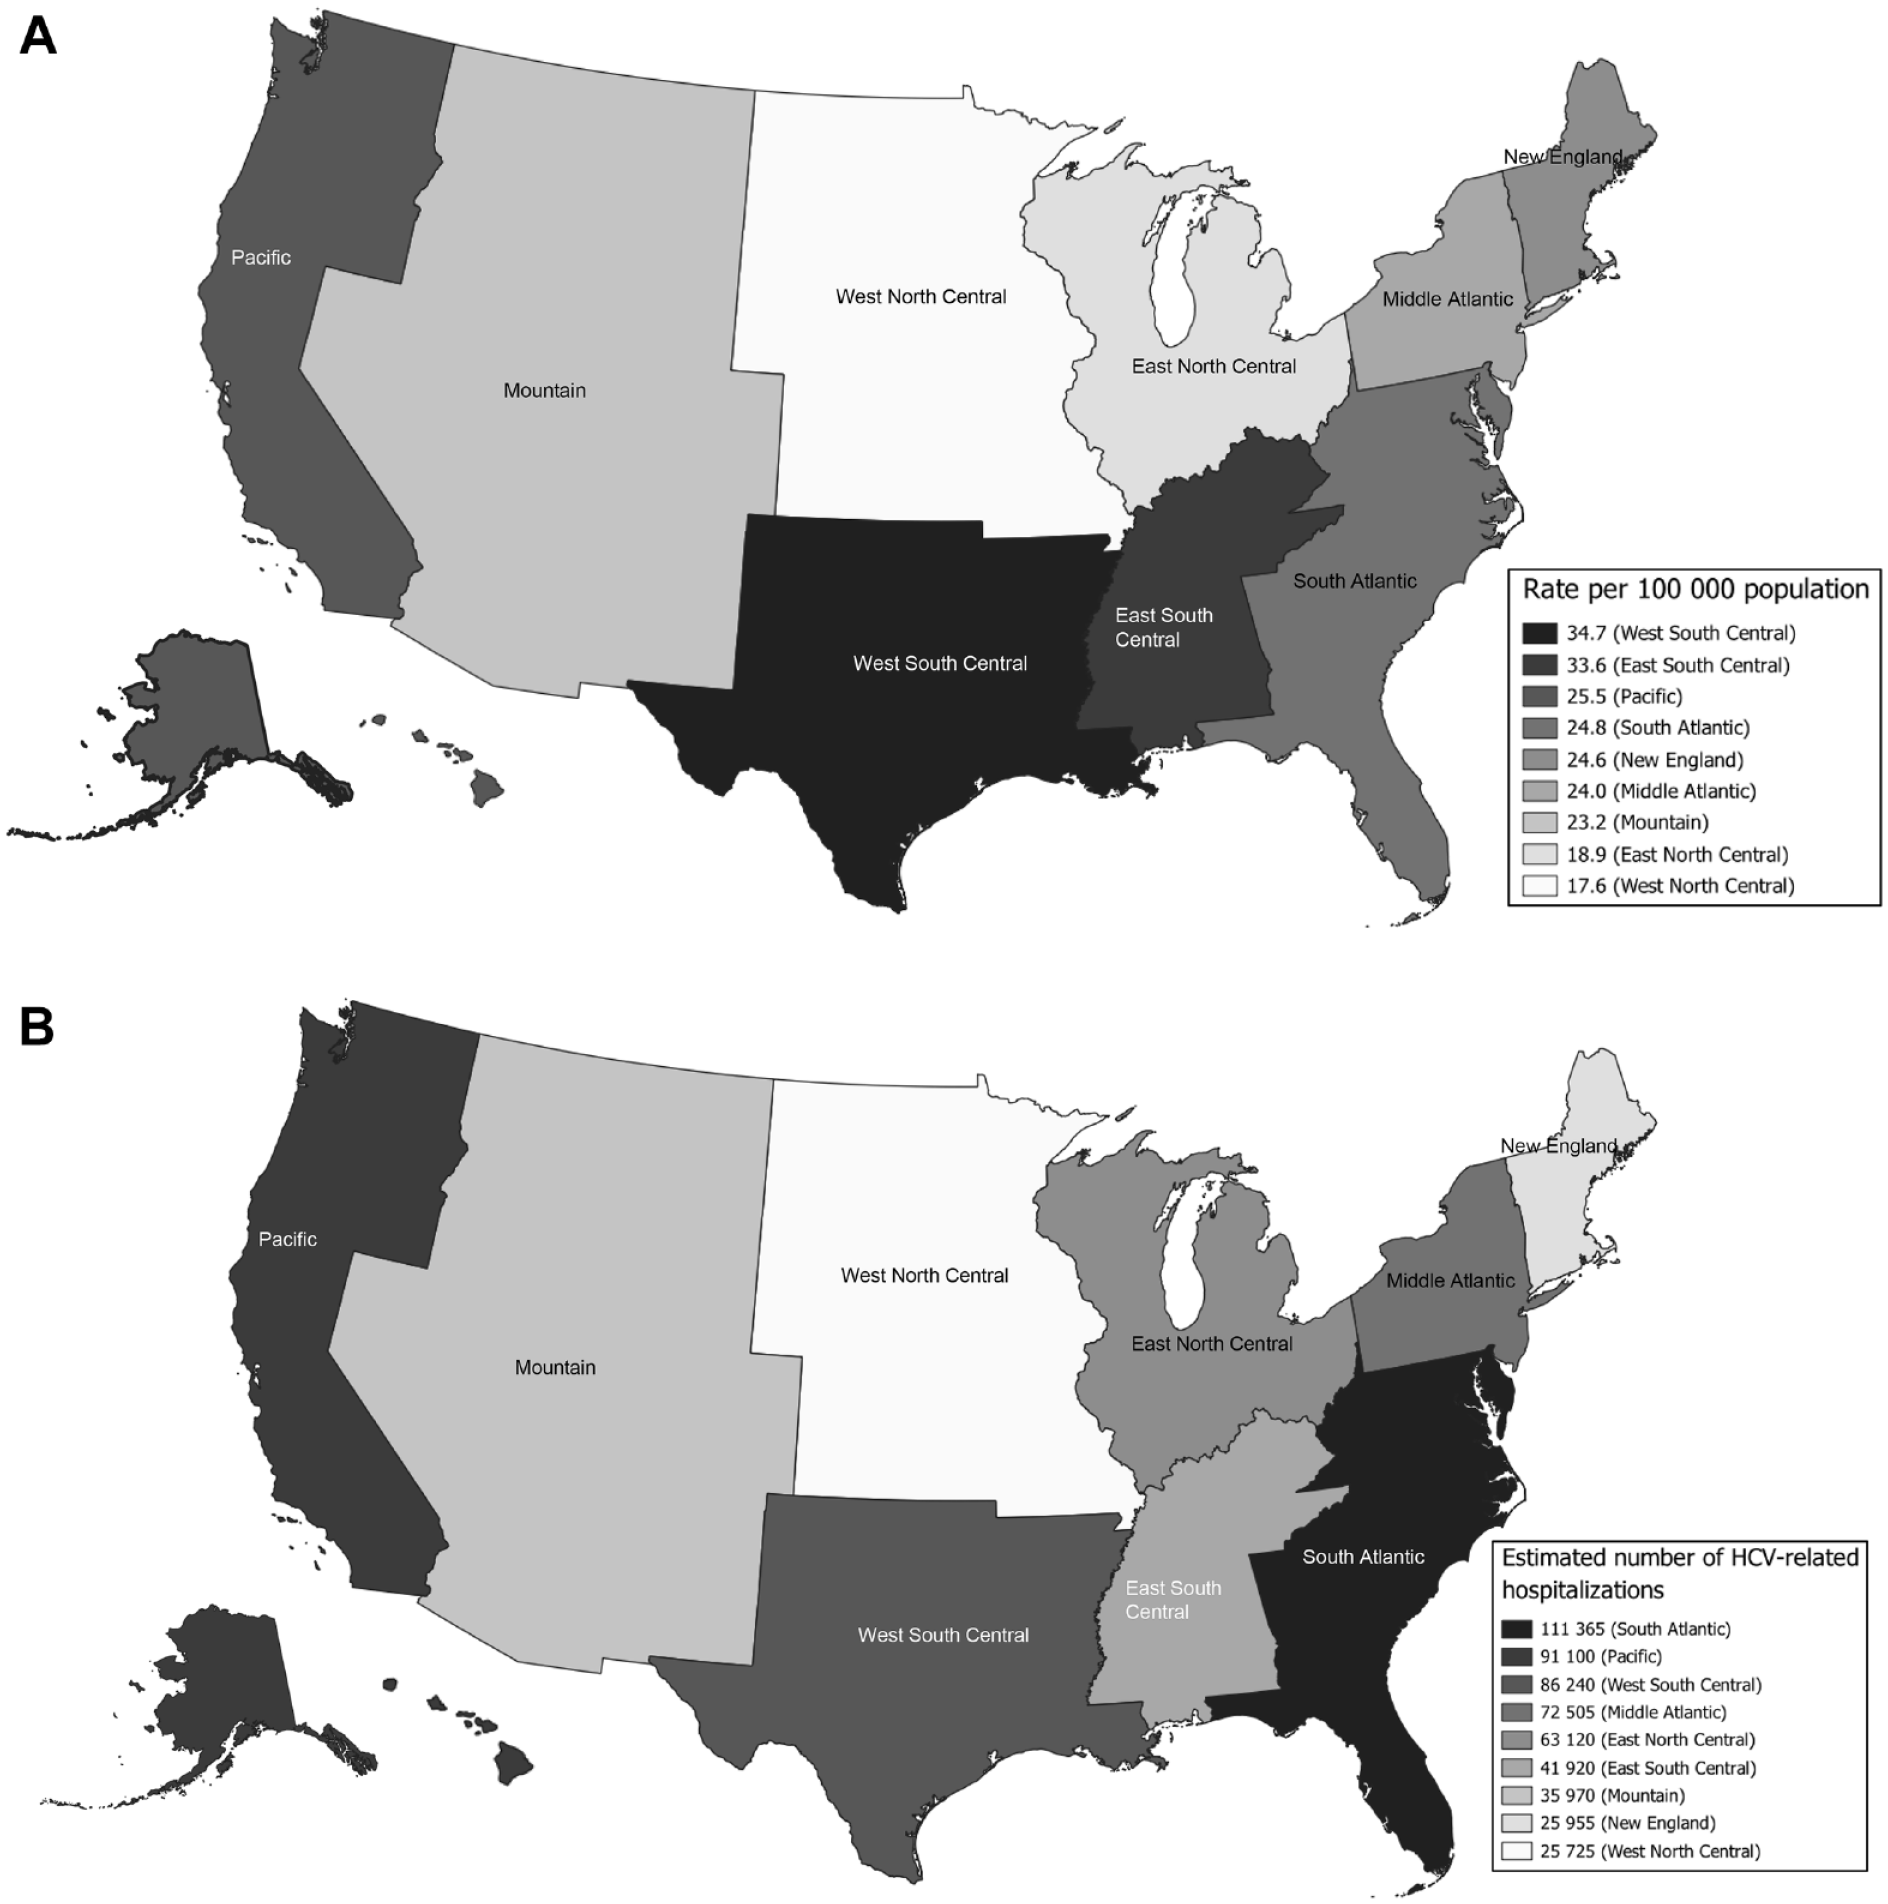
(A) Age-adjusted HCV-related hospitalization rates and (B) estimated number of HCV-related hospitalizations, by US Census Bureau division, National Inpatient Sample, 2012-2019. US Census Bureau divisions: New England (Connecticut, Maine, Massachusetts, New Hampshire, Rhode Island, Vermont), Middle Atlantic (New Jersey, New York, Pennsylvania), East North Central (Illinois, Indiana, Michigan, Ohio, Wisconsin), West North Central (Iowa, Kansas, Minnesota, Missouri, Nebraska, North Dakota, South Dakota), South Atlantic (Delaware, District of Columbia, Florida, Georgia, Maryland, North Carolina, South Carolina, Virginia, West Virginia), East South Central (Alabama, Kentucky, Mississippi, Tennessee), West South Central (Arkansas, Louisiana, Oklahoma, Texas), Mountain (Arizona, Colorado, Idaho, Montana, Nevada, New Mexico, Utah, Wyoming), Pacific (Alaska, California, Hawaii, Oregon, Washington). Abbreviation: HCV, hepatitis C virus. Data sources: Agency for Healthcare Research and Quality6,8 and US Census Bureau. 7
We classified HCV-related hospitalizations and comorbidities according to the International Classification of Diseases, Ninth Revision, Clinical Modification (ICD-9-CM) 9 and International Classification of Diseases, Tenth Revision, Clinical Modification (ICD-10-CM) 10 diagnostic codes. We considered hospitalizations to be HCV related if (1) hepatitis C was the primary discharge diagnosis or (2) hepatitis C was any secondary discharge diagnosis and the primary discharge diagnosis was 1 of the following end-stage liver disease–related conditions: alcoholic liver disease, ascites, cirrhosis without mention of alcohol, esophageal varices with and without bleeding, hepatic encephalopathy, hepatic failure, hepatocellular carcinoma, hepatorenal syndrome, jaundice, liver transplant, other sequelae of chronic liver disease, portal hypertension, and spontaneous bacterial peritonitis (eTable 1 in Supplemental Material). With the exception of hepatitis B virus (HBV) co-infection, we used Elixhauser comorbidity software to define the comorbidities assessed in the analysis (substance use disorder, HIV co-infection, diabetes, obesity, and cancer). 11 The diabetes variable combines diabetes with chronic complications and diabetes without chronic complications, and the cancers variable includes leukemia, lymphoma, solid tumor without metastasis, and metastatic cancer.
We analyzed 2012-2019 discharge data for adults aged ≥18 years in the NIS. We applied NIS sample weights to the data to generate nationally representative estimates. For each HCV-related hospitalization, we identified patient age, sex, race and ethnicity, urbanicity of residence, health insurance type, and comorbidity status. For urbanicity of residence, we used the National Center for Health Statistics urban–rural classification scheme for counties and county-equivalent entities. 12 We applied the 2006 scheme to data from 2012 and the 2013 scheme to data from 2013 through 2019. We grouped large central metropolitan, large fringe metropolitan, medium metropolitan, and small metropolitan counties as urban and micropolitan and noncore counties as rural. We recoded expected primary payer into 5 types of health insurance: private insurance, Medicare, Medicaid, uninsured (self-pay and no charge expected), and other. We analyzed descriptive characteristics of HCV-related hospitalizations nationally and by geographic division by calculating age-adjusted HCV-related hospitalization rates per 100 000 US standard population during 2000. For demographic characteristics, we identified significant differences between national estimates and geographic division estimates by assessing 95% CIs (considering nonoverlapping 95% CIs to be significantly different). We performed Rao–Scott χ2 statistical testing to determine whether the prevalence of comorbidities differed between national and geographic division estimates; we set significance at P < .05. We calculated the percentage change in age-adjusted HCV-related hospitalization rates for the overall analytic period (2012 vs 2019) and used the Joinpoint Regression Program version 4.9.0.1 (National Cancer Institute) to model the annual percentage change (APC) in rates over time, nationally and by geographic division, and their significance. We used SAS version 9.4 (SAS Institute, Inc) for all other analyses.
Results
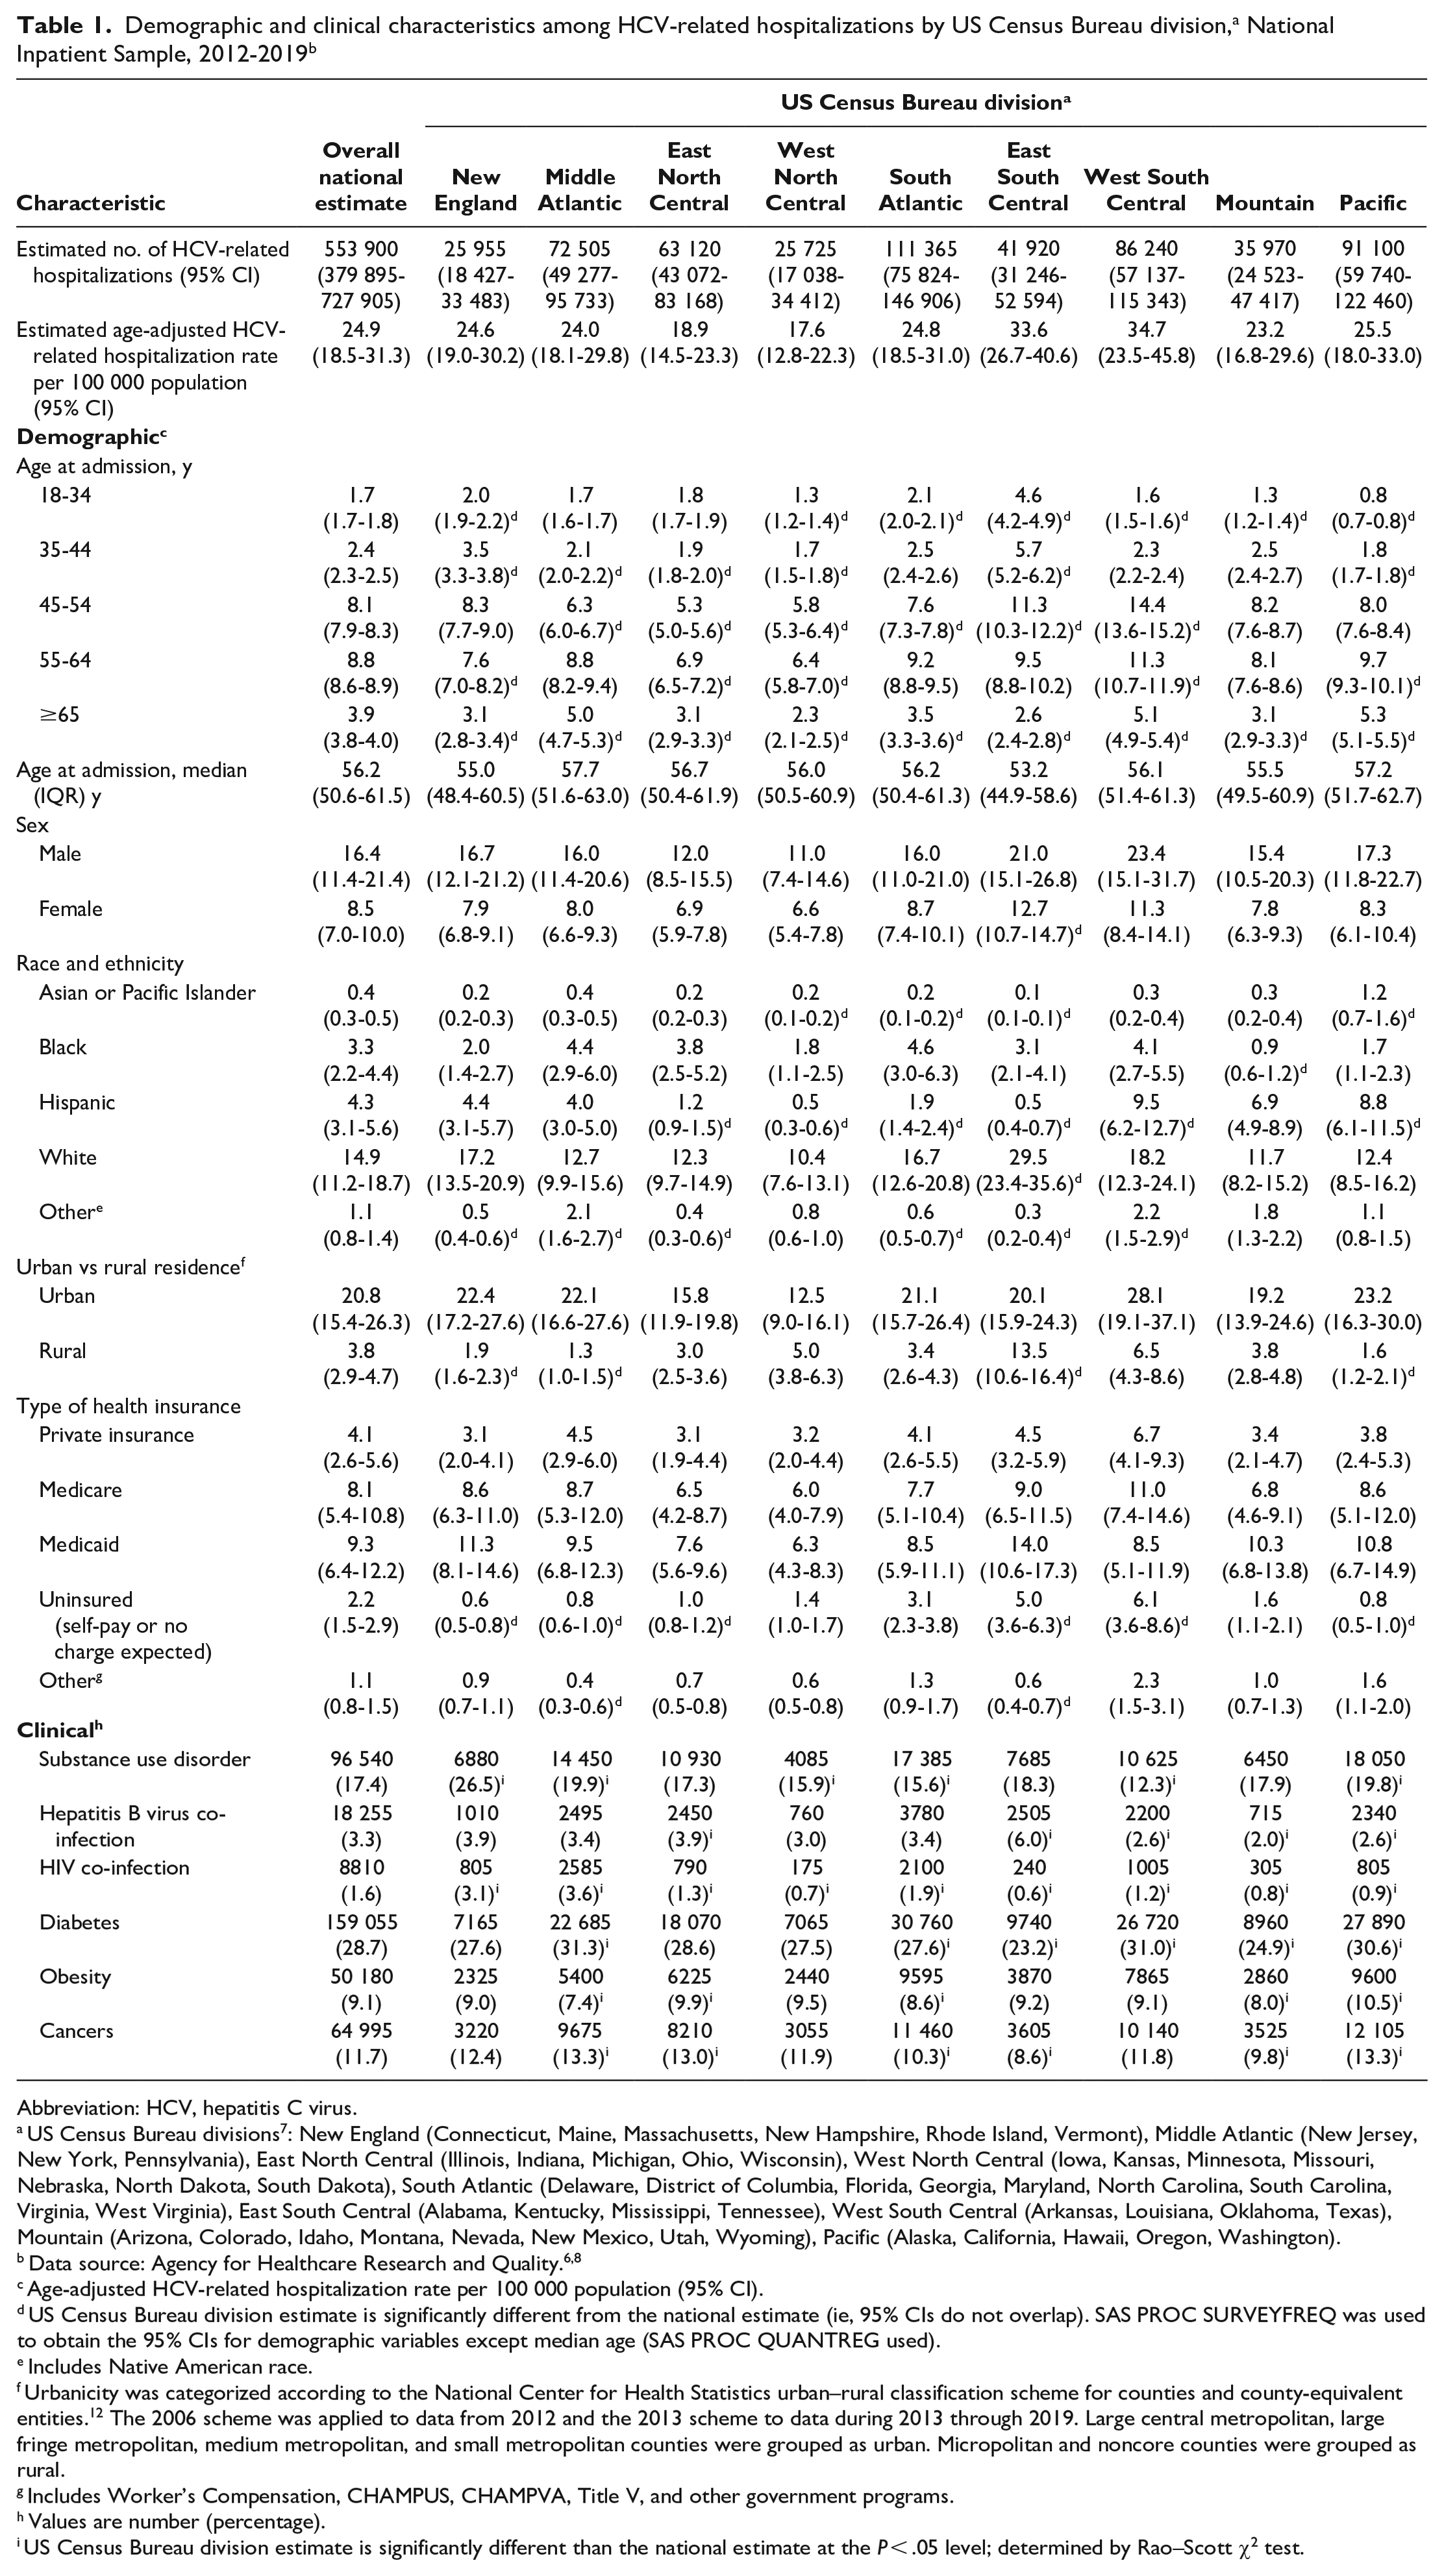
During 2012-2019, an estimated 553 900 HCV-related hospitalizations occurred in the United States, with an estimated age-adjusted HCV-related hospitalization rate of 24.9 per 100 000 population (Table 1). The age-adjusted HCV-related hospitalization rate per 100 000 population was highest, by age, among adults aged 55-64 years (8.8); higher among men (16.4) than women (8.5); highest, by race and ethnicity, among White adults (14.9); higher among urban residents (20.8) than rural residents (3.8); and highest, by health insurance type, among Medicaid recipients (9.3). Nationally, among HCV-related hospitalizations, 28.7% involved diabetes, 17.4% substance use disorder, 11.7% cancer, 9.1% obesity, 3.3% HBV co-infection, and 1.6% HIV co-infection.
Abbreviation: HCV, hepatitis C virus.
US Census Bureau divisions 7 : New England (Connecticut, Maine, Massachusetts, New Hampshire, Rhode Island, Vermont), Middle Atlantic (New Jersey, New York, Pennsylvania), East North Central (Illinois, Indiana, Michigan, Ohio, Wisconsin), West North Central (Iowa, Kansas, Minnesota, Missouri, Nebraska, North Dakota, South Dakota), South Atlantic (Delaware, District of Columbia, Florida, Georgia, Maryland, North Carolina, South Carolina, Virginia, West Virginia), East South Central (Alabama, Kentucky, Mississippi, Tennessee), West South Central (Arkansas, Louisiana, Oklahoma, Texas), Mountain (Arizona, Colorado, Idaho, Montana, Nevada, New Mexico, Utah, Wyoming), Pacific (Alaska, California, Hawaii, Oregon, Washington).
Age-adjusted HCV-related hospitalization rate per 100 000 population (95% CI).
US Census Bureau division estimate is significantly different from the national estimate (ie, 95% CIs do not overlap). SAS PROC SURVEYFREQ was used to obtain the 95% CIs for demographic variables except median age (SAS PROC QUANTREG used).
Includes Native American race.
Urbanicity was categorized according to the National Center for Health Statistics urban–rural classification scheme for counties and county-equivalent entities. 12 The 2006 scheme was applied to data from 2012 and the 2013 scheme to data during 2013 through 2019. Large central metropolitan, large fringe metropolitan, medium metropolitan, and small metropolitan counties were grouped as urban. Micropolitan and noncore counties were grouped as rural.
Includes Worker’s Compensation, CHAMPUS, CHAMPVA, Title V, and other government programs.
Values are number (percentage).
US Census Bureau division estimate is significantly different than the national estimate at the P < .05 level; determined by Rao–Scott χ2 test.
During the analysis period, the highest HCV-related hospitalization rate per 100 000 population (34.7) was in the West South Central division, while the lowest (17.6) was in the West North Central division (Figure 1A). The highest estimated number of HCV-related hospitalizations occurred in the South Atlantic division (n = 111 365), while the lowest estimated number occurred in the West North Central division (n = 25 725) (Figure 1B). The estimated annual number of HCV-related hospitalizations by geographic division ranged from 2550 in the West North Central division in 2019 to 16 015 in the South Atlantic division in 2014 (eFigure 1 in Supplemental Material). The East South Central division had the youngest median age at hospitalization (53.2 y) and the highest HCV-related hospitalization rates per 100 000 population among adults aged 18-44 years of any division (4.6 for adults aged 18-34 y and 5.7 for adults aged 35-44 y); the West South Central division had the highest rates among adults aged 45-64 years (14.4 for adults aged 45-54 y and 11.3 for adults aged 55-64 y), while the Pacific division had the highest rate among people aged ≥65 years (5.3) (Table 1). The highest HCV-related hospitalization rate among men occurred in the West South Central division (23.4), while the highest among women occurred in the East South Central division (12.7). By race and ethnicity, the highest HCV-related hospitalization rate per 100 000 population among White adults was in the East South Central division (29.5), the highest among Black adults in the South Atlantic division (4.6), the highest among Asian or Pacific Islander adults in the Pacific division (1.2), and the highest among Hispanic adults in the West South Central division (9.5). By type of health insurance, the West South Central division had the highest rates per 100 000 population for private health insurance (6.7), Medicare (11.0), and uninsured (6.1), while the East South Central division had the highest Medicaid hospitalization rate (14.0). HCV-related hospitalization rates were approximately twice as high among men than among women in all divisions; however, the East South Central division had the highest hospitalization rate among women (12.7). The East South Central division also had the highest rate of HCV-related hospitalizations among rural residents of any region (13.5).
In terms of comorbidities, substance use disorder occurred significantly more frequently in the New England (26.5%), Middle Atlantic (19.9%), and Pacific (19.8%) divisions than nationally (17.4%) (Table 1). The prevalence of HBV co-infection was significantly higher in the East South Central (6.0%) and East North Central (3.9%) divisions than nationally (3.3%), while the prevalence of HIV co-infection was significantly higher in the Middle Atlantic (3.6%), New England (3.1%), and South Atlantic (1.9%) divisions than nationally (1.6%). Diabetes was significantly more common in the Middle Atlantic (31.3%), West South Central (31.0%), and Pacific (30.6%) divisions than nationally (28.7%); obesity in the Pacific (10.5%) and East North Central (9.9%) divisions than nationally (9.1%); and cancers in the Middle Atlantic (13.3%), Pacific (13.3%), and East North Central (13.0%) divisions than nationally (11.7%).
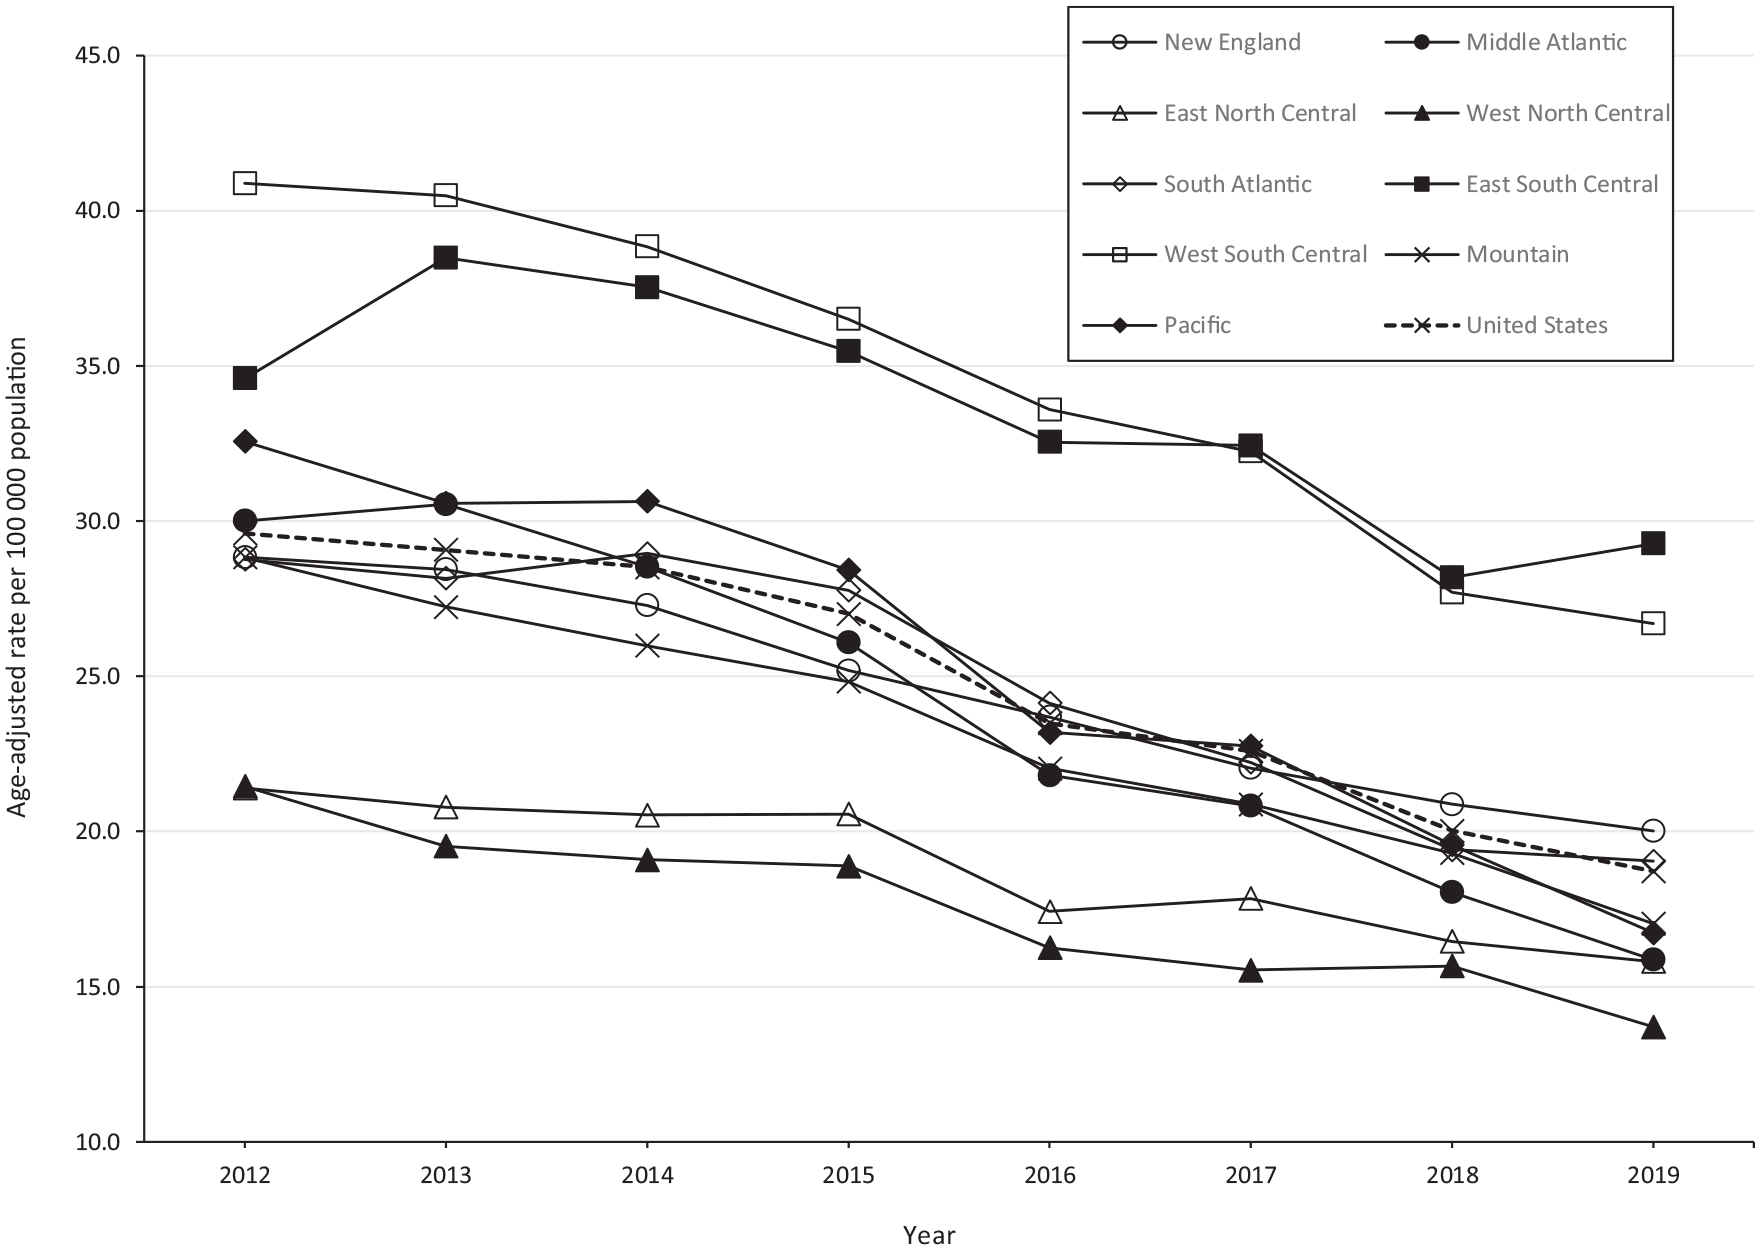
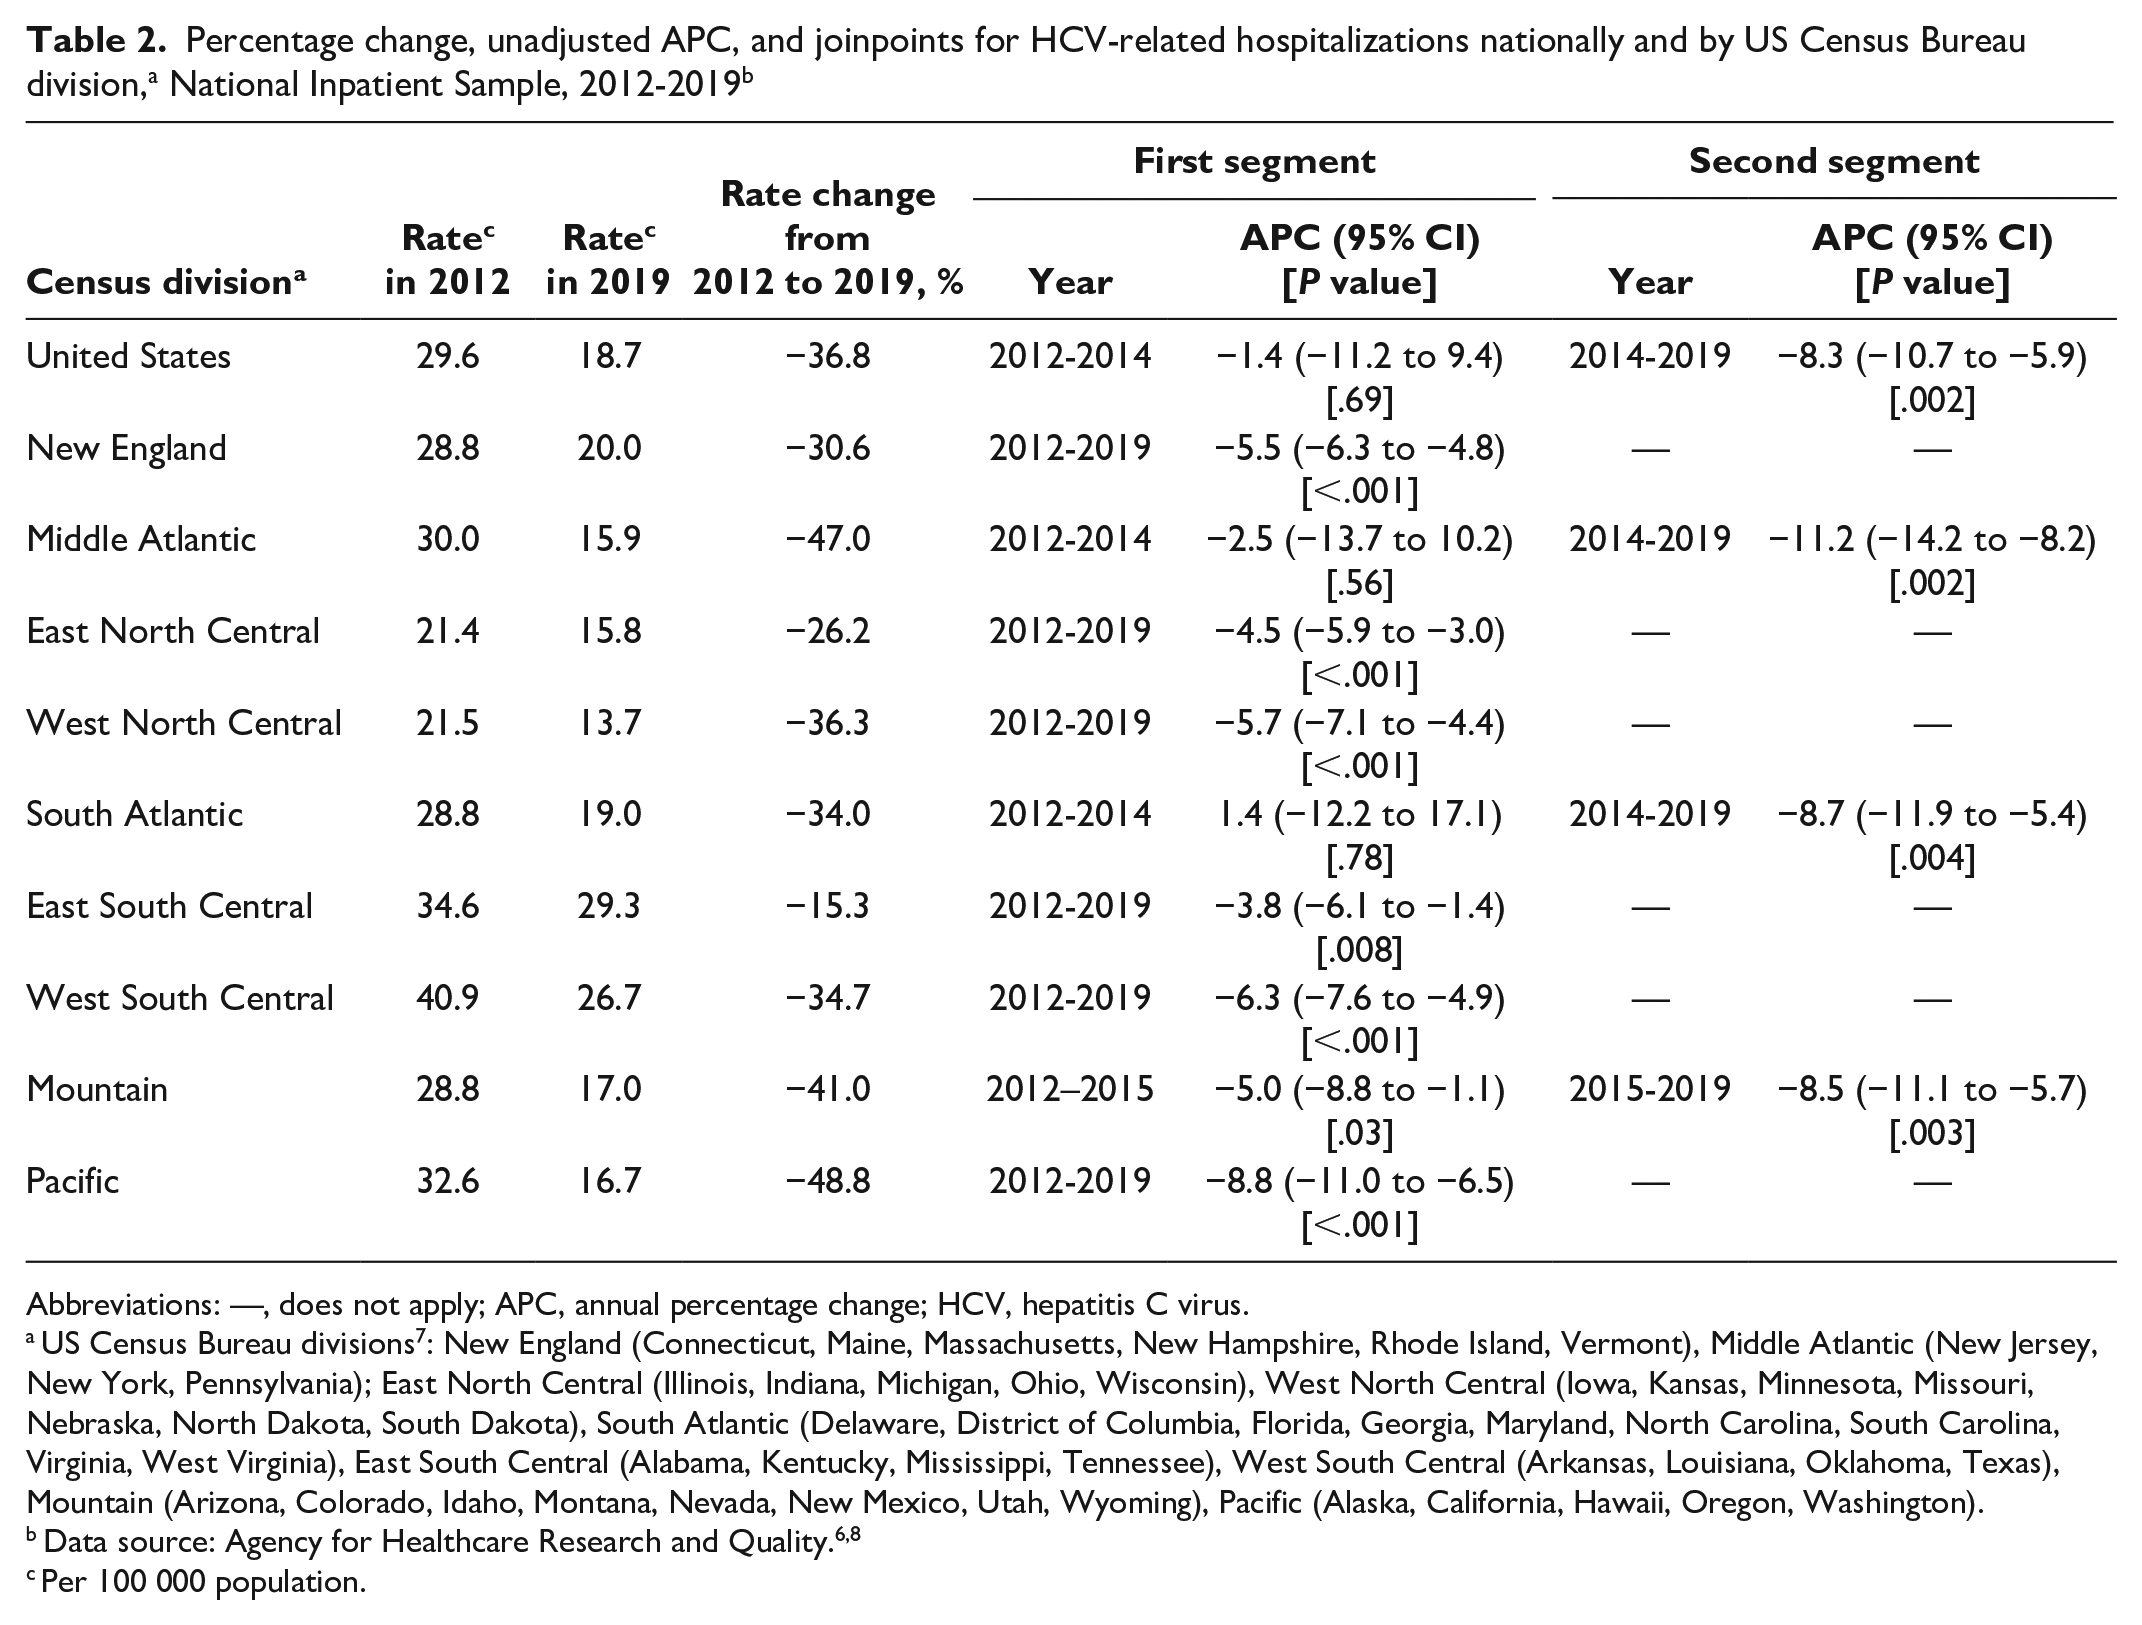
From 2012 to 2019, annual HCV-related hospitalization rates decreased nationally and in each geographic division (Figure 2, Table 2). In 2012, the highest HCV-related hospitalization rates per 100 000 population occurred in the West South Central (40.9), East South Central (34.6), and Pacific (32.6) divisions. By 2019, the highest HCV-related hospitalization rates per 100 000 population occurred in the East South Central (29.3), West South Central (26.7), and New England (20.0) divisions. However, the observed decreases in HCV-related hospitalization rates during the analysis period were not uniform, ranging from the smallest rate decrease in the East South Central division (15.3%) to the largest rate decrease in the Pacific division (48.8%).
Abbreviations: —, does not apply; APC, annual percentage change; HCV, hepatitis C virus.
US Census Bureau divisions 7 : New England (Connecticut, Maine, Massachusetts, New Hampshire, Rhode Island, Vermont), Middle Atlantic (New Jersey, New York, Pennsylvania); East North Central (Illinois, Indiana, Michigan, Ohio, Wisconsin), West North Central (Iowa, Kansas, Minnesota, Missouri, Nebraska, North Dakota, South Dakota), South Atlantic (Delaware, District of Columbia, Florida, Georgia, Maryland, North Carolina, South Carolina, Virginia, West Virginia), East South Central (Alabama, Kentucky, Mississippi, Tennessee), West South Central (Arkansas, Louisiana, Oklahoma, Texas), Mountain (Arizona, Colorado, Idaho, Montana, Nevada, New Mexico, Utah, Wyoming), Pacific (Alaska, California, Hawaii, Oregon, Washington).
Per 100 000 population.
We identified a single joinpoint and 2 segments in the joinpoint regression analysis during 2012-2019 for the United States overall (in 2014) and for the Middle Atlantic (2014), South Atlantic (2014), and Mountain (2015) divisions; joinpoints were not identified for the New England, East North Central, West North Central, East South Central, West South Central, or Pacific divisions (Table 2). The national age-adjusted HCV-related hospitalization rate decreased nonsignificantly during 2012-2014 (APC = −1.4%; 95% CI, −11.2% to 9.4%) and then significantly decreased during 2014-2019 (APC = −8.3%; 95% CI, −10.7% to −5.9%). We observed an increase in the South Atlantic division only (APC = 1.4%; 95% CI, −12.2% to 17.1%), but this increase was not significant. The largest decrease in magnitude in the age-adjusted HCV-related hospitalization rate occurred in the Middle Atlantic division during 2014-2019 (APC = −11.2%; 95% CI, −14.2% to −8.2%; P = .002) followed by the Pacific division during 2012-2019 (APC = −8.8%; 95% CI, −11.0% to −6.5%; P < .001) and the South Atlantic division during 2014-2019 (APC = −8.7%; 95% CI, −11.9% to −5.4%; P = .004).
Discussion
During 2012-2019, approximately 550 000 HCV-related hospitalizations occurred in the United States, with the highest age-adjusted HCV-related hospitalization rates occurring among people aged 45-64 years (vs other age groups), men (vs women), White adults (vs adults of other races and ethnicities), urban (vs rural) residents, and recipients of Medicaid or Medicare (vs other types of health insurance). From 2012 to 2019, HCV-related hospitalization rates decreased nationally and in each geographic division; however, decreases were not equal. During 2012-2019, HCV-related hospitalization rates varied 2-fold among the geographic divisions, with the highest HCV-related hospitalization rate occurring in the West South Central division and the lowest occurring in the West North Central division. The HCV-related hospitalization burden varied more than 4-fold among geographic divisions, with the highest estimated number of HCV-related hospitalizations occurring in the South Atlantic division, while the lowest estimated number occurred in the West North Central division.
The characteristics of HCV-related hospitalizations that occurred in the East South Central division during the analysis period were noteworthy. The East South Central division had the youngest median age at hospitalization and the highest rate of HCV-related hospitalizations of any geographic division among people aged 18-44 years, White people, women, rural residents, and Medicaid recipients. Furthermore, the East South Central division had the smallest HCV-related hospitalization rate decrease (15.3%) of any geographic division. This rate decrease was less than half of the rate decrease observed nationally during the analysis period. A recent model estimated that during 2013-2016, Tennessee, Kentucky, and Mississippi had 3 of the 13 highest prevalence estimates of current hepatitis C among the 50 US states and the District of Columbia. 13 Although some Medicaid restrictions for DAA prescriptions were removed in the East South Central division states during the analysis period, as of November 2019, Alabama had fibrosis and sobriety restrictions, Kentucky and Mississippi had sobriety and prescriber restrictions, and Tennessee had sobriety restrictions in place. 14
We found no substantive geographic differences in the prevalence of comorbid substance use disorder, diabetes, obesity, or cancer in this analysis. However, co-infection with HBV or HIV varied significantly by region. Hepatitis C elimination efforts need to account for the prevalence of HBV and HIV co-infection because HBV/HCV co-infection results in a higher risk of progression to cirrhosis, decompensated liver disease, and hepatocellular carcinoma and consequently hospitalization if hepatitis C is left untreated, and HIV/HCV co-infection is associated with an increased risk of hospitalization.15 -18
While numerous factors contribute to HCV-related hospitalization rates, 2 of the primary factors that likely contributed to the HCV-related hospitalization rate in each geographic division in this analysis were the number of HCV-infected people with advanced liver disease and the ease of access to curative DAAs, gauged by the presence or absence of treatment restrictions. Treatment with DAAs can prevent liver disease progression; reduced availability of DAAs through prescribing restrictions could have fostered the accumulation of advanced cases of HCV-associated liver disease. Since DAAs were introduced in 2013, access has been limited by health insurer–implemented treatment restrictions, which have varied geographically over time. 5 By type of health insurance, Medicaid had the highest rate of HCV-related hospitalizations in the United States overall and in all but 1 geographic division (West South Central) during 2012-2019; the Medicaid hospitalization rate was at least 2-fold higher than the private health insurance hospitalization rate for the United States overall and all geographic divisions except the West South Central division. This finding is due, at least in part, to implementation of the Affordable Care Act in the United States in 2014, which expanded health insurance coverage and reduced uninsured rates. 19 Although progress has been made in reducing Medicaid restrictions to DAAs, at the end of the analysis period (2019), 8 Medicaid programs still had fibrosis restrictions in place, 38 still had sobriety restrictions, and 30 still had prescriber restrictions. 14 Further efforts to expand access to DAAs, particularly among Medicaid recipients, will be necessary to ultimately eliminate hepatitis C as a public health threat. A joint letter, issued by the US Department of Justice and the Centers for Medicare & Medicaid Services in January 2024, urging state Medicaid administrators to ensure, in accordance with the Americans With Disabilities Act, that Medicaid programs allow people with hepatitis C and substance use disorder to access DAAs, represents 1 such effort. 20 We hypothesize that states with higher HCV-related hospitalization rates were those with a higher prevalence of HCV infection and restricted access to DAAs, which promoted an accumulation of infected people with advanced liver disease that required hospitalization. Thus, as prescribing restrictions are eliminated in the future, we should anticipate further reductions in HCV-related hospitalizations. Our analysis might serve as a baseline metric for evaluating the degree to which removal of prescribing restrictions reduces HCV-related morbidity.
Limitations
Our findings are subject to several limitations. First, we used an administrative dataset for the analysis. Different practices (or errors) in clinical coding during the analysis period might have resulted in differential classification of hospitalizations as being HCV-related or of comorbidity status. Second, the unit of observation in the NIS is a hospitalization, not an individual patient. Patients with advanced liver disease or multiple comorbidities might have been admitted multiple times during the same calendar year, potentially contributing to an overestimation of the HCV-related hospitalization rates and disproportionately affecting the distribution of comorbidities in our analysis. Third, this analysis was a retrospective, cross-sectional analysis; we were unable to determine the causality of differential decreases in HCV-related hospitalization rates observed in the different geographic regions. HCV-related mortality, which was not assessed in this analysis, could have affected the observed decreases in HCV-related hospitalization rates. Deaths that occurred among patients with advanced liver disease likely reduced the size of the hospitalization-prone portion of chronic hepatitis C patients, potentially lowering the HCV-related hospitalization rate. However, the number and rate of deaths with hepatitis C listed as a cause of death on death certificates decreased annually in the United States during 2014-2019 and 2013-2019, respectively. 2 Fourth, our HCV-related classification scheme was designed to capture end-stage manifestations of HCV infection to produce a conservative estimate of the hospitalization rate that could legitimately be attributed to hepatitis C. Consequently, the HCV-related hospitalization rates might have been underestimated because our classification scheme did not account for extra-hepatic manifestations of hepatitis C that could have resulted in hospitalization. Finally, our analysis likely underestimated regional HCV-related hospitalization rates because the NIS excludes hospitalization data from the US Department of Veterans Affairs.
Conclusions
HCV-related hospitalization rates decreased nationally and in each geographic division from 2012 to 2019. However, we found substantial disparities in the rate of decreases geographically, which could indicate uneven hepatitis C prevalence, treatment, or restrictive DAA treatment policies. As of August 2023, most of the Medicaid-implemented treatment restrictions that were in place at the end of our analysis period had been lifted; only 1 Medicaid program still had fibrosis restrictions in place, 10 had sobriety restrictions, and 4 had prescriber restrictions. 21 Removing DAA treatment restrictions, in addition to expanding other public health interventions that increase hepatitis C screening, diagnostic testing, and linkage to care, can have a substantial effect on reducing hepatitis C morbidity. Expanded access to DAA treatment in early-stage hepatitis C, which is cost-effective, 22 should reduce future hospitalizations related to advanced liver disease and interrupt ongoing transmission of HCV.
Supplemental Material
sj-docx-1-phr-10.1177_00333549241260252 – Supplemental material for Regional Differences in Hepatitis C–Related Hospitalization Rates, United States, 2012-2019
Supplemental material, sj-docx-1-phr-10.1177_00333549241260252 for Regional Differences in Hepatitis C–Related Hospitalization Rates, United States, 2012-2019 by Megan G. Hofmeister, Yuna Zhong, Anne C. Moorman, Eyasu H. Teshale, Christina R. Samuel and Philip R. Spradling in Public Health Reports®
Footnotes
Declaration of Conflicting Interests
The authors declared no potential conflicts of interest with respect to the research, authorship, and/or publication of this article.
Funding
The authors received no financial support for the research, authorship, and/or publication of this article.
Disclaimer
The findings and conclusions in this article are those of the authors and do not necessarily represent the official position of the Centers for Disease Control and Prevention.
Supplemental Material
Supplemental material for this article is available online. The authors have provided these supplemental materials to give readers additional information about their work. These materials have not been edited or formatted by Public Health Reports’s scientific editors and, thus, may not conform to the guidelines of the AMA Manual of Style, 11th Edition.
References
Supplementary Material
Please find the following supplemental material available below.
For Open Access articles published under a Creative Commons License, all supplemental material carries the same license as the article it is associated with.
For non-Open Access articles published, all supplemental material carries a non-exclusive license, and permission requests for re-use of supplemental material or any part of supplemental material shall be sent directly to the copyright owner as specified in the copyright notice associated with the article.