
Abstract
Objectives:
In 2014, New York City initiated a childcare influenza vaccine requirement to increase influenza vaccination rates among children aged 6-59 months attending city-regulated childcare, including prekindergarten. We evaluated the requirement’s effect on vaccination rates in childcare-aged children in New York City.
Methods:
We examined influenza vaccination rates in children aged 6-59 months and by age groups of 1, 2, 3, and 4 years for 8 influenza seasons (2012-2013 through 2019-2020), representing 2 seasons before the requirement, 2 seasons during the requirement, 2 seasons after its suspension, and 2 seasons after its reinstatement. We also assessed rates in a comparison group of children aged 5-8 years. We performed a difference-in-differences analysis to compare rate differences in age groups when the requirement was and was not in effect. We considered P < .05 as significant based on the Wald χ2 test.
Results:
Influenza vaccination rates among children aged 6-59 months increased 3.7 percentage points (from 47.7% to 51.4%) by the requirement’s second year and declined 6.7 percentage points to 44.7% after suspension. After reinstatement, rates increased 10.7 percentage points to 55.4%. Rate changes were most pronounced among 4-year-olds, increasing 12.7 percentage points (from 45.3% to 58.0%) by the requirement’s second year, declining 14.1 percentage points to 43.9% after suspension, and increasing 22.2 percentage points to 66.1% after reinstatement. In the comparison group, rates increased 4.9 percentage points (from 36.5% to 41.4%) after reinstatement. Rates increased significantly among 4-year-olds before versus at the initial requirement and decreased significantly after suspension. After reinstatement, rates increased significantly among all groups except 1-year-olds.
Conclusion:
The New York City influenza vaccine requirement improved influenza vaccination rates among preschool-aged children, adding to the evidence base showing that vaccine requirements raise vaccination rates.
Preschool-aged children are at higher risk than older children for severe illness and complications from influenza. Hospitalization rates for influenza are comparable between children aged <2 years and people aged ≥65 years.1,2 As compared with younger children, children aged 24-59 months have a lower risk of hospitalization from influenza but are more likely to have influenza-associated visits to clinics and emergency departments. 1
Congregate settings, such as childcare and schools, facilitate the spread of infectious diseases, including influenza. 3 Children attending schools are a major source of influenza transmission within communities. 3 Among the US general population, the number of influenza-related hospitalizations and deaths varies substantially by influenza season, depending on the predominant circulating influenza viruses, the effectiveness of the season’s vaccine, and the proportion of the population vaccinated. 4 From 2010 to 2020, the number of annual influenza-associated hospitalizations ranged from approximately 140 000 to 710 000 and the number of deaths ranged from about 12 000 to 52 000 annually. 4 From October 2010 to September 2016, the annual average number of influenza-associated pediatric deaths reported was 113, ranging from 37 in the 2011-2012 influenza season to 171 in the 2012-2013 season. 5 During this period, children aged 6-23 months were >3 times more likely to die of an influenza-associated illness than adolescents aged 13-17 years. 5
Although vaccination offers the best defense against serious influenza-associated illness, uptake of influenza vaccine among all ages is suboptimal. 6 Vaccine requirements are an evidenced-based strategy for increasing vaccination rates to protect vulnerable populations (eg, people with chronic diseases) and to control community spread.7-9 In 2006, the Centers for Disease Control and Prevention’s Advisory Committee on Immunization Practices recommended an annual influenza vaccine for children aged 6-59 months 10 and expanded the recommendation to include children aged 6 months through 18 years for the 2008-2009 season. 11 Despite these recommendations, the pediatric influenza vaccination rate in New York City was low at 57.8% (95% CI, 54.6%-61.0%) in December 2013 among children aged 6 months through 17 years. 12 In 2014, to increase rates of influenza vaccination among preschoolers, New York City became the fourth jurisdiction in the United States to require influenza vaccine for children aged 6-59 months attending childcare, after Pennsylvania, New Jersey, and Connecticut.13-15 Since 2014, Ohio and Rhode Island have also established this requirement. 13
Description of the Program Being Evaluated
The New York City Board of Health implemented the influenza vaccine requirement by amending the New York City Health Code to add the influenza vaccine to vaccines required for public and private childcare and prekindergarten. The requirement was for children aged 6-59 months who attended city-regulated childcare and prekindergarten to receive 1 dose of influenza vaccine between July 1 and December 31 of each year starting July 1, 2014. 16 In its initial period, the requirement covered approximately 150 000 children, representing an estimated 30% (150 000 of 508 112) of all children aged 6-59 months in New York City.17,18
In November 2015, 5 parents brought a lawsuit against the influenza vaccine requirement, which resulted in suspension of the requirement by the New York State Supreme Court on December 16, 2015.19-21 The New York City Law Department appealed the suspension twice, having lost on the first attempt. In the second appeal, the New York Court of Appeals decided unanimously to reinstate the requirement immediately on June 28, 2018. 22
In the requirement’s first season, education was the only enforcement measure, which held true in the second season because the requirement was suspended before January 1, 2016, when penalties would have taken effect. However, a penalty threat was in effect that season before the suspension. After reinstatement of the requirement, childcare operators were subject to fines if they did not exclude unvaccinated children from attendance.21,22 Public school prekindergarten was not subject to fines, but parents were informed of the requirement.
Purpose of the Evaluation
Childcare and school entry vaccine requirements have achieved and maintained high rates of vaccination and low rates of vaccine-preventable diseases.7-9 However, childcare vaccine requirements are not always effective at raising vaccination rates, possibly because of a lack of standard vaccination rate assessment and enforcement across childcare facilities.23,24
In this study, we analyzed the effects of the presence and absence of the New York City influenza vaccine requirement on influenza vaccination rates among children of childcare age.
Methods
We used the Citywide Immunization Registry (CIR), New York City’s immunization information system (IIS), as our data source. IISs are population-based computerized systems that collect and consolidate reports of immunizations administered by all immunization providers in a jurisdiction. The CIR loads birth certificate information twice weekly for all children born in New York City, providing the basis for population-based vaccination rate estimates. The New York City Health Code has mandated reporting immunizations to the CIR by all New York City immunization providers since 1997. 25 The CIR is one of the most complete IISs in the United States, based on percentage of vaccinations reported. 26
Study Population
We defined our study population as all children in New York City in the CIR aged 6-59 months for the entire time of each influenza vaccination season (ie, July 1 of 1 year through June 30 of the next year). We were unable to include only the children who attended childcare or prekindergarten because the CIR does not contain such information. We selected children aged 5-8 years as a comparison group because, while most people aged ≥6 months are recommended to receive annual influenza vaccination, children aged 5-8 years were not directly affected by the New York City influenza vaccine requirement.
We excluded children who would have aged in or out of the age groups during the season. For example, in the 2012-2013 season, the 6- to 59-month-old group included children born from July 1, 2008, through December 31, 2011, a 3.5-year cohort. Similarly, the 5- to 8-year-old group included children born from July 1, 2004, through June 30, 2007, a 3-year cohort. Using this method meant that all children had the same opportunity to be vaccinated during the influenza season and that the spillover effect between the study and comparison groups was reduced.27,28
We excluded the following from our analyses: (1) children whose address in the CIR included a zip code indicating that they lived outside New York City at the time of vaccination, (2) children whose immunization provider indicated they had moved out of New York City, and (3) children known to be deceased as reported by an immunization provider or the New York City Office of Vital Statistics.
We calculated influenza vaccination rates based on the number of children receiving at least 1 dose of seasonal influenza vaccine administered from July 1 through December 31 of each influenza season documented in the CIR as of April 23, 2020 (numerator), divided by the US Census Bureau Vintage 2019 intercensal population estimate for the specific age group (denominator). 18 We used SAS Enterprise Guide version 7.1 (SAS Institute Inc) to perform descriptive and statistical analyses.
Outcomes and Timing
We examined influenza vaccination rates as of December 31 for all age groups in periods of 2 annual influenza seasons as follows: before the influenza vaccine requirement (2012-2013, 2013-2014), during the initial requirement (2014-2015, 2015-2016), after the requirement was suspended (2016-2017, 2017-2018), and after the requirement was reinstated (2018-2019, 2019-2020). To assess rate changes between periods, we used the rate in the second season to calculate the difference.
We chose the vaccination rate as of December 31 because children were required to receive the influenza vaccine by December 31 of each season. 16 We selected December 31, 2012, as the first data point for the period before the requirement and December 31, 2019, as the end point of the analysis, which was just before onset of the COVID-19 pandemic (which affected attendance in childcare and school and uptake of routine vaccines because of lockdowns in New York City). 29
We divided the 6- to 59-month-olds into 4 age groups by year (1-, 2-, 3-, and 4-year-olds) as of December 31 of each season to detect the effects of the influenza vaccine requirement on the groups more likely to attend childcare and prekindergarten.
Statistical Analysis
We performed a difference-in-differences (DiD) analysis to estimate the change in vaccination rates sequentially between influenza seasons when the influenza vaccine requirement was and was not in effect for the 6- to 59-month-olds relative to changes in the 5- to 8-year-old comparison group. We made 3 comparisons: (1) before the requirement versus at the initial requirement, (2) at initial requirement versus at suspension of the requirement, and (3) at suspension of the requirement versus after reinstatement of the requirement.
We performed the DiD analysis for each age group (1, 2, 3, and 4 years), with the 5- to 8-year-olds as the comparison group. For the DiD model, we included a variable for the presence or absence of the requirement, elapsed time since the start of the study, age group, and an interaction term between the presence or absence of the requirement and age group. We calculated P values based on the Wald χ2 test, with P < .05 considered significant. We performed the DiD analyses with PROC GENMOD in SAS Enterprise Guide version 7.1 (SAS Institute Inc).
Human Subjects
The Institutional Review Board of the New York City Department of Health and Mental Hygiene determined that this study was exempt from review, consistent with federal regulations under 45 CFR §46.101(b)(4).
Results
The influenza vaccination rate among children aged 6-59 months increased 3.7 percentage points from 47.7% (183 345 of 384 481) before the influenza vaccine requirement (2013-2014) to 51.4% (200 371 of 390 067) in the second season after the requirement took effect (2015-2016). The rate declined 6.7 percentage points to 44.7% (168 677 of 377 620) in the second season after the requirement’s suspension (2017-2018). The rate then increased 10.7 percentage points to 55.4% (205 242 of 370 696) in the second season after the requirement’s reinstatement (2019-2020). Among children aged 5-8 years, the rate increased by 2.7 percentage points to 40.9% (117 999 of 288 857) in the second season after the requirement took effect, declined by 4.4 percentage points to 36.5% (106 424 of 291 874) in the second season after suspension, and increased 4.9 percentage points in the second season after reinstatement to 41.4% (120 551 of 291 432) (Table 1).
Effect of the influenza vaccine requirement among children aged 6-59 months as of December 31 in annual influenza seasons, New York City, 2012-2020 a
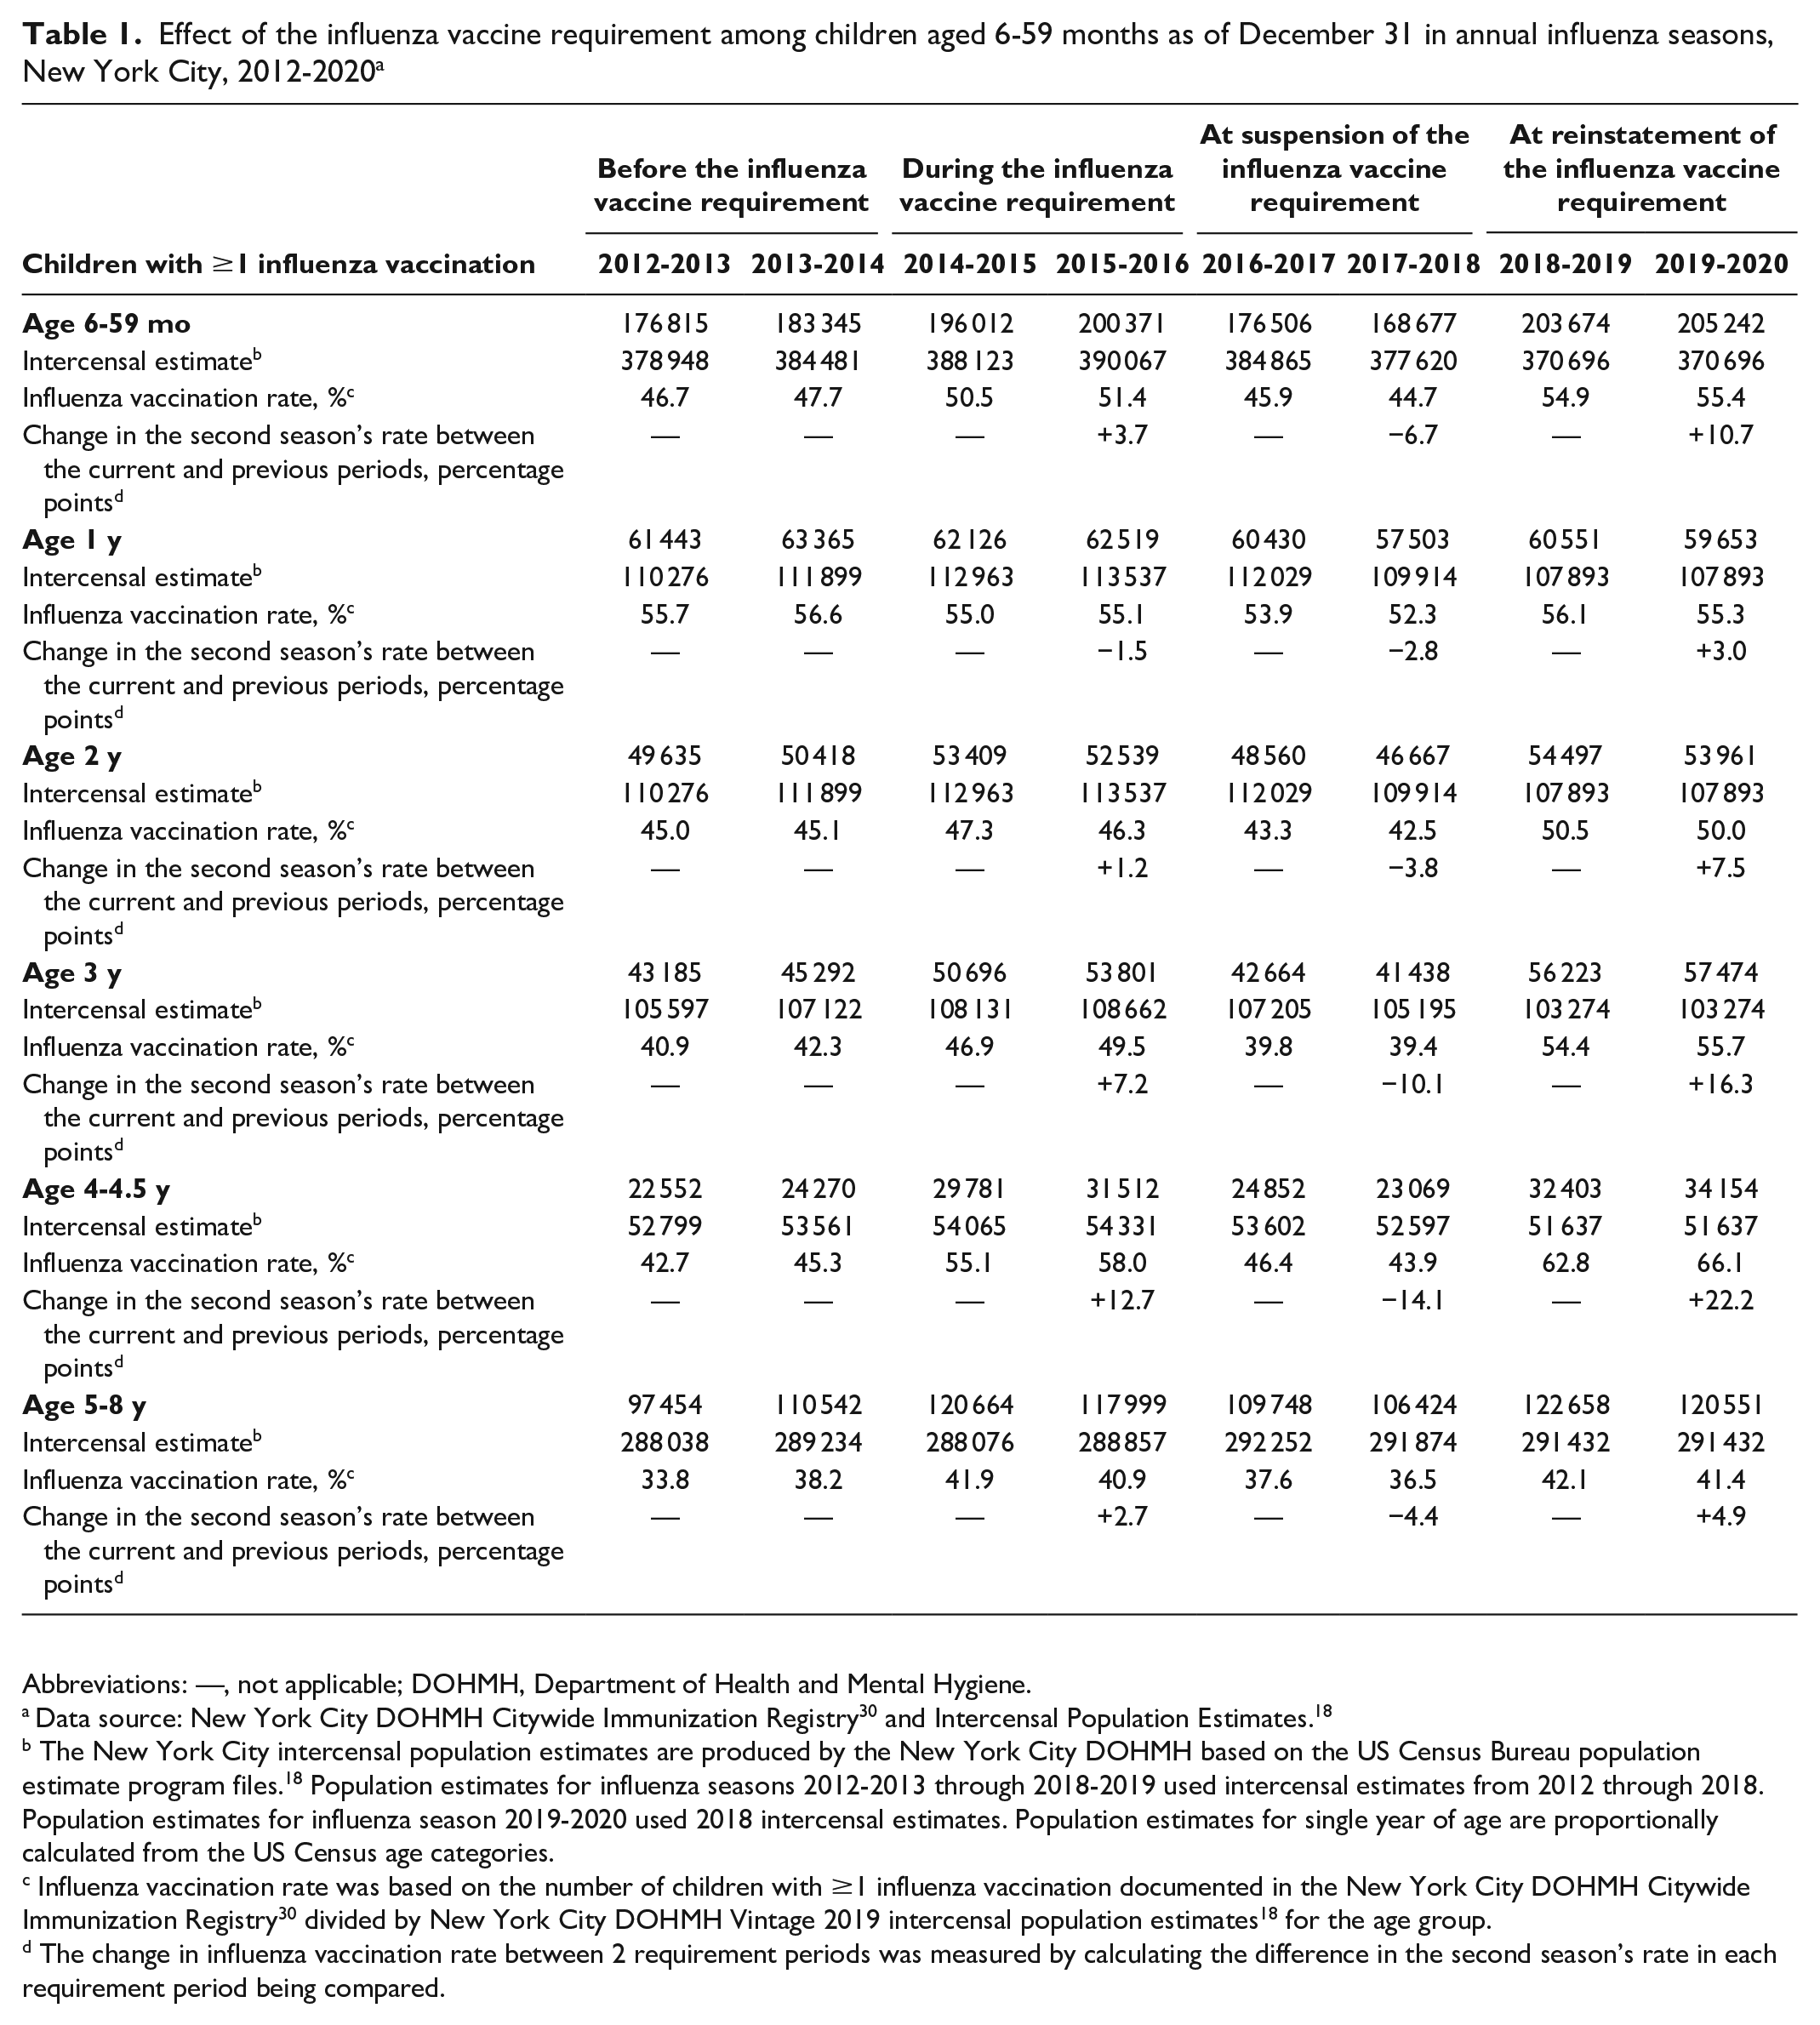
Abbreviations: —, not applicable; DOHMH, Department of Health and Mental Hygiene.
Data source: New York City DOHMH Citywide Immunization Registry 30 and Intercensal Population Estimates. 18
The New York City intercensal population estimates are produced by the New York City DOHMH based on the US Census Bureau population estimate program files. 18 Population estimates for influenza seasons 2012-2013 through 2018-2019 used intercensal estimates from 2012 through 2018. Population estimates for influenza season 2019-2020 used 2018 intercensal estimates. Population estimates for single year of age are proportionally calculated from the US Census age categories.
Influenza vaccination rate was based on the number of children with ≥1 influenza vaccination documented in the New York City DOHMH Citywide Immunization Registry 30 divided by New York City DOHMH Vintage 2019 intercensal population estimates 18 for the age group.
The change in influenza vaccination rate between 2 requirement periods was measured by calculating the difference in the second season’s rate in each requirement period being compared.
When we stratified by single-year age groups, we observed the largest change in influenza vaccination rates among children in the 3- and 4-year-old groups (Table 1, Figure). The rate among children in the 4-year-old group increased 12.7 percentage points from 45.3% (24 270 of 53 561) before the influenza vaccine requirement to 58.0% (31 512 of 54 331) after the requirement took effect. Among children in the 3-year-old group, the rate increased 7.2 percentage points from 42.3% (45 292 of 107 122) before the requirement to 49.5% (53 801 of 108 662) after the requirement took effect. After suspension of the influenza vaccine requirement, rates dropped by 14.1 and 10.1 percentage points among children in the 4- and 3-year-old groups, respectively. After reinstatement of the requirement, vaccination rates rose 22.2 percentage points to 66.1% (34 154 of 51 637) in the 4-year-old group and rose 16.3 percentage points to 55.7% (57 474 of 103 274) in the 3-year-old group.
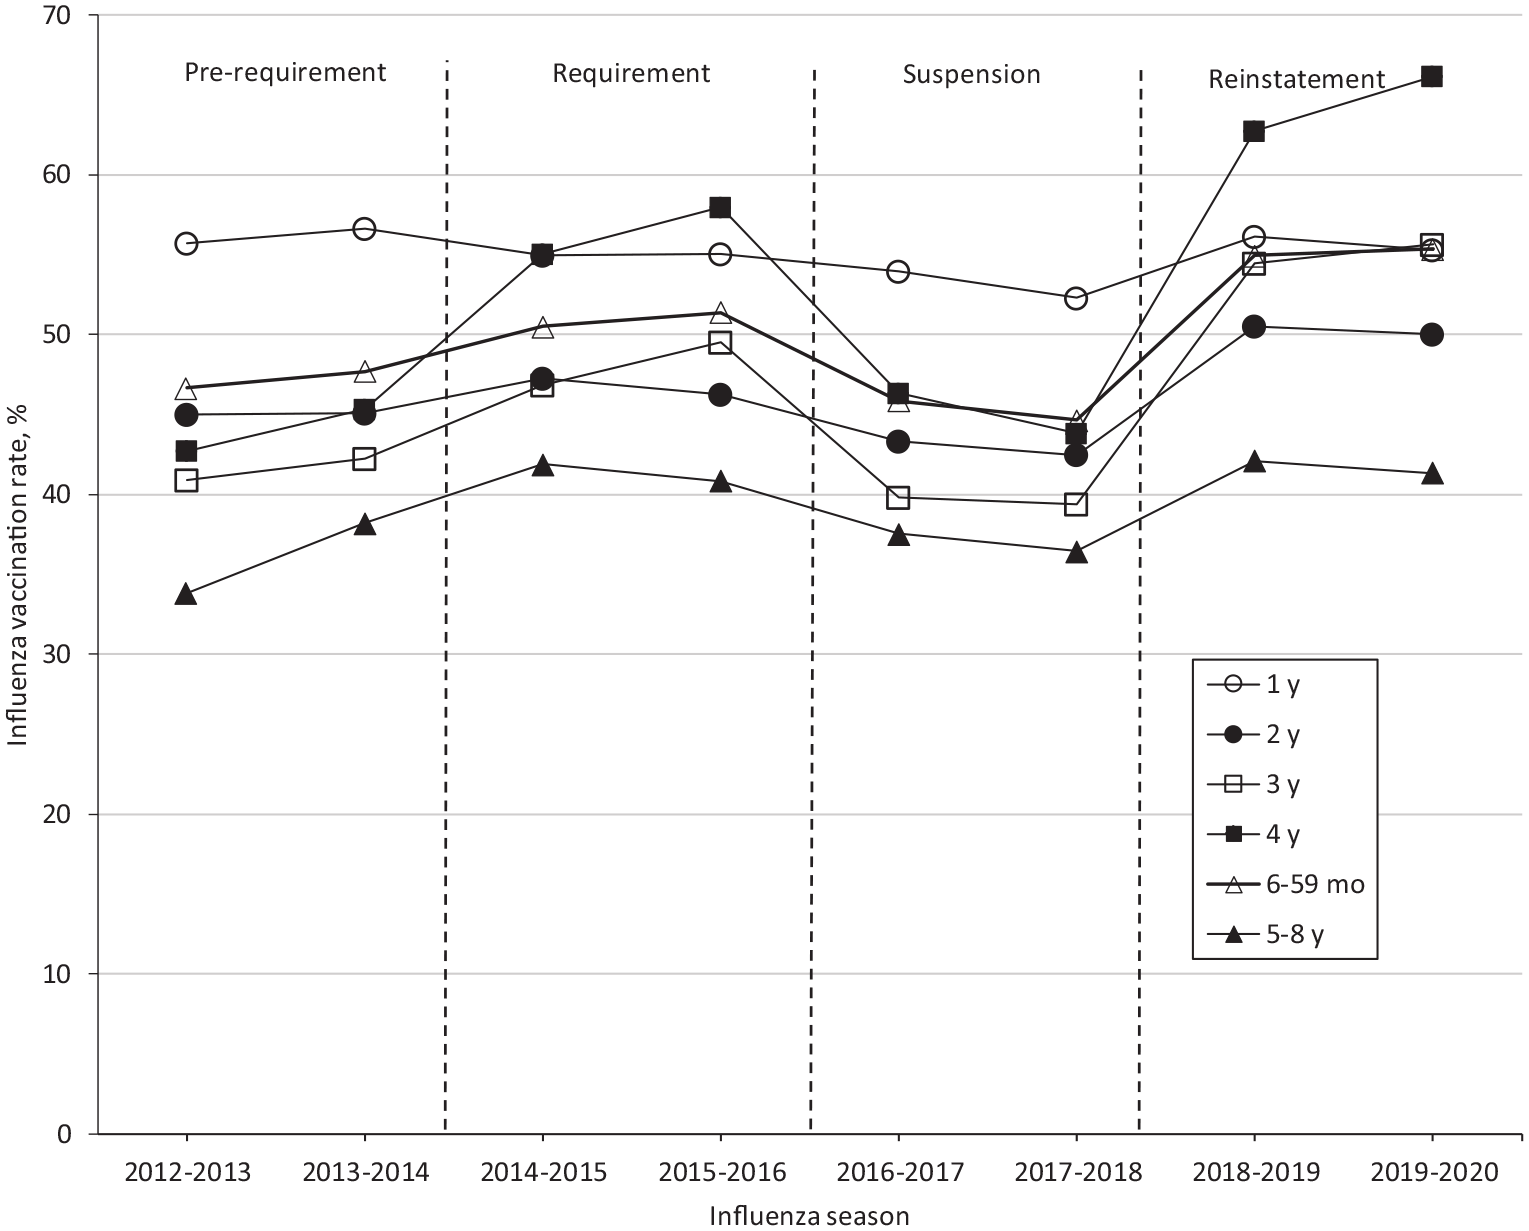
Timeline of the childcare influenza vaccine requirement and influenza vaccination rates, New York City, 2012-2020. Vaccination rates were calculated by using numerator data from the New York City Department of Health and Mental Hygiene (DOHMH) Citywide Immunization Registry, 30 as of April 23, 2020, divided by US Census Bureau Vintage 2019 population estimates. 18 In 2014, the New York City childcare influenza vaccination requirement required all children aged 6-59 months attending city-regulated childcare, including prekindergarten, to receive 1 dose of influenza vaccine during July 1 through December 31 of each year. 16 In November 2015, 5 parents brought a lawsuit against the requirement, which resulted in its suspension by the New York State Supreme Court on December 16, 2015.19,20 The second appeal by the New York City Law Department resulted in a unanimous decision by the New York Court of Appeals to reinstate the requirement on June 28, 2018. 22 The prerequirement period includes influenza seasons 2012-2013 and 2013-2014. The requirement period includes influenza seasons 2014-2015 and 2015-2016. The suspension period includes influenza seasons 2016-2017 and 2017-2018. Children aged 5 through 8 years (not affected by the New York City requirement) were the comparison group. Data sources: New York City DOHMH Citywide Immunization Registry 30 and Intercensal Population Estimates. 18
As shown in the DiD analysis that compared influenza vaccination rates before the requirement versus at the time of the initial requirement, rates among children increased significantly in the 4-year-old group but not in the 6- to 59-month-old or 3-year-old groups. When the requirement was suspended, vaccination rates among children aged 6-59 months, 3 years, and 4 years decreased significantly. When the requirement was reinstated, rates among children aged 6-59 months, 2 years, 3 years, and 4 years increased significantly. Reinstatement of the requirement resulted in significantly decreased vaccination rates among children in the 1-year-old group (Table 2).
DiD analyses of effect of childcare influenza vaccination requirement on influenza vaccination rates, New York City, 2012-2020 a
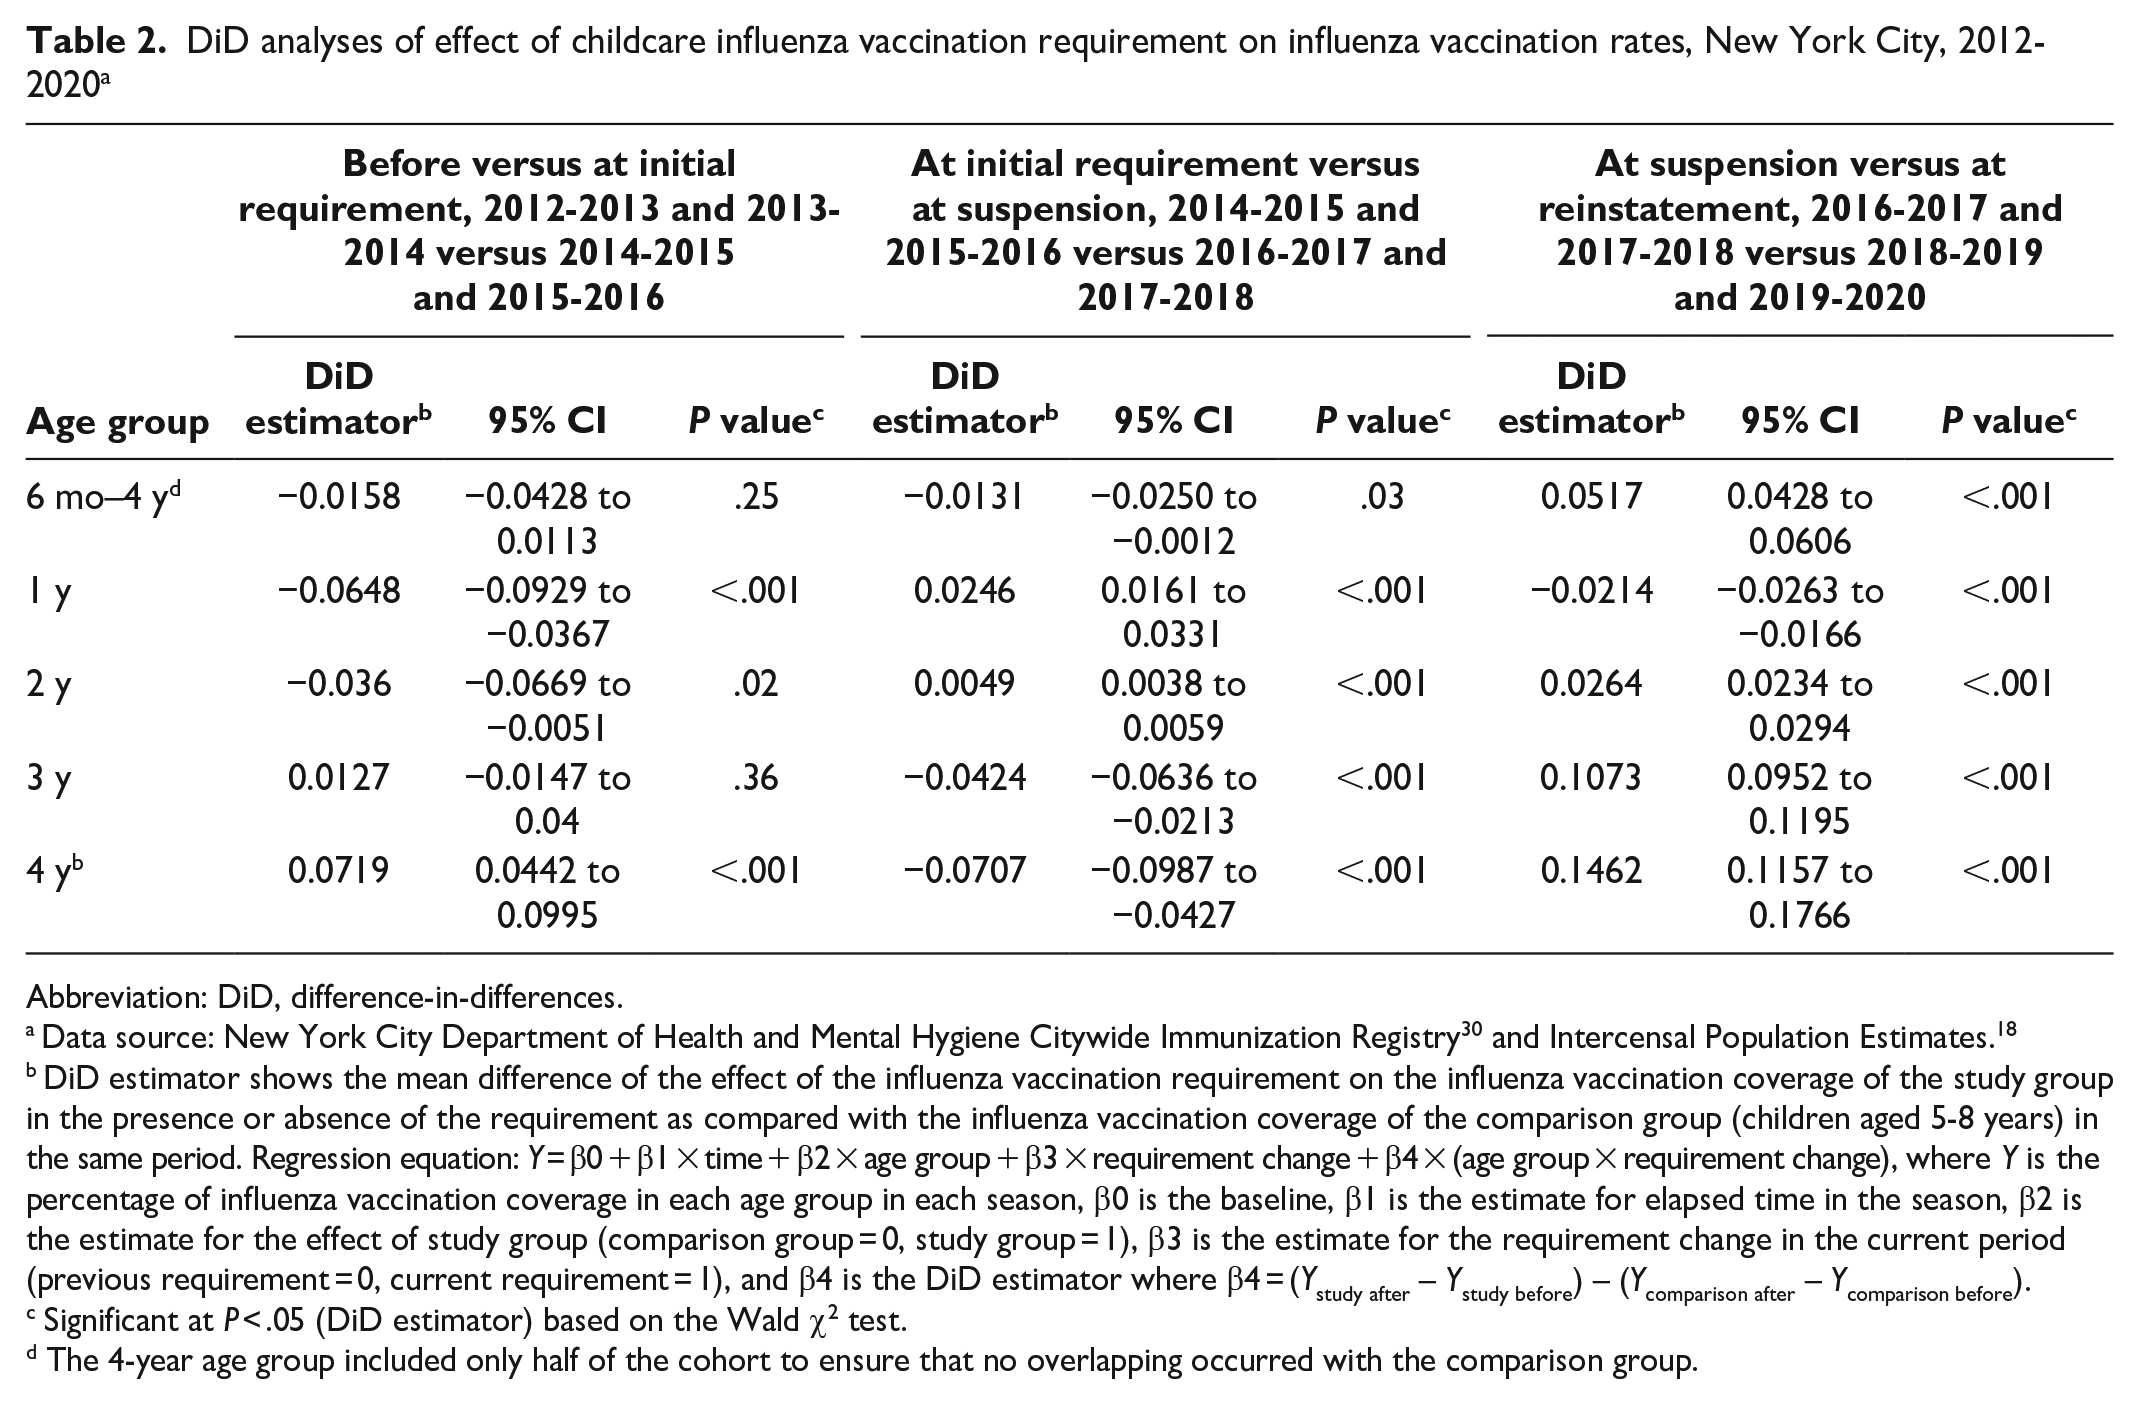
Abbreviation: DiD, difference-in-differences.
Data source: New York City Department of Health and Mental Hygiene Citywide Immunization Registry 30 and Intercensal Population Estimates. 18
DiD estimator shows the mean difference of the effect of the influenza vaccination requirement on the influenza vaccination coverage of the study group in the presence or absence of the requirement as compared with the influenza vaccination coverage of the comparison group (children aged 5-8 years) in the same period. Regression equation: Y = β0 + β1 × time + β2 × age group + β3 × requirement change + β4 × (age group × requirement change), where Y is the percentage of influenza vaccination coverage in each age group in each season, β0 is the baseline, β1 is the estimate for elapsed time in the season, β2 is the estimate for the effect of study group (comparison group = 0, study group = 1), β3 is the estimate for the requirement change in the current period (previous requirement = 0, current requirement = 1), and β4 is the DiD estimator where β4 = (Ystudy after – Ystudy before) – (Ycomparison after – Ycomparison before).
Significant at P < .05 (DiD estimator) based on the Wald χ2 test.
The 4-year age group included only half of the cohort to ensure that no overlapping occurred with the comparison group.
Lessons Learned
The childcare influenza vaccine requirement in New York City increased influenza vaccination rates among young children. A strength of this study was the multiyear observation period that included initial implementation, suspension, and reinstatement of the vaccine requirement, supporting that the increase in influenza vaccination rates resulted from the requirement, not other factors (see Limitations).
Among the 6- to 59-month-olds, influenza vaccination rates increased 10.7 percentage points to 55.4% after the requirement’s reinstatement. This increase is similar to the 16.3 percentage-point increase in the influenza vaccination rate seen among 6- to 59-month-olds in Connecticut after it enacted a childcare influenza vaccine requirement. 15
The change in vaccination rates when the New York City influenza vaccine requirement was in effect versus not in effect was most pronounced among children aged 4 years, consistent with the age when children are likely attending childcare or prekindergarten as compared with the younger ages. The influenza vaccination rate among the 4-year-old age group increased 12.7 percentage points after the requirement took effect, dropped 14.1 percentage points after suspension of the requirement, and rose 22.2 percentage points after reinstatement of the requirement. An increase in influenza vaccination rates associated with the New York City childcare influenza vaccine requirement among 4-year-olds was also seen in a study that used claims data. 31
The increase from before to after the initial requirement among 4-year-olds was significant per DiD analyses. This increase can be explained by the greater proportion of older children attending city-regulated childcare and prekindergarten, who are thus subjected to the influenza vaccine requirement, as compared with younger children. Among children aged <6 years, 4-year-olds represent the largest age group in childcare and preschool. 32 Furthermore, implementation of the childcare influenza vaccine requirement coincided with New York City’s universal prekindergarten initiative for 4-year-olds in September 2015. 17 Hence, around the initial period of the requirement, more 4-year-old children were entering prekindergarten than in prior years and were directly affected by the requirement.
In a comparison of rates from the initial vaccine requirement period to the suspension period, vaccination rates among children in the 6- to 59-month-old, 3-year-old, and 4-year-old groups decreased significantly, supporting the relationship between the requirement and vaccination rate. Similarly, vaccination rates significantly increased between the suspension period and the reinstatement period for children in the 6- to 59-month-old and 2-, 3-, and 4-year-old groups.
Although there was an increase in vaccination rates of 4.9 percentage points among children aged 5-8 years after reinstatement of the vaccine requirement, rates among the 3- and 4-year-old groups increased by 16.3 and 22.2 percentage points, respectively. Changes in vaccination rates among children aged 5-8 years may have been an indirect effect of the requirement, a result of general pediatric influenza vaccine promotion, or a result of other factors.
Limitations
Our evaluation had limitations. First, we could not identify which children were attending childcare and prekindergarten to select an ideal comparison group. Consequently, not all children in the study groups were subjected to the requirement because only a portion (~30% of the population) was attending childcare or prekindergarten. We addressed this limitation by examining rates in children by 1-year age groups to determine whether the requirement affected children likely to be attending childcare or prekindergarten based on age. Our results showed larger changes in vaccination rates among children in the 3- and 4-year age groups versus children in the 1- and 2-year age groups (who were less likely than older children to be in childcare and not eligible for prekindergarten), providing evidence of the requirement’s effect. Because we could not compare the changes in vaccination rates among children directly affected by the requirement with those not affected, the effect of the requirement was also diluted.
Second, factors other than the vaccine requirement may have influenced influenza vaccination rates among children aged 6-59 months at the same time that the requirement was in effect. Factors include annual variations in severity of the influenza season, media coverage of pediatric deaths from influenza, the timing of availability of influenza vaccine, and whether the vaccine was a good match for the circulating virus strains. We could not control for these factors. To reduce validity threats, we used a comparison group of children aged 5-8 years who were not directly affected by the requirement. Results showed similar trends among the comparison group in response to the requirement’s presence and absence, but the magnitude of the changes in the comparison group was substantially less than that among the 3- and 4-year-old groups.
Third, although we explored other statistical methods, they were not a good fit for our data. Measurements of influenza vaccination rates reset each season, and trend analysis requires the use of annual rates. Because of the few data points before and after the vaccine requirement, we could not use segmented or joinpoint regression. Therefore, we used DiD analysis to determine the significance of changes in vaccination rates.
Fourth, because determination of an accurate denominator to measure the proportion of children vaccinated is challenging in the CIR, we used US Census denominators to calculate vaccination rates. Children born in New York City are automatically enrolled with birth certificate information; however, children may move out of the city and the CIR may not be notified. Consequently, these children remain in the CIR and inflate the denominator. Furthermore, some children will move into New York City but may not be added to the CIR if no vaccines are administered there. An additional challenge to determining an accurate denominator is duplicate (ie, unmatched) records, which are estimated to be 5% to 10% of all children’s records in the CIR. 33 The combination of inactive children and duplicate records may have affected absolute vaccination rate estimates but not changes in rates observed with changes in vaccine requirements.
Fifth, the New York City Department of Health and Mental Hygiene knows that some immunization providers, especially those not participating in the Vaccines for Children Program, 34 are not reporting to the CIR. These providers contribute to bias because their patients are not in the CIR. The number of providers who do not report immunizations is estimated to be <10% of all New York City providers administering childhood immunizations, thus likely accounting for a small portion of the child population in New York City. 33 This bias is not expected to threaten internal validity because it is not expected to differentially affect children aged 6-59 months and 5-8 years or to have changed from 2012 forward.
Sixth, this study was based on data from New York City; thus, generalizability may be limited to similar large metropolitan areas.
Conclusions
Influenza vaccination rates among children of childcare age, especially 4-year-olds, increased steeply in New York City when the childcare influenza vaccine requirement was in effect, and they dropped precipitously during the requirement’s suspension. New York City’s influenza vaccine requirement adds to the evidence base showing that vaccine requirements raise vaccination rates.
Footnotes
Declaration of Conflicting Interests
The authors declared no potential conflicts of interest with respect to the research, authorship, and/or publication of this article.
Funding
The authors disclosed receipt of the following financial support for the research, authorship, and/or publication of this article: This study was supported in part by funding from the Centers for Disease Control and Prevention and the City of New York.
Disclaimer
The findings and conclusions in this article are those of the authors and do not necessarily represent the official position of the New York City Department of Health and Mental Hygiene or the Centers for Disease Control and Prevention.