
Abstract
Objectives:
Evidence is limited on differences in cesarean rates for nulliparous, term, singleton, vertex (NTSV) births across racial and ethnic groups at the national and state level during the COVID-19 pandemic. We assessed changes in levels and trends of NTSV cesarean rates before and after stay-at-home orders (SAHOs) were implemented in the United States (1) overall, (2) by racial and ethnic groups, and (3) by 50 US states from January 2017 through December 2021.
Methods:
We used birth certificate data from 2017 through 2021, restricted to hospital births, to calculate monthly NTSV cesarean rates for the United States and for racial and ethnic groups and to calculate quarterly NTSV cesarean rates for the 50 states. We used interrupted time-series analysis to measure changes in NTSV cesarean rates before and after implementation of SAHOs (March 1 through May 31, 2020).
Results:
Of 6 022 552 NTSV hospital births, 1 579 645 (26.2%) were cesarean births. Before implementation of SAHOs, NTSV cesarean rates were declining in the United States overall; were declining among births to non-Hispanic Asian, non-Hispanic Black, Hispanic, and non-Hispanic White women; and were declining in 6 states. During the first month of implementation of SAHOs in May 2020, monthly NTSV rates increased in the United States by 0.55%. Monthly NTSV rates increased by 1.20% among non-Hispanic Black women, 0.90% among Hispanic women, and 0.28% among non-Hispanic White women; quarterly NTSV rates increased in 6 states.
Conclusion:
In addition to emergency preparedness planning, hospital monitoring, and reporting of NTSV cesarean rates to increase provider awareness, reallocation and prioritization of resources may help to identify potential strains on health care systems during public health emergencies such as the COVID-19 pandemic.
Keywords
In the United States, 1 in 3 births occurs by cesarean delivery. 1 Cesarean delivery increases the risk of maternal morbidity in the current pregnancy because of surgical risks and in future pregnancies because of the risk of repeat cesarean section and complications such as placenta accreta spectrum.2,3 In 2014, the American College of Obstetricians and Gynecologists and the Society for Maternal-Fetal Medicine jointly published a consensus statement on the safe prevention of the first cesarean delivery to lower the risk of maternal morbidity for patients. 3 Nulliparous, term, singleton, vertex (NTSV) births delivered by cesarean (“low-risk cesarean”) is a perinatal quality indicator endorsed by The Joint Commission and the National Quality Forum. 4 The indicator focuses on a first-time, uncomplicated pregnancy and assesses the outcome of labor management.5-8 The 2020 NTSV cesarean rate for the United States of 25.9% was higher than the current Healthy People 2030 benchmark of 23.6%. 7 Cesarean rates vary between institutions and localities, and differences in rates have been attributed to local policies, health care provider attitudes and culture, and labor management practices.5,6,8,9 Several states have made progress in lowering NTSV cesarean rates through quality improvement initiatives.10-14
NTSV cesarean rates also vary by race and ethnicity of patients. Data from the National Center for Health Statistics suggested that non-Hispanic Black women have higher NTSV cesarean rates than non-Hispanic White and Hispanic women do. 1 In a study of cesarean births and maternal morbidity among low-risk (ie, having no medical, obstetric, or fetal indications for delivery before 40 5/7 weeks of gestation) nulliparous women at term, non-Hispanic Black and Hispanic women had higher rates of cesarean births than non-Hispanic White women did. The authors estimated that the difference in rates of cesarean births accounted for a modest portion of the excess maternal morbidity among non-Hispanic Black (15.8%) and Hispanic (16.5%) women compared with non-Hispanic White women. 15
All aspects of health care delivery, including perinatal quality improvement, were challenged during the COVID-19 pandemic. The World Health Organization declared COVID-19 a public health emergency of international concern on January 30, 2020, and subsequently a global pandemic on March 11, 2020, leading to implementation of societal lockdowns to control the spread of infection. 16 The pandemic and mitigation measures affected health care access, delivery, and utilization17,18 in the United States, including avoidance of care. 19 Some populations, including pregnant women, were disproportionately affected by the COVID-19 pandemic. 20 Pregnant women with COVID-19 are at increased risk of severe COVID-19–related illness and adverse pregnancy complications, which may increase the risk of undergoing a cesarean delivery.20,21
The combination of societal lockdowns, changes in health care system practices, and distribution of COVID-19 cases among pregnant women can affect outcomes specific to pregnant women, such as cesarean deliveries, further disproportionately affecting people from racial and ethnic minority groups. In this study, we assessed NTSV cesarean rates from 2017 through 2021 before and after implementation of stay-at-home orders (SAHOs) (1) in the United States overall, (2) by racial and ethnic group, and (3) across the 50 states.
Methods
Data, Sample, and Study Design
We used US birth certificate data from NCHS for 50 US states comprising 6 022 552 NTSV hospital births from 2017 through 2021. 22 We used interrupted time-series (ITS) analysis–segmented regression method to measure changes in NTSV cesarean rates before (ie, January 2017 through April 2020) and after (ie, May 2020 through December 2021) implementation of SAHOs.
This secondary analysis of deidentified data was determined to be consistent with applicable federal and Centers for Disease Control and Prevention policy and requirements of public health surveillance as defined in 45 CFR 46.102(l)(2).
Outcome Measures
We used the primary outcome measure, NTSV cesarean birth, defined as a hospital birth to a first-time mother (nulliparous) with singleton gestation (ie, only 1 fetus from a single pregnancy), term gestation (≥37 weeks of gestational age), with fetus in cephalic presentation (ie, head first), and with a cesarean mode of delivery, as the numerator.1,7 We used all hospital singleton term births (≥37 weeks) with cephalic presentation to first-time mothers as the denominator; we thus expressed NTSV cesarean rate as a percentage.
Exposure
From March 1 through May 31, 2020, 39 states issued mandatory SAHOs, 6 states issued only advisory SAHOs, and 5 states did not issue any SAHOs. 23 Because actual dates are not available in our dataset, we used the month and year from birth certificate data to create our primary exposure variable SAHO. Our exposure variable consisted of 2 categories: 0 to indicate “before SAHOs” (ie, January 2017 through April 2020) and 1 to indicate “after SAHOs” (ie, May 2020 through December 2021). The cutoff points ensured that most states had a SAHO in place as some states moved from mandatory to advisory SAHOs. 23
Race and Ethnicity
We used the following racial and ethnic categories available in the dataset: non-Hispanic American Indian or Alaska Native, non-Hispanic Asian, non-Hispanic Black, Hispanic, non-Hispanic Native Hawaiian or Pacific Islander, other races (includes ≥2 races), non-Hispanic White, and race or ethnicity unknown or not stated.
Statistical Analysis
We calculated monthly NTSV cesarean rates (60 time points from January 2017 through December 2021) for the United States. We also determined race- and ethnicity-specific monthly NTSV cesarean rates. We calculated state-specific quarterly NTSV cesarean rates for the 50 states (20 time points) to ensure an adequate sample size for each state and to ensure numerator and denominator thresholds for display and reporting. We described overall characteristics of the population by year, gestational age, maternal age, and maternal race and ethnicity by using frequencies and percentages. We plotted monthly and quarterly NTSV cesarean rates to visualize the time series.
We used ITS-segmented regression analyses to examine the effects of before SAHOs and after SAHOs on NTSV cesarean rates. ITS is a quasi-experimental design to determine the influence of events, such as policies or interventions, at clearly defined time points.24-29 ITS-segmented regression models have 2 parameters of interest: (1) the intercept (ie, level change) and (2) the slope (trend change and/or month-to-month variation). For these parameters, we used the Huitema and McKean 24 formula:

where Yt is the NTSV monthly or quarterly rate measured at time point t to N time points (1 to n1 before SAHOs and n1 + 1 to n2 after SAHOs), with interruption occurring at time T1 (ie, May 2020); Dt is an indicator variable coded as 0 for before SAHOs and as 1 for after SAHOs, β0 is the intercept; β1 is the slope or trend for NTSV before “interruption” or SAHO, expressed as a continuous variable beginning January 2017 to December 2021 (60 months or 20 quarters); β2 is the change in the level at the “interruption” or during SAHOs; β3 is the change in slope or the continuing effect of the SAHO; and εt is the random error term for each month.
We used the augmented Dickey–Fuller unit root test to assess seasonal fluctuations (stationarity) and the Durbin–Watson statistic to test for autocorrelation. We modeled all parameters by using autoregressive errors, as seasonality produces an autocorrelation at the seasonal lag. We used backward stepwise elimination, specifying a lag of 13 for our monthly data and a lag of 5 for our quarterly data. We plotted our residuals and checked for normality by using the Anderson–Darling test and estimated robust SEs by using the Newey–West correction for any heteroscedasticity and autocorrelation.24,25,28 We conducted all analyses with the PROC AUTOREG command 29 in SAS version 9.4 (SAS Institute, Inc) and estimated 95% CIs, with P < .05, 2-sided, indicating significance. To reduce type I error and adjust for multiple testing for race and ethnicity, we calculated Bonferroni-corrected familywise 95% CIs, with adjusted P < .00625 for the 8 racial and ethnic groups and adjusted P < .001 for the 50 states to indicate significance.
Sensitivity Analysis
To address variabilities in our exposure variable (SAHOs, which were in place from March 1 through May 31, 2020 23 ), we used alternate specifications. Our primary specification included preexposure time from January 2017 through April 2020; for the alternate specification, we changed our preexposure from January 2017 through May 2020 for our monthly analysis of NTSV cesarean rates for the United States and for the 8 racial and ethnic groups. We used the alternate specification because some states moved from mandatory to advisory orders during March 1 through May 31, 2020, and a few states did not have SAHOs until the later part of April 2020. We also restricted our analysis to 39 states with mandatory SAHOs and 6 states with advisory SAHOs to assess changes in NTSV cesarean rates in the United States overall and by racial and ethnic group. We did not make any changes to the specification for individual state-specific ITS analysis because our preexposure time included all quarters from January 2017 until the second quarter of 2020 (ie, April through June).
Results
Among 6 022 552 NTSV hospital births in the 50 states from 2017 through 2021, 1 579 645 (26.2%) were NTSV cesarean births (Table 1). Among age groups, women aged ≥35 years had the highest percentage of NTSV cesarean births (41.3%). Rates of NTSV cesarean births were highest among women who were non-Hispanic Black (30.7%), followed by non-Hispanic Asian (27.9%) and non-Hispanic Native Hawaiian or Pacific Islander (27.9%), whose race or ethnicity was unknown or not stated (26.1%), Hispanic (25.4%), non-Hispanic White (25.3%), ≥2 races (24.8%), and non-Hispanic American Indian or Alaska Native (23.1%).
Nulliparous, term, singleton, vertex (NTSV) hospital births for all 50 US states, delivered vaginally and by cesarean, 2017-2021 a
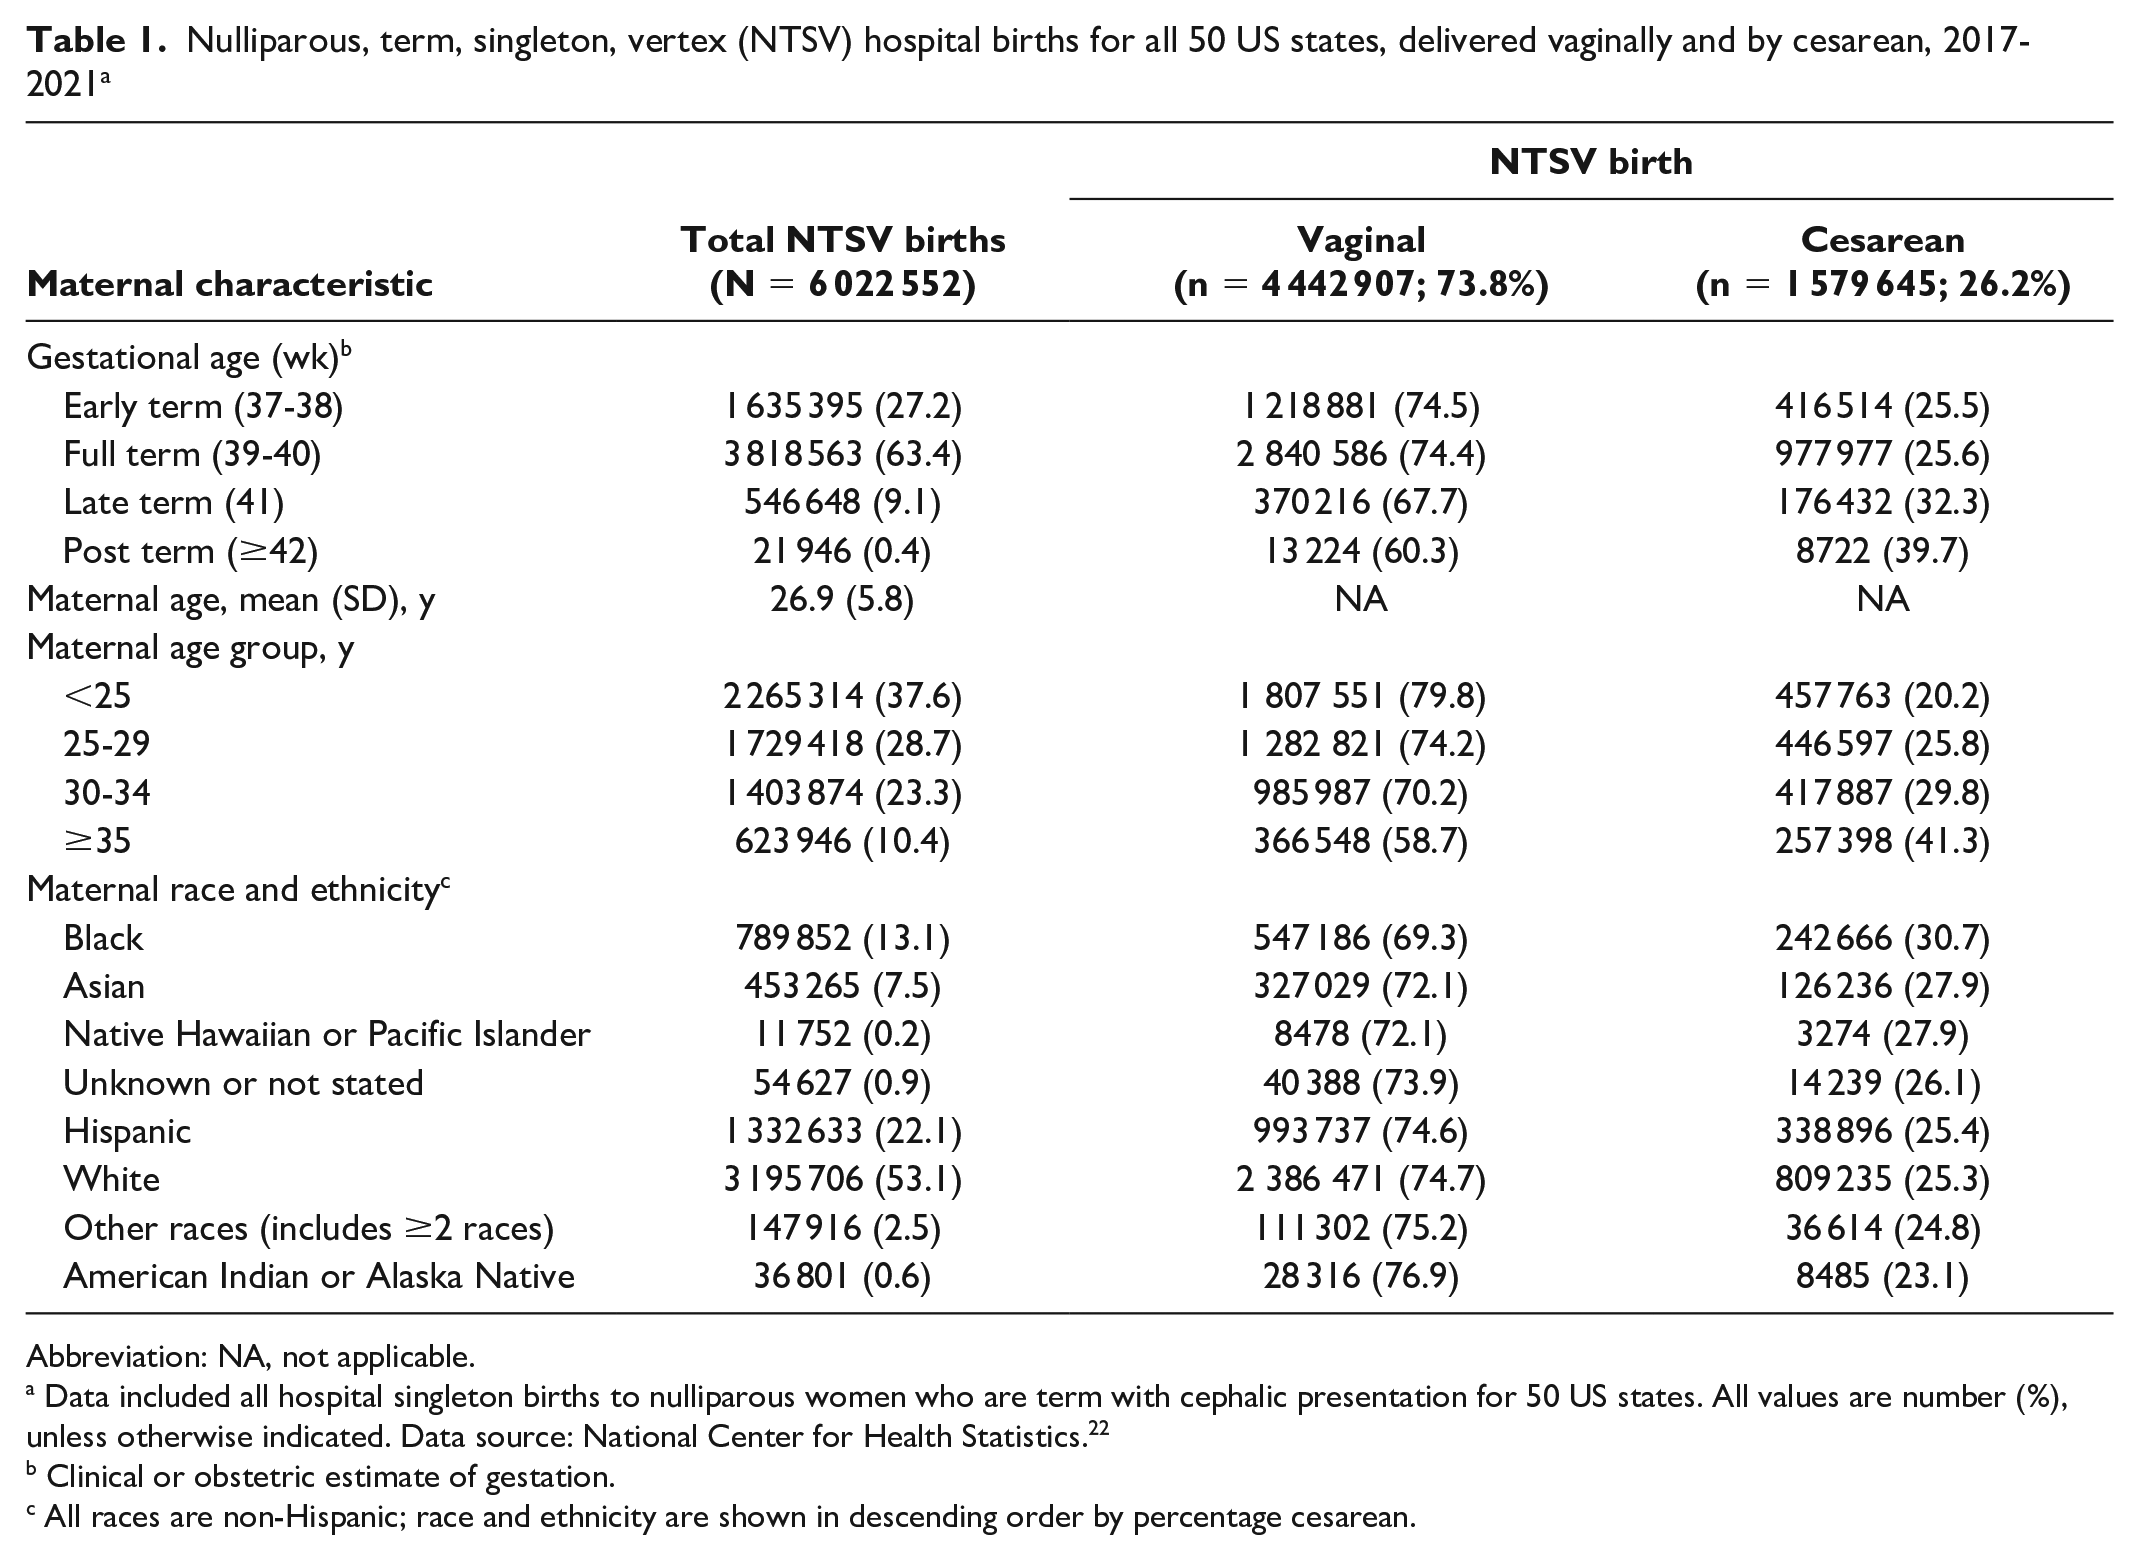
Abbreviation: NA, not applicable.
Data included all hospital singleton births to nulliparous women who are term with cephalic presentation for 50 US states. All values are number (%), unless otherwise indicated. Data source: National Center for Health Statistics. 22
Clinical or obstetric estimate of gestation.
All races are non-Hispanic; race and ethnicity are shown in descending order by percentage cesarean.
Before SAHOs (ie, January 2017 through April 2020), we found a small but significant declining baseline trend in monthly US NTSV rates of 0.01% (95% CI, −0.02% to −0.01%). Monthly US NTSV cesarean rates increased immediately (ie, level change) by 0.55% (95% CI, 0.41%-0.68%) at the first month of SAHOs (May 2020). The slope of the trend changed as NTSV cesarean rates continued to increase after SAHOs (ie, May 2020 through December 2021) (0.04%; 95% CI, 0.03%-0.05%) (Figure 1, Table 2).
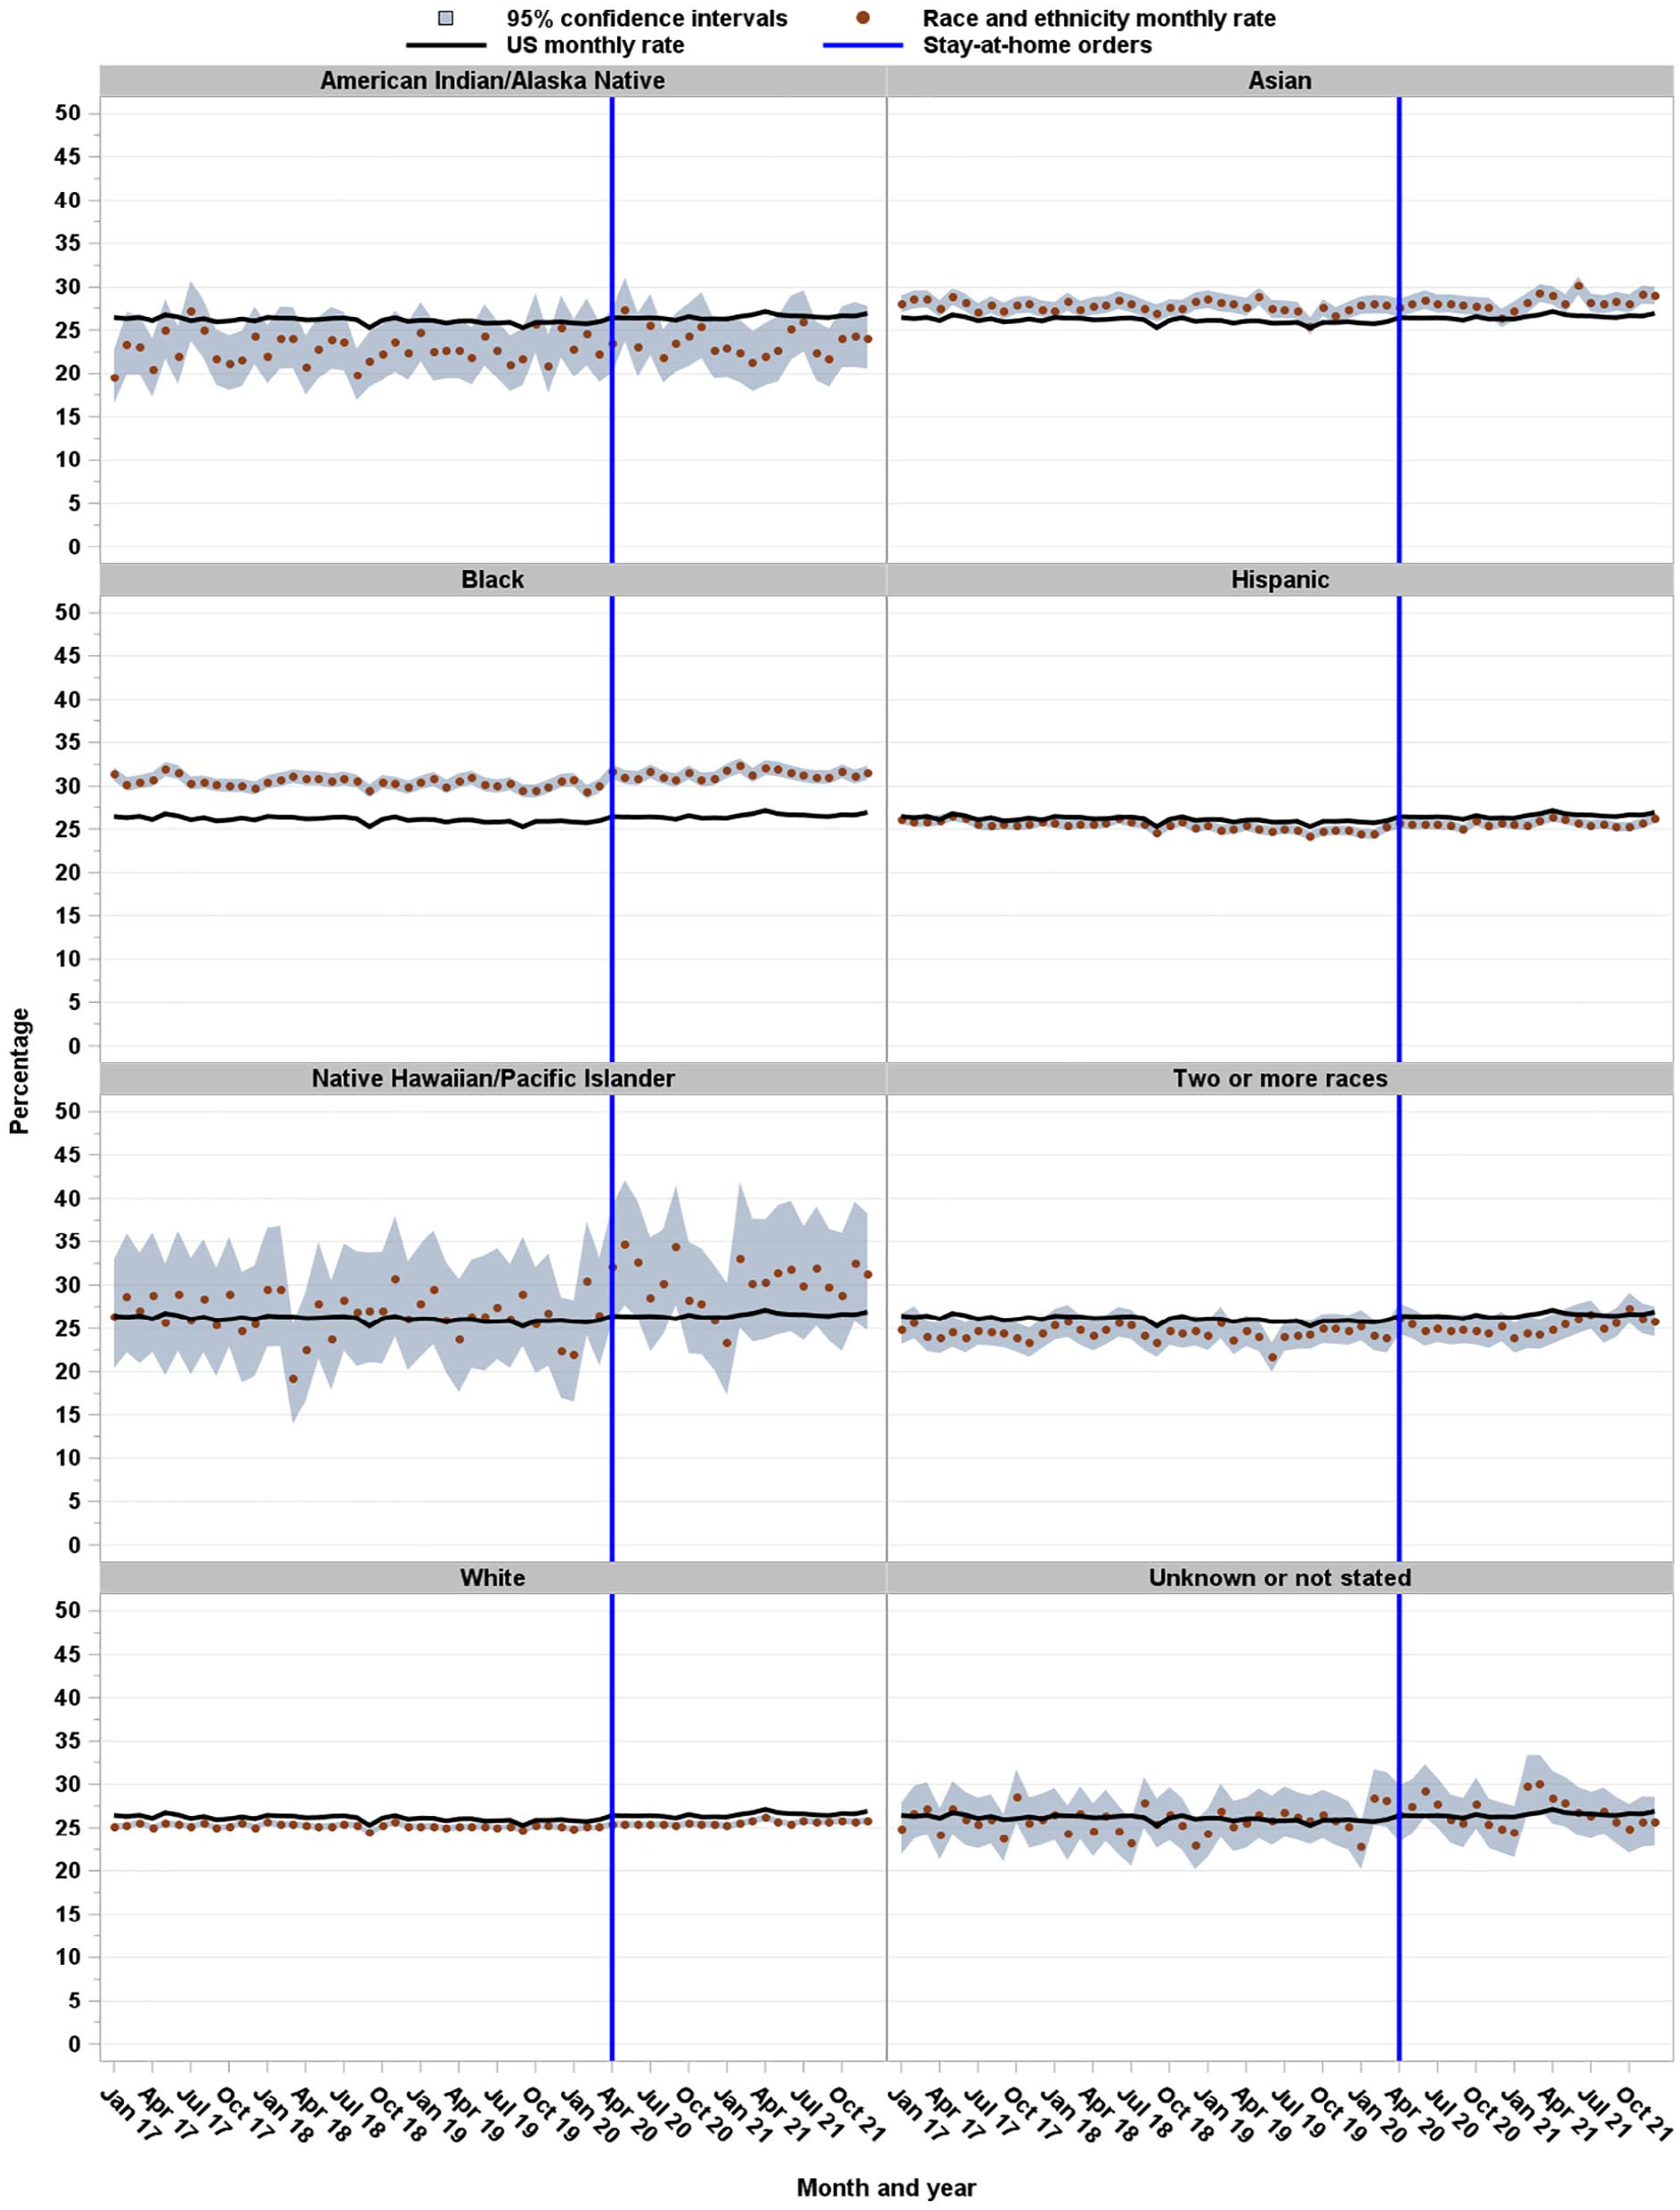
Monthly cesarean rates for nulliparous, term, singleton, vertex (NTSV) births, by race and ethnicity, United States, 2017-2021. NTSV included all hospital singleton births to nulliparous women who are term with cephalic presentation. All races are non-Hispanic. Vertical line indicates the beginning of COVID-19 stay-at-home orders. Before stay-at-home orders comprised January 2017 through April 2020; after stay-at-home orders comprised May 2020 through December 2021. Data source: National Center for Health Statistics. 22
Interrupted time-series regression estimates for cesarean rates among nulliparous, term, singleton, vertex (NTSV) births before and after COVID-19 stay-at-home orders (SAHOs), by race and ethnicity, United States, 2017-2021 a
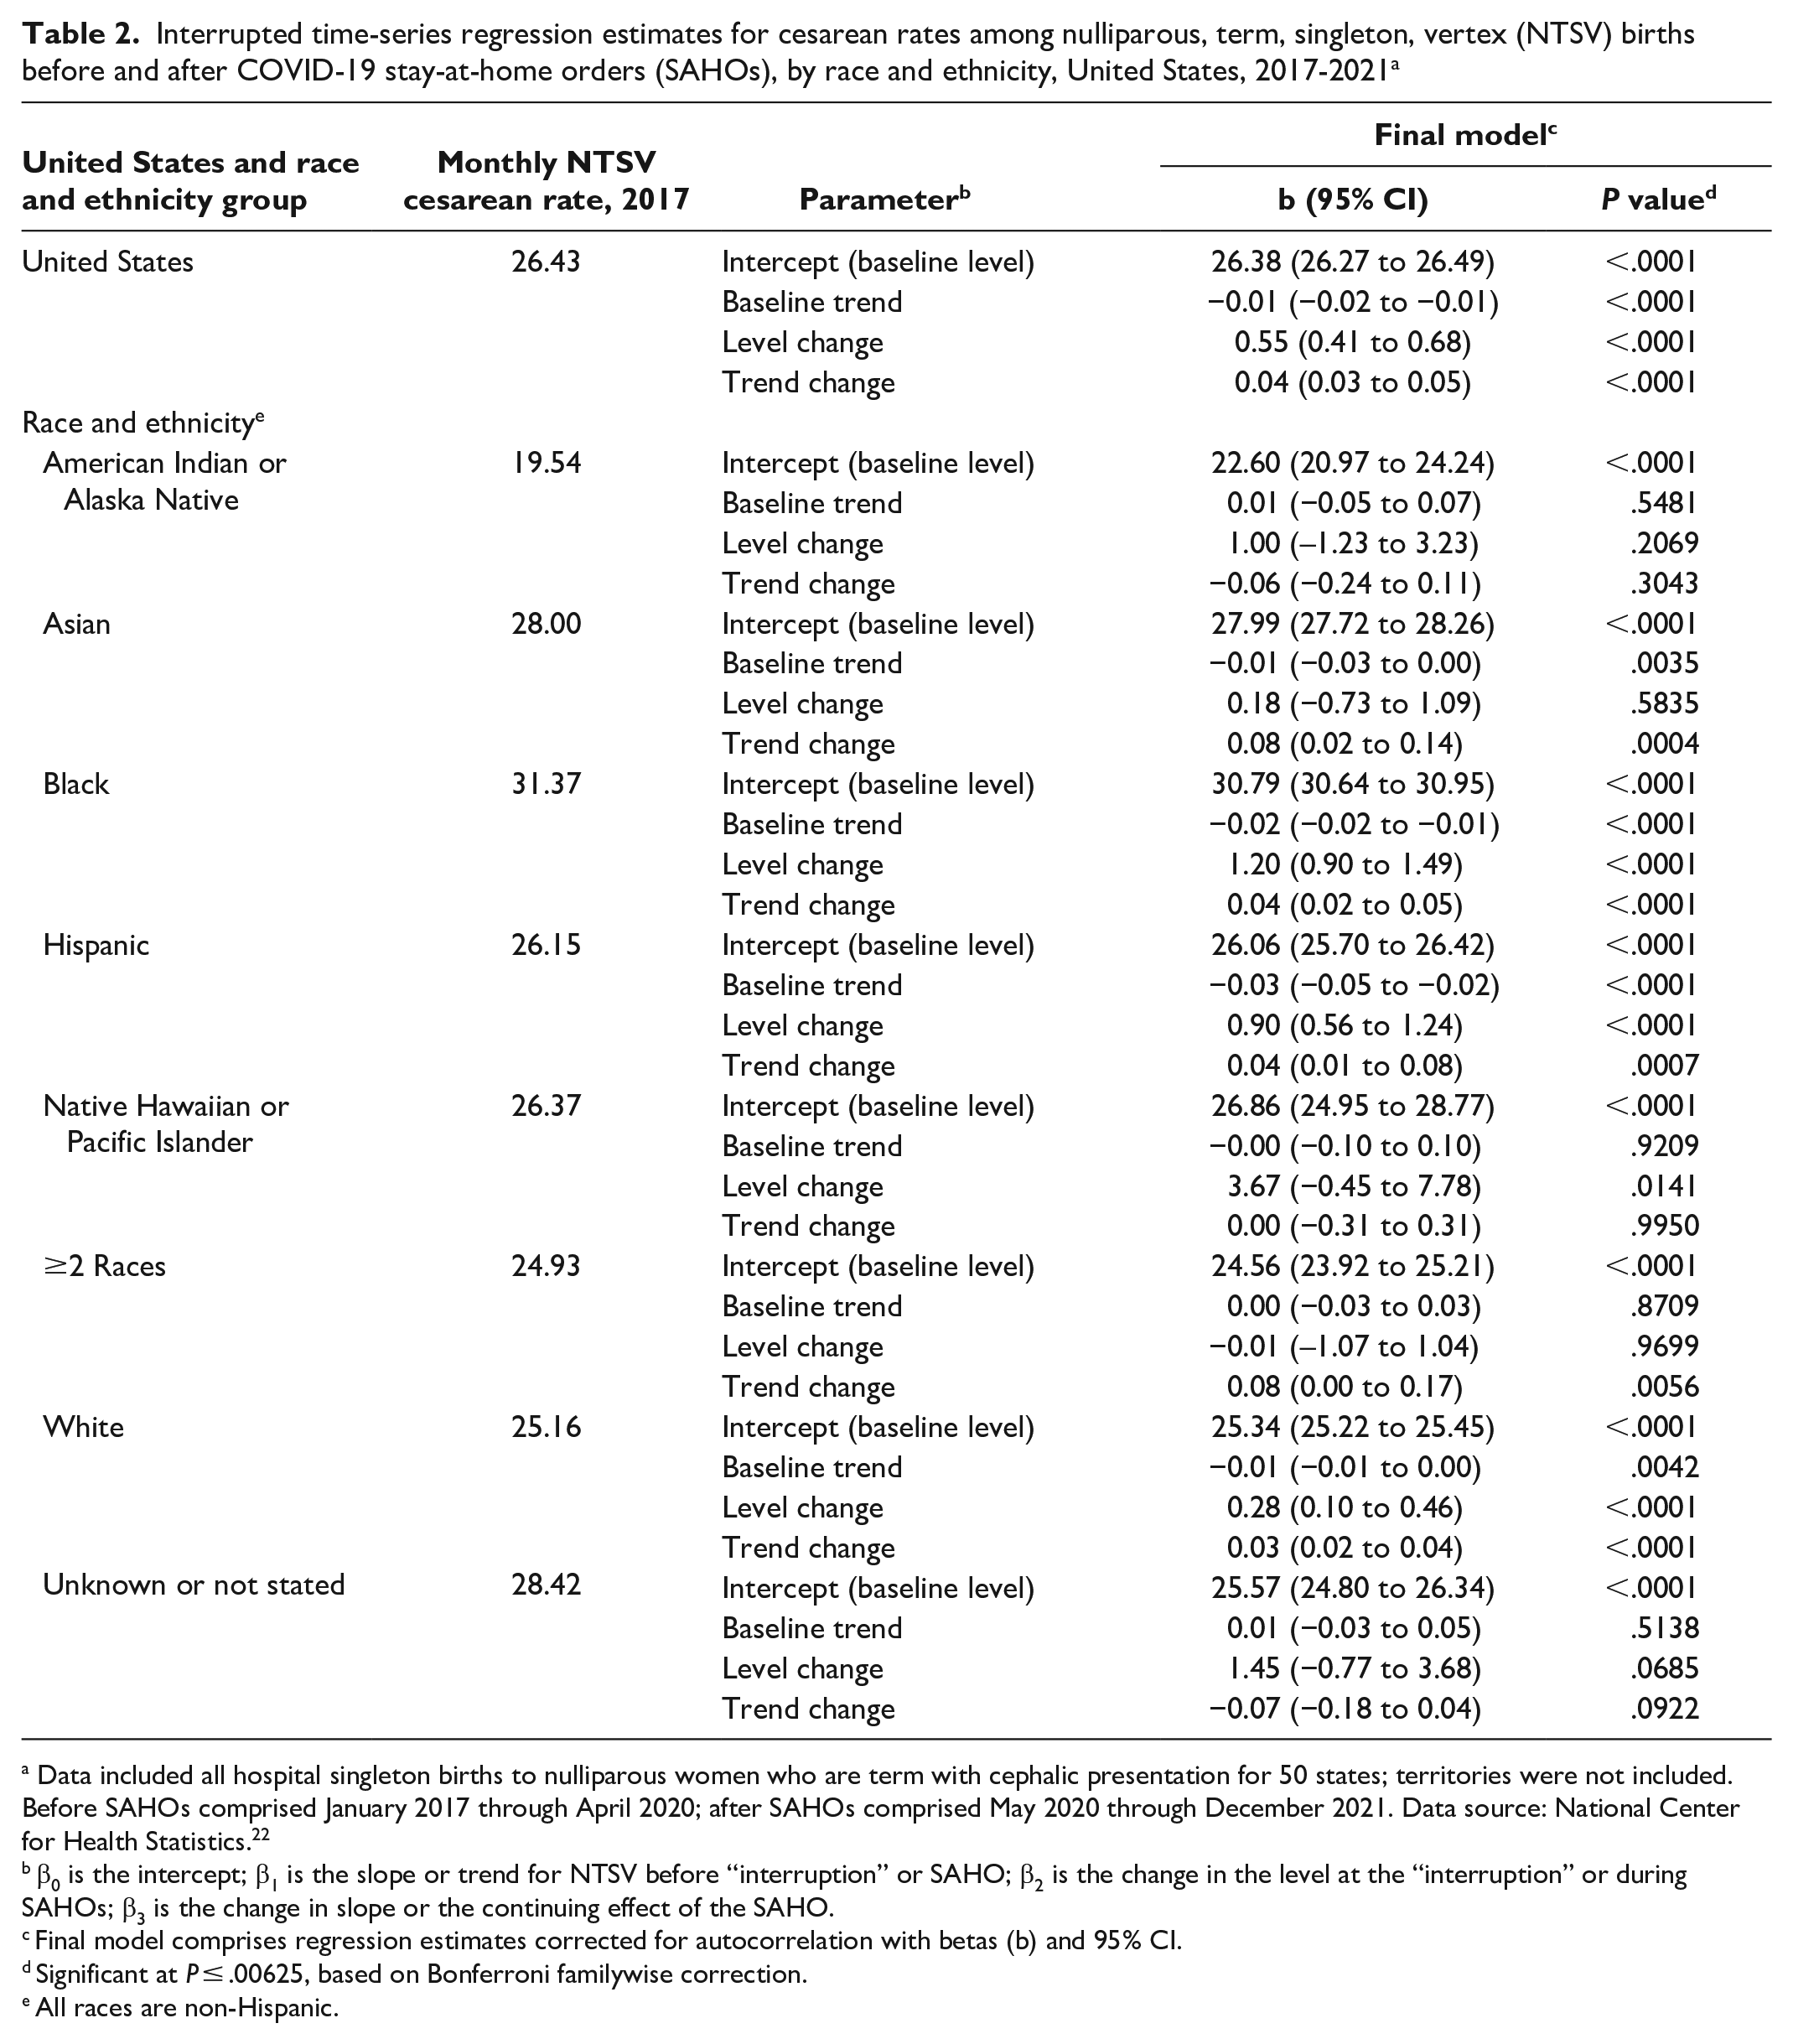
Data included all hospital singleton births to nulliparous women who are term with cephalic presentation for 50 states; territories were not included. Before SAHOs comprised January 2017 through April 2020; after SAHOs comprised May 2020 through December 2021. Data source: National Center for Health Statistics. 22
β0 is the intercept; β1 is the slope or trend for NTSV before “interruption” or SAHO; β2 is the change in the level at the “interruption” or during SAHOs; β3 is the change in slope or the continuing effect of the SAHO.
Final model comprises regression estimates corrected for autocorrelation with betas (b) and 95% CI.
Significant at P ≤ .00625, based on Bonferroni familywise correction.
All races are non-Hispanic.
NTSV cesarean rates were different when stratified by race and ethnicity (Figure 1, Table 2). Before SAHOs, baseline trends in NTSV cesarean rates declined significantly among non-Hispanic Asian (−0.01%; 95% CI, −0.03% to 0%), non-Hispanic Black (−0.02%; 95% CI, −0.02% to −0.01%), Hispanic (−0.03%; 95% CI, −0.05% to −0.02%), and non-Hispanic White (−0.01%; 95% CI, −0.01% to 0%) women. During the first month of SAHOs, NTSV cesarean rates increased (ie, level change) among non-Hispanic Black (1.20%; 95% CI, 0.90% to 1.49%), Hispanic (0.90%; 95% CI, 0.47% to 1.04%), and non-Hispanic White (0.28%; 95% CI, 0.10% to 0.46%) women. After SAHOs, changes in the slope of the trend were significant, with NTSV cesarean rates continuing to increase among non-Hispanic Asian (0.08%; 95% CI, 0.02% to 0.14%), non-Hispanic Black (0.04%; 95% CI, 0.02% to 0.05%), Hispanic (0.04%; 95% CI, 0.01% to 0.08%), and non-Hispanic White (0.03%; 95% CI, 0.02% to 0.04%) women.
Trends in NTSV cesarean rates varied among states (Figures 2 and 3, eTable in Supplemental Material). Before SAHOs, baseline trends in NTSV cesarean rates were declining in California (−0.08%; 95% CI, −0.10% to −0.06%), Florida (−0.23%; 95% CI, −0.41% to −0.06%), Louisiana (−0.23%; 95% CI, −0.34% to −0.12%), Nebraska (−0.43%; 95% CI, −0.64% to −0.23%), New Jersey (−0.32%; 95% CI, −0.45% to −0.19%), Nevada (−0.22%; 95% CI, −0.32% to −0.12%), and Oklahoma (−0.09%; 95% CI, −0.19% to 0%). Baseline trends in NTSV cesarean rates were increasing in Arizona (0.18%; 95% CI, 0.08% to 0.28%) and Ohio (0.15%; 95% CI, 0.10% to 0.19%). The quarterly NTSV cesarean rates for states increased immediately after implementation of SAHOs (ie, level change) in Alabama (0.79%; 95% CI, 0.23% to 1.34%), Iowa (2.15%; 95% CI, 0.99% to 3.31%), Louisiana (2.16%; 95% CI, 0.75% to 3.56%), Mississippi (1.95%; 95% CI, 0.14% to 3.77%), North Carolina (1.64%; 95% CI, 0.78% to 2.50%), and Washington (1.90%; 95% CI, 0.85% to 2.94%). After SAHOs, trends in NTSV cesarean rates (ie, slope change) decreased in Iowa (−0.45%; 95% CI, −0.66% to −0.25%), Ohio (−0.23%; 95% CI, −0.35% to −0.10%), and South Dakota (−0.55%; 95% CI, −0.97% to −0.14%). However, trends in NTSV cesarean rates increased after SAHOs in Alaska (0.79%; 95% CI, 0.12% to 1.47%), California (0.24%; 95% CI, 0.07% to 0.42%), Florida (0.29%; 95% CI, 0.08% to 0.50%), Georgia (0.30%; 95% CI, 0.02% to 0.59%), Michigan (0.29%; 95% CI, 0.03% to 0.55%), Nebraska (0.62%; 95% CI, 0.27% to 0.98%), New York (0.33%; 95% CI, 0.08% to 0.58%), and Oklahoma (0.22%; 95% CI, 0.04% to 0.40%).
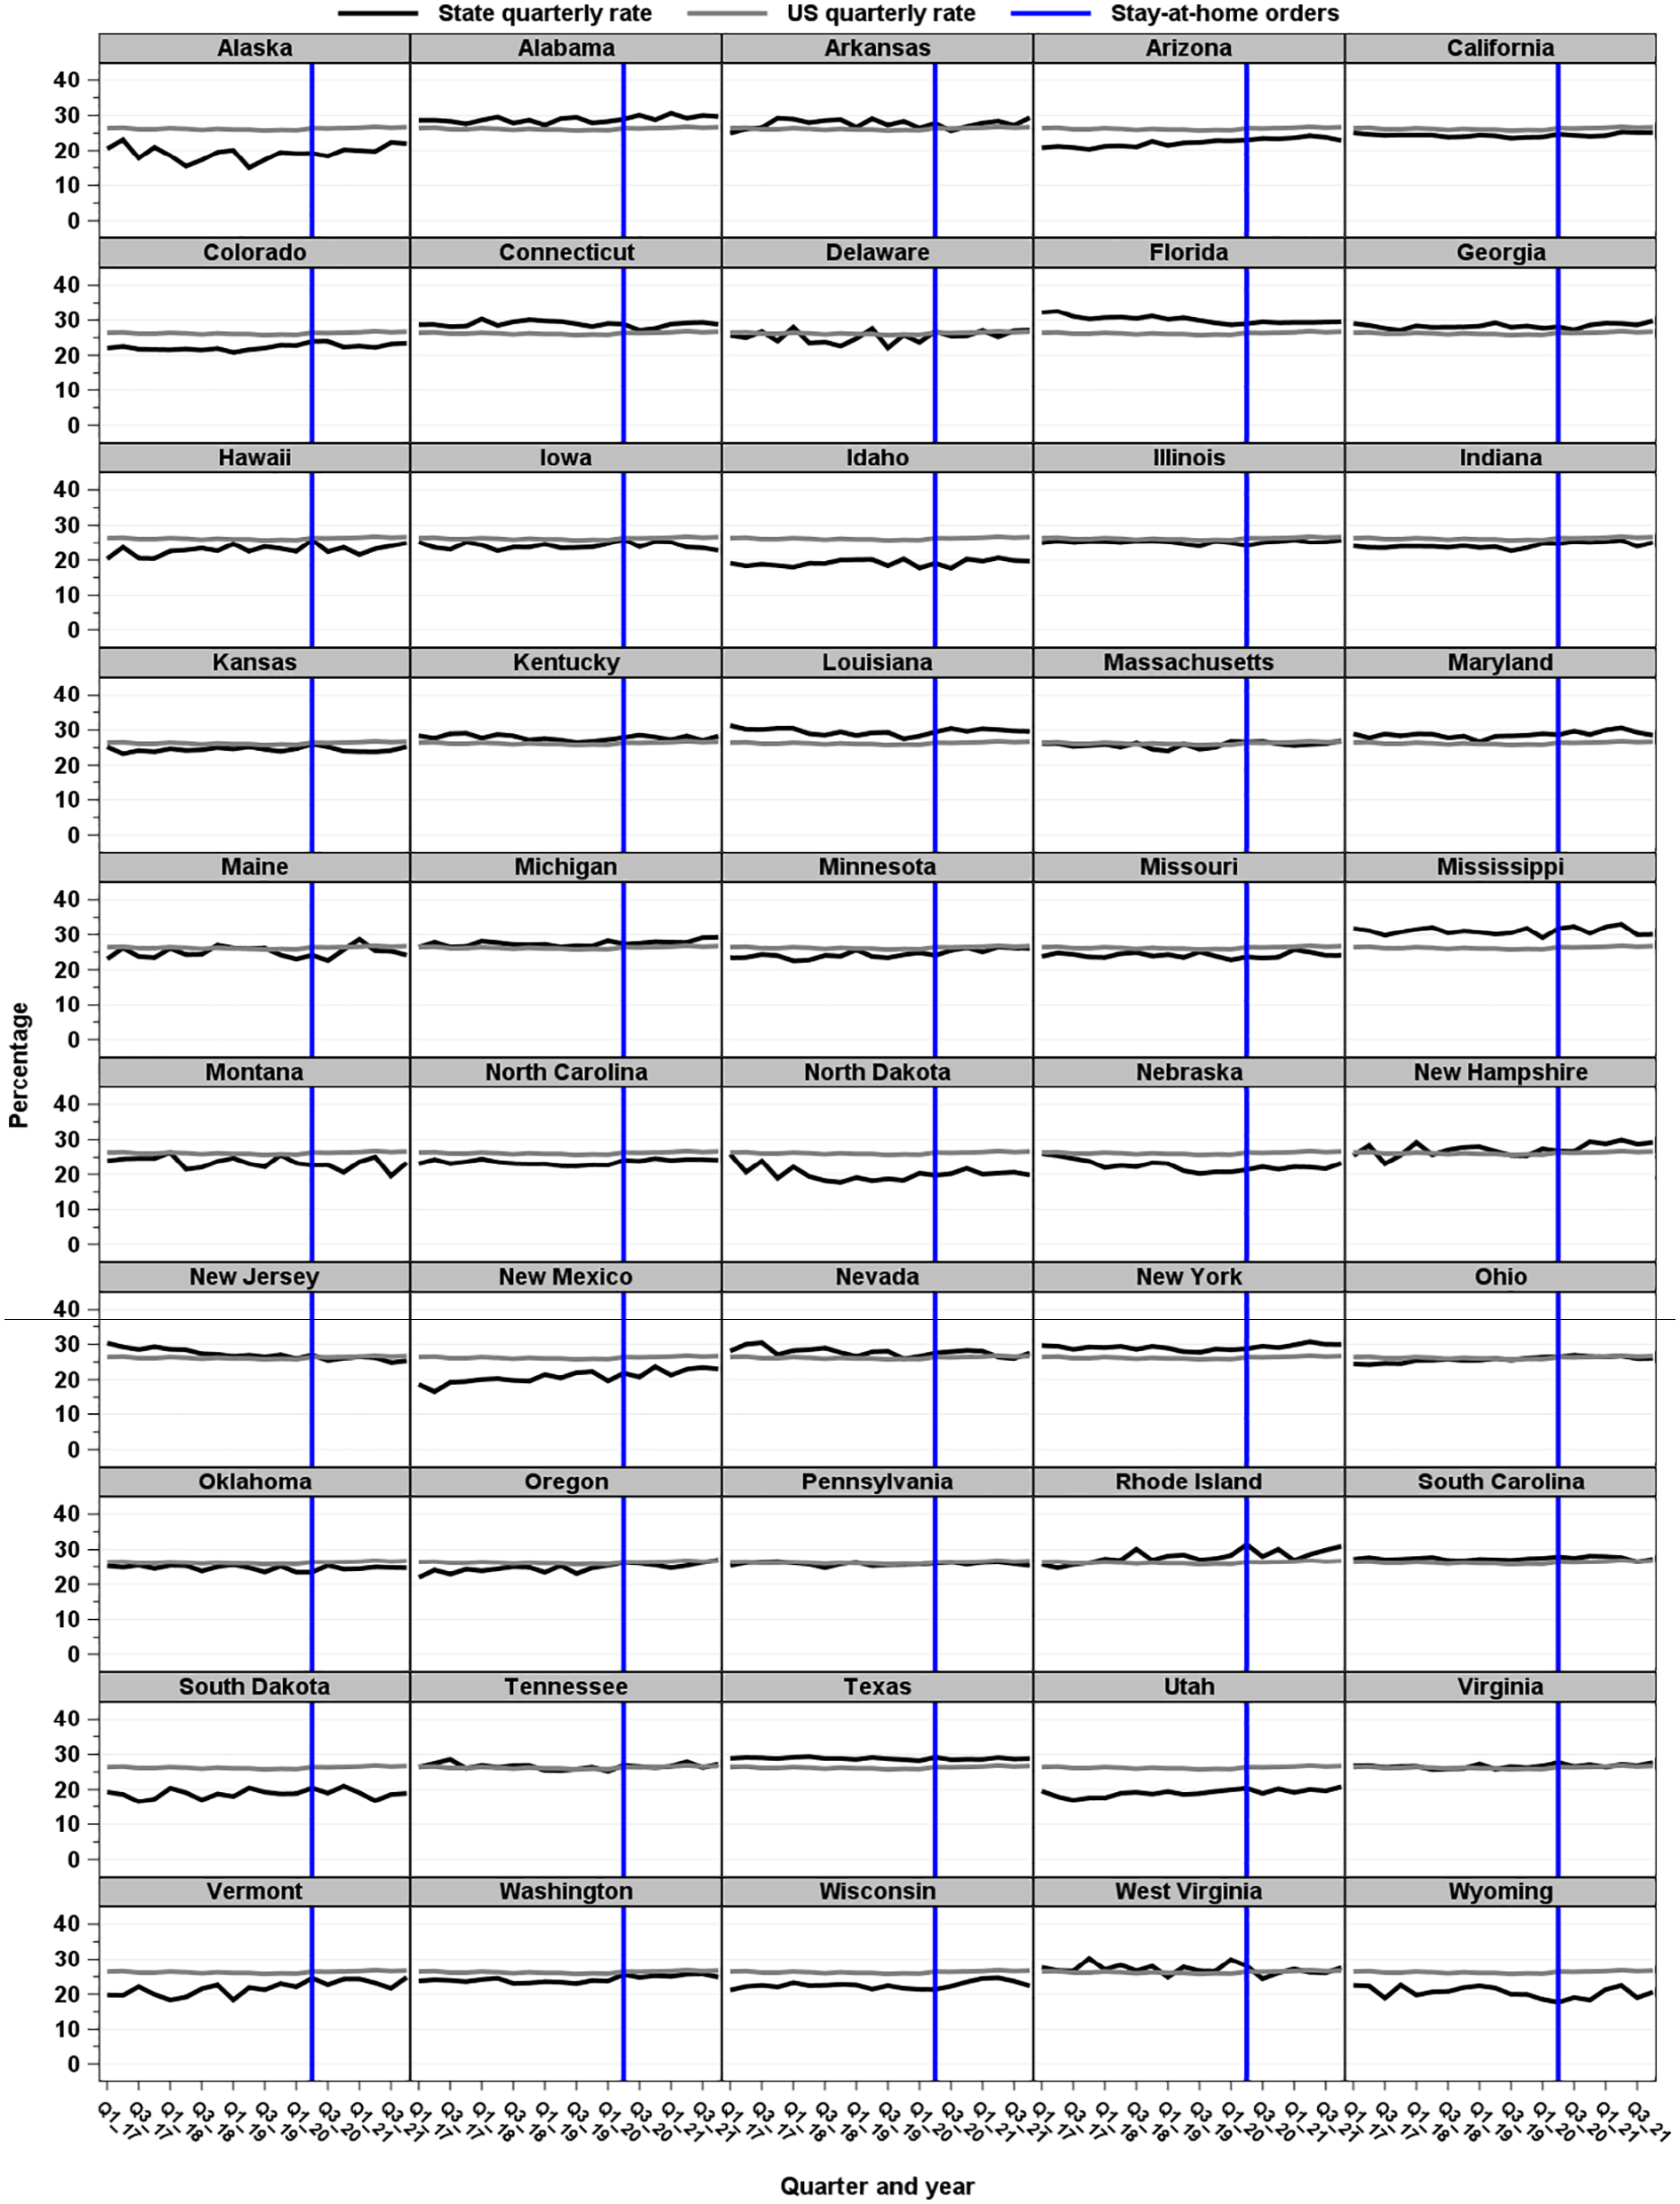
Quarterly cesarean rates for nulliparous, term, singleton, vertex (NTSV) births by state compared with quarterly cesarean rates, United States, 2017-2021. NTSV included all hospital singleton births to nulliparous women that are term with cephalic presentation. The vertical line indicates the beginning of COVID-19 stay-at-home orders. Before stay-at-home orders comprised January 2017 through April 2020; after stay-at-home orders comprised May 2020 through December 2021. Arkansas, Connecticut, Nebraska, North Dakota, and Wyoming did not have stay-at-home orders.
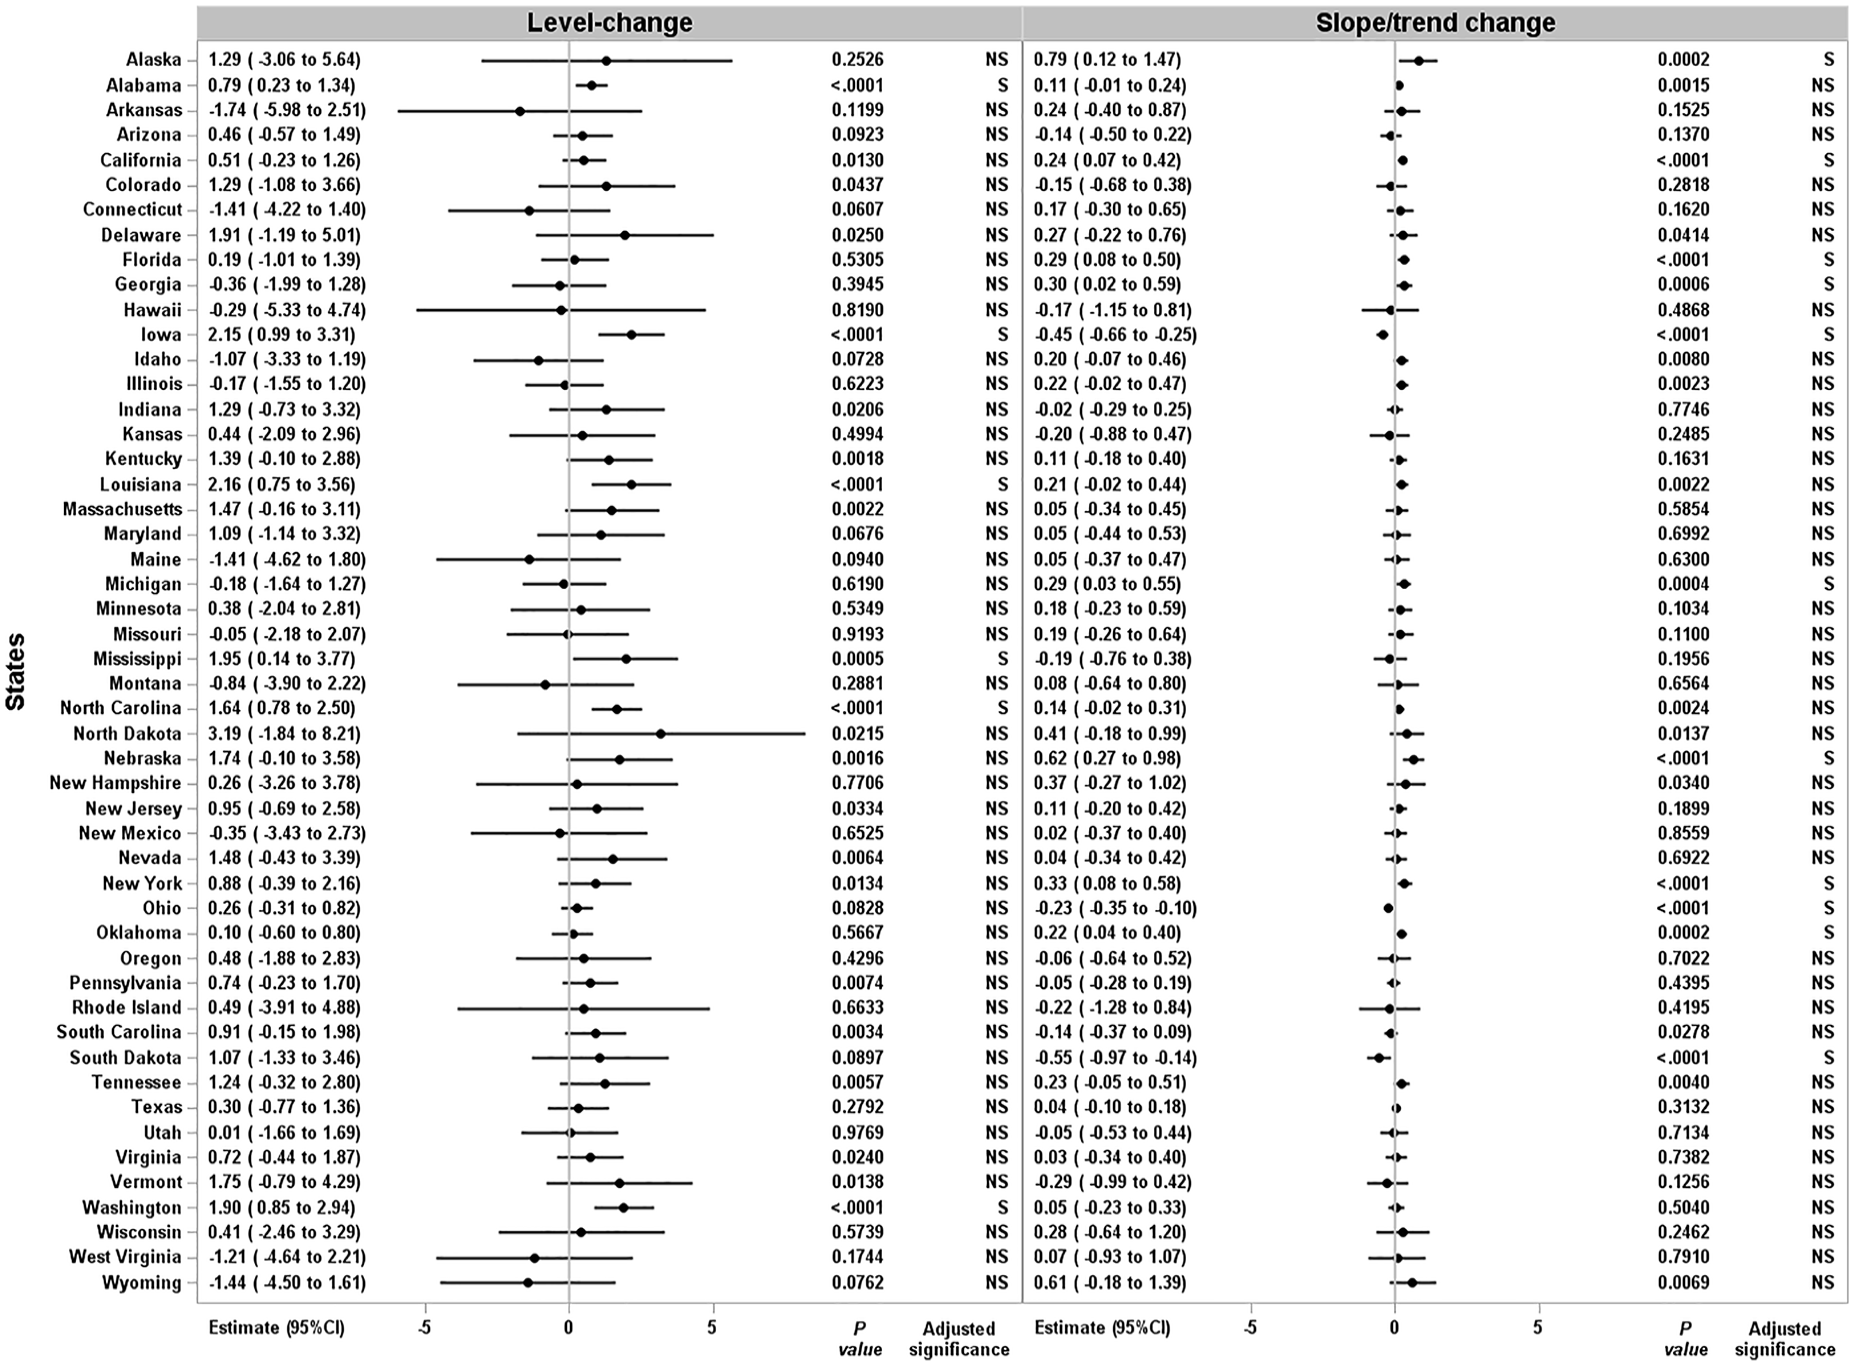
Interrupted time-series regression estimates of cesarean rates for nulliparous, term, singleton, vertex (NTSV) births before and after COVID-19 stay-at-home orders, United States, 2017-2021. NTSV included all hospital singleton births to nulliparous women who are term with cephalic presentation. Before stay-at-home orders comprised January 2017 through April 2020; after stay-at-home orders comprised May 2020 through December 2021. Arkansas, Connecticut, Nebraska, North Dakota, and Wyoming did not have stay-at-home orders. Significant at P ≤ .001, based on Bonferroni familywise correction. Level change (β2) is the change in the level at the “interruption” or during SAHOs; slope/trend change (β3) is the change in slope or the continuing effect of the SAHOs.
In the sensitivity analyses, where we changed our primary specification of the preexposure period or restricted states with mandatory or advisory orders, results in NTSV cesarean rates did not change for the United States overall, and the results did not change when disaggregated by racial and ethnic groups.
Discussion
Analysis of birth certificate data from 2017 through 2021 showed that monthly NTSV cesarean rates increased during the first month of SAHOs in the United States and continued to increase after SAHOs had ended. The association between SAHOs and monthly NTSV cesarean rates differed by race and ethnicity. For example, although NTSV cesarean rates were decreasing for non-Hispanic Asian, non-Hispanic Black, Hispanic, and non-Hispanic White women during January 2017 through April 2020, NTSV cesarean rates increased immediately for non-Hispanic Black, Hispanic, and non-Hispanic White women when SAHOs were implemented. In addition, the immediate increases in the NTSV cesarean rates for non-Hispanic Black and Hispanic women when SAHOs were implemented were 4 and 3 times higher, respectively, compared with non-Hispanic White women.
Our results are consistent with evidence that women from racial and ethnic minority populations at low risk of cesarean delivery share a disproportionate burden of NTSV cesarean rates compared with non-Hispanic White women at low risk of cesarean delivery.1,15 In addition, our study adds to a growing body of literature on the effects of the COVID-19 pandemic on adverse maternal and fetal outcomes. 16
Six states (Alabama, Iowa, Louisiana, Mississippi, North Carolina, and Washington) showed immediate increases in NTSV cesarean rates in the third quarter (ie, July through September 2020) when SAHOs were implemented. Iowa, Ohio, and South Dakota showed downward trends in the NTSV cesarean rates after SAHOs, although Ohio and South Dakota did not have an abrupt increase immediately after implementation of SAHOs. Eight states (Alaska, California, Florida, Georgia, Michigan, Nebraska, New York, and Oklahoma) had increasing NTSV cesarean rates following the SAHO period, although they did not experience an abrupt increase immediately after implementation of SAHOs. These state-specific quarterly trends in NTSV cesarean rates indicate differential effects of SAHOs at the local level. In our previous study of Delaware, in which we used a similar ITS analysis, we found that monthly NTSV cesarean rates increased immediately after implementation of SAHOs and continued to increase following the SAHO period. 30 Two single-hospital studies31,32 that compared data for NTSV cesarean rates for specific periods before and after the COVID-19 pandemic (ie, April 2019 and April 2020 vs April–July 2019 and April–July 2020) found decreases in NTSV cesarean rates. The generalizability of findings from these studies is limited because data were from single hospitals and the studies did not account for seasonal patterns.33,34
The abrupt changes in the overall monthly US NTSV cesarean rates, in monthly NTSV cesarean rates among some racial and ethnic groups, and in quarterly NTSV cesarean rates among some states suggest a concurrent effect on perinatal care in the United States with timing of SAHOs. Although more information is needed to explain the abrupt increase in NTSV cesarean rates during SAHOs, potential contributors include delay or avoidance of clinical care18,19 resulting in worsening maternal or fetal conditions, which require a medically indicated cesarean delivery,20,21 and health care systems–level changes in staffing resources 17 (eg, leading to low levels of resources to manage labor and delivery) and labor and delivery unit practices for infection control or patient management. 35
Strategies are available to reduce NTSV cesarean rates and disparities among racial and ethnic minority populations and to meet the Healthy People 2030 benchmark for an NTSV cesarean rate of 23.6%. 7 The NTSV cesarean quality indicator is routinely reported to The Joint Commission 4 and may be available to hospitals in electronic medical records and birth certificate data, in near-real time or on a monthly or quarterly basis. Such timeliness may be beneficial to detect potential effects on the health care system early in a pandemic environment. Furthermore, stratification of data by racial and ethnic groups can help elucidate disparities in care, outcomes, and the effects of policies and prevention strategies.
State-based perinatal quality collaboratives 36 also play an important role in monitoring NTSV cesarean rates; these collaboratives have implemented quality improvement initiatives that have successfully reduced NTSV cesarean rates.5,7-13,36 State-based perinatal quality collaboratives may develop protocols and provide guidance to improve triage and labor and delivery staffing during public health emergencies. 37 Quality improvement activities during the COVID-19 pandemic have included frequent meetings with multidisciplinary teams, developing and updating guidelines on perinatal care, identifying barriers and fears during the pandemic and how to reduce harm for staff, implementing steps to streamline roles and responsibilities of health care providers, creating real-time dashboards of key metrics for effective decision-making,37-40 postponing nonessential surgeries, reducing intensive care unit (ICU) overflow, rotating schedules to meet surge capacity, and developing ICU training curriculum to educate non-ICU providers to care for critically ill patients (including ventilator management, nutrition, and documentation and billing procedures).38-40
Limitations
This study had some limitations. First, birth certificate data are administrative data, and the accuracy of certain conditions for medical indications may lack sensitivity or may be overestimated. 41 The NTSV measure on the birth certificate also does not account for clinical indications in which a cesarean birth may be necessary. Factors for risk adjustment of NTSV cesarean rates typically include maternal age at delivery, demographic characteristics, socioeconomic status, maternal risk factors, access to care, and maternal comorbidities.5,8,13,14 However, a strength of an ITS analysis is that the analysis is generally unaffected by typical confounding variables, which remain fairly constant 24 (ie, do not change month to month). Second, although our study assessed NTSV cesarean rates by race and ethnicity, potential misclassification of race and ethnicity on birth certificates may underestimate NTSV cesarean rates among racial and ethnic groups. Third, hospital and health systems may have also implemented policies about care practices coinciding with SAHOs; however, these data were not available, and as such unmeasured, and could contribute to residual confounding.
Conclusions
This analysis provided time-series estimates of NTSV cesarean rates at national and state levels, which were stratified by race and ethnicity for all NTSV hospital births in the United States from 2017 through 2021. When NTSV cesarean rates were compared among racial and ethnic groups and across 50 states before and after SAHOs, implemented from March 1 through May 31, 2020, NTSV cesarean rates abruptly increased during SAHOs in the United States, with differential effects among racial and ethnic minority groups and across states. In addition to emergency preparedness planning, hospital monitoring, and reporting of perinatal quality indicators, further awareness is needed on NTSV cesarean rates among health care providers; efficient management of clinical resources through surge capacity staffing in labor and delivery units might improve obstetric care, as measured by perinatal quality indicators during public health emergencies. Because NTSV cesarean rates are available in birth certificate data and in hospital electronic medical records in near-real time or on a monthly or quarterly basis, the NTSV cesarean rate may be a useful indicator for identifying potential strains on health care systems during public health emergencies such as the COVID-19 pandemic.
Supplemental Material
sj-docx-1-phr-10.1177_00333549241236629 – Supplemental material for Differences in Cesarean Rates for Nulliparous, Term, Singleton, Vertex Births Among Racial and Ethnic Groups and States Before and After Stay-at-Home Orders During the COVID-19 Pandemic, United States, 2017-2021
Supplemental material, sj-docx-1-phr-10.1177_00333549241236629 for Differences in Cesarean Rates for Nulliparous, Term, Singleton, Vertex Births Among Racial and Ethnic Groups and States Before and After Stay-at-Home Orders During the COVID-19 Pandemic, United States, 2017-2021 by Khaleel S. Hussaini, Romeo Galang and Rui Li in Public Health Reports
Footnotes
Disclaimer
The findings and conclusions in this study are those of the authors and do not necessarily represent the official views of, nor an endorsement by, the Centers for Disease Control and Prevention, the Health Resources and Services Administration, the US Department of Health and Human Services, or the US government.
Declaration of Conflicting Interests
The authors declared no potential conflicts of interest with respect to the research, authorship, and/or publication of this article.
Funding
The authors received no financial support for the research, authorship, and/or publication of this article.
Supplemental Material
Supplemental material for this article is available online. The authors have provided these supplemental materials to give readers additional information about their work. These materials have not been edited or formatted by Public Health Reports’s scientific editors and thus may not conform to the guidelines of the AMA Manual of Style, 11th Edition.
References
Supplementary Material
Please find the following supplemental material available below.
For Open Access articles published under a Creative Commons License, all supplemental material carries the same license as the article it is associated with.
For non-Open Access articles published, all supplemental material carries a non-exclusive license, and permission requests for re-use of supplemental material or any part of supplemental material shall be sent directly to the copyright owner as specified in the copyright notice associated with the article.