
Abstract
Objectives:
Hepatitis C virus (HCV) infection is the most common bloodborne infection in the United States. We assessed trends in HCV testing, infection, and surveillance cases among US adults.
Methods:
We used Quest Diagnostics data from 2013-2021 to assess trends in the numbers tested for HCV antibody and proportion of positivity for HCV antibody and HCV RNA. We also assessed National Notifiable Diseases Surveillance System 2013-2020 data for trends in the number and proportion of hepatitis C cases. We applied joinpoint regression for trends testing.
Results:
Annual HCV antibody testing increased from 1.7 million to 4.8 million from 2013 to 2021, and the positivity proportion declined (average, 0.2% per year) from 5.5% to 3.7%. The greatest percentage-point increase in HCV antibody testing occurred in hospitals and substance use disorder treatment facilities and among addiction medicine providers. HCV RNA positivity was stable at about 60% in 2013-2015 and declined to 41.0% in 2021 (2015-2021 average, −3.2% per year). Age-specific HCV RNA positivity was highest among people aged 40-59 years during 2013-2015 and among people aged 18-39 years during 2016-2021. The number of reported hepatitis C cases (acute and chronic) declined from 179 341 in 2015 to 105 504 in 2020 (average decline, −13 177 per year). The proportion of hepatitis C cases among those aged 18-39 years increased by an average of 1.4% per year during 2013-2020; among individuals aged 40-59 years, it decreased by an average of 2.3% per year during 2013-2018.
Conclusions:
HCV testing increased, suggesting improved universal screening. Various data sources are valuable for monitoring elimination progress.
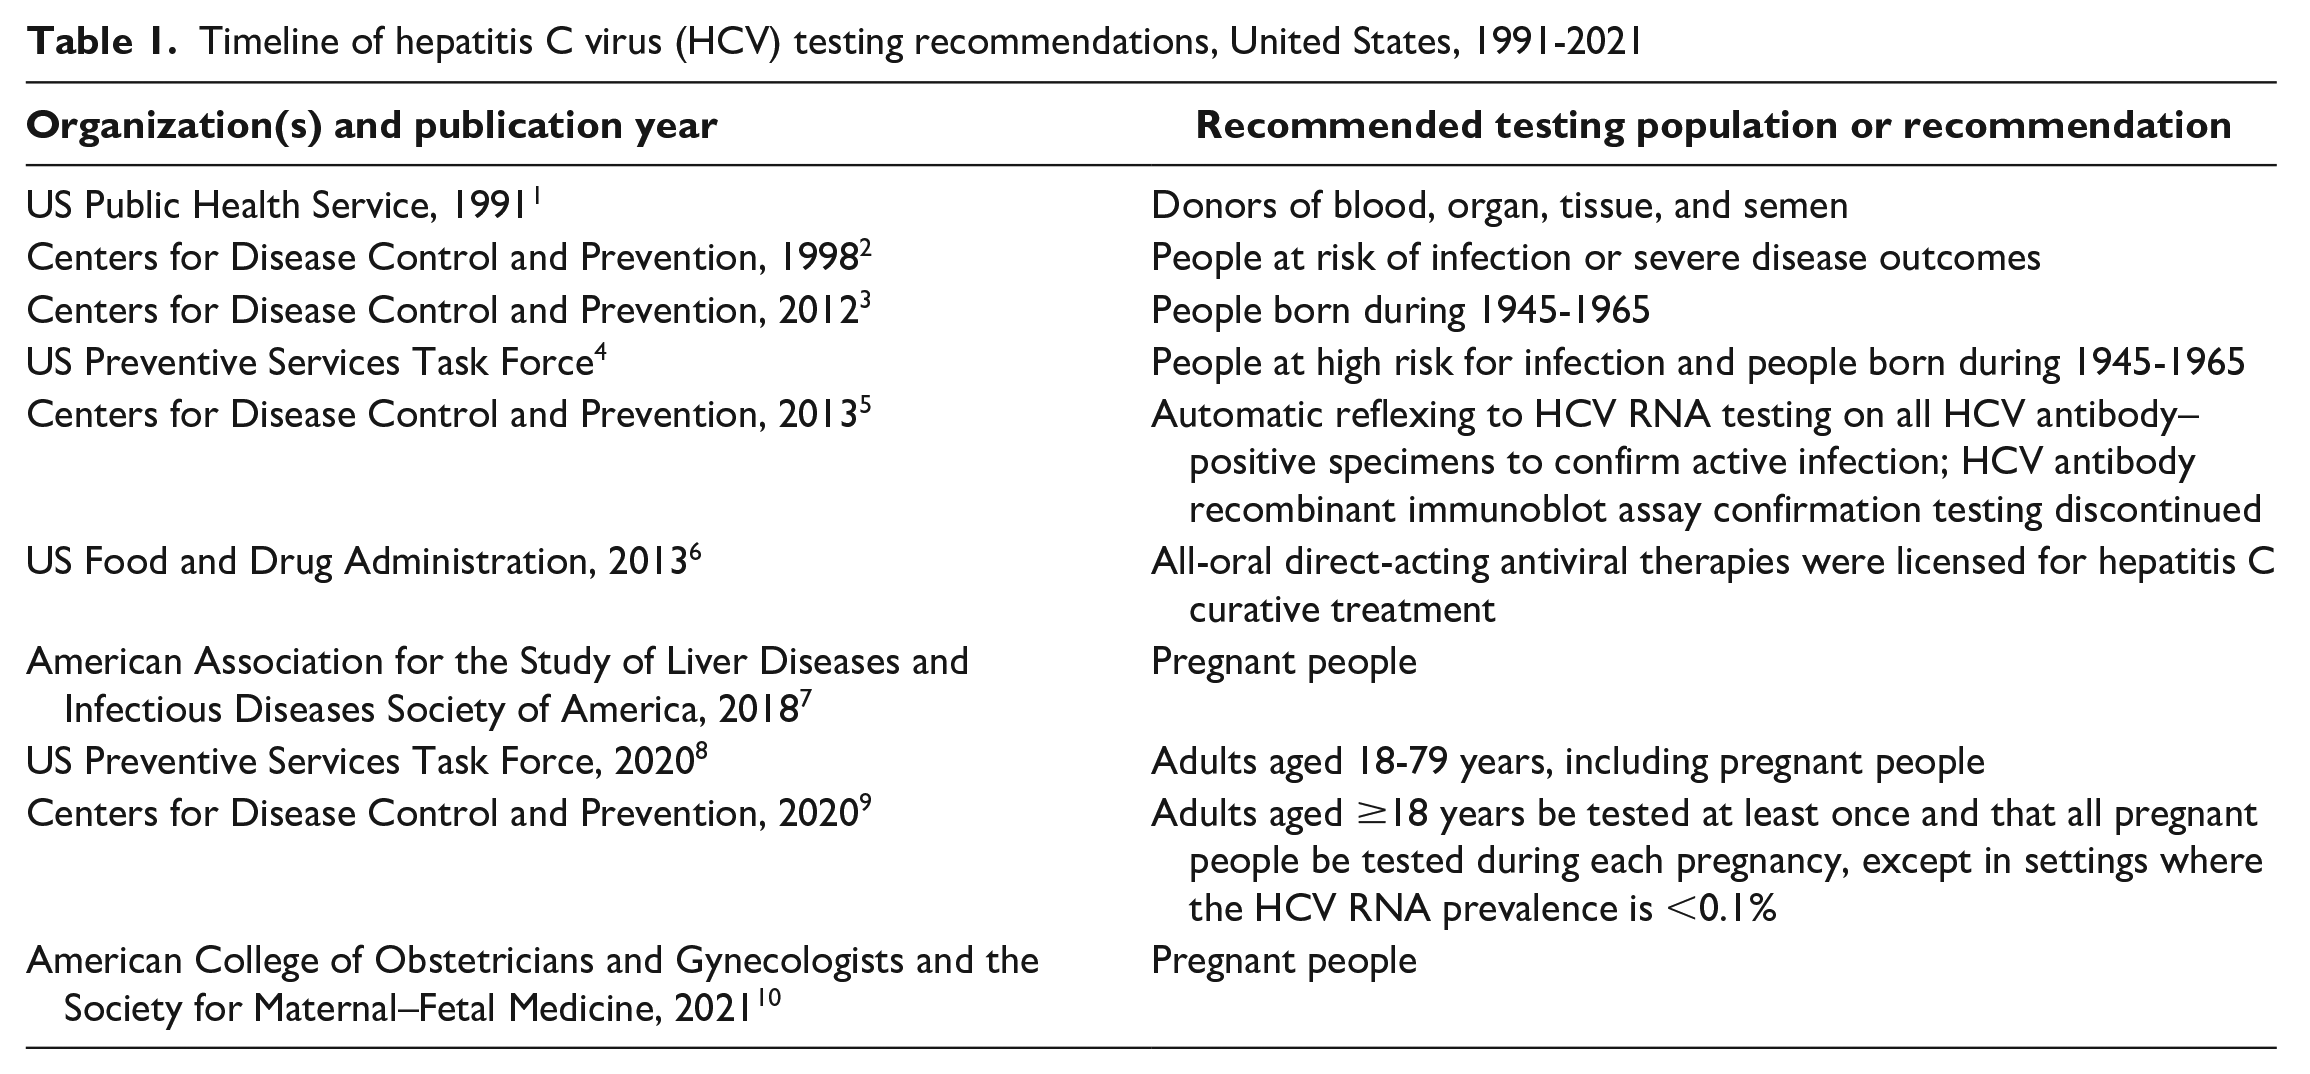
During the past 25 years, hepatitis C virus (HCV) infection testing recommendations have expanded incrementally in the United States (Table 1),1-10 from people with recognized exposures, behaviors, or conditions 2 to people born during 1945-19652,3 to all adults and pregnant people.8-10 Furthermore, the Centers for Disease Control and Prevention (CDC) updated testing guidance in 2013 to expedite referral to services and treatment by recommending HCV RNA reflex testing on all HCV antibody–positive specimens. 5 The Viral Hepatitis National Strategic Plan has laid a framework for viral hepatitis elimination in the United States and highlighted disproportionately affected groups. 11 These milestones demonstrate a growing commitment to reducing hepatitis C prevalence and long-standing health inequities needed to achieve elimination goals.6,9,11
Timeline of hepatitis C virus (HCV) testing recommendations, United States, 1991-2021
Understanding changes in hepatitis C epidemiology can inform public health interventions by revealing successes and areas in need of additional resources. For example, following an 87.5% decline in the incidence of acute hepatitis C during 1992-2010, incidence rose 4-fold during 2010-2019, primarily among people aged <40 years, coinciding with increases in injection drug use as a risk behavior and increases in opioid overdose deaths.12,13
To provide a full description of hepatitis C epidemiology, we used 2 temporally parallel datasets to characterize trends in HCV testing, infection, and surveillance cases and describe the impact of adopting automatic reflex HCV RNA testing. Quest Diagnostics is a large commercial clinical laboratory serving approximately one-half of US health care providers and hospitals, 14 and its database can provide insight into people who were both tested and tested positive for hepatitis C and the health care providers and settings where testing was ordered.15-17 In most states, mandates exist for positive HCV antibody and HCV RNA test results to be reported to health departments from clinical laboratories, including Quest Diagnostics.12,18,19 Laboratory test results, in combination with other clinical and patient information, are assessed by health departments to identify new hepatitis C cases (acute or chronic), which are then reported (ie, notified) to CDC’s National Notifiable Diseases Surveillance System (NNDSS) (Figure). 20
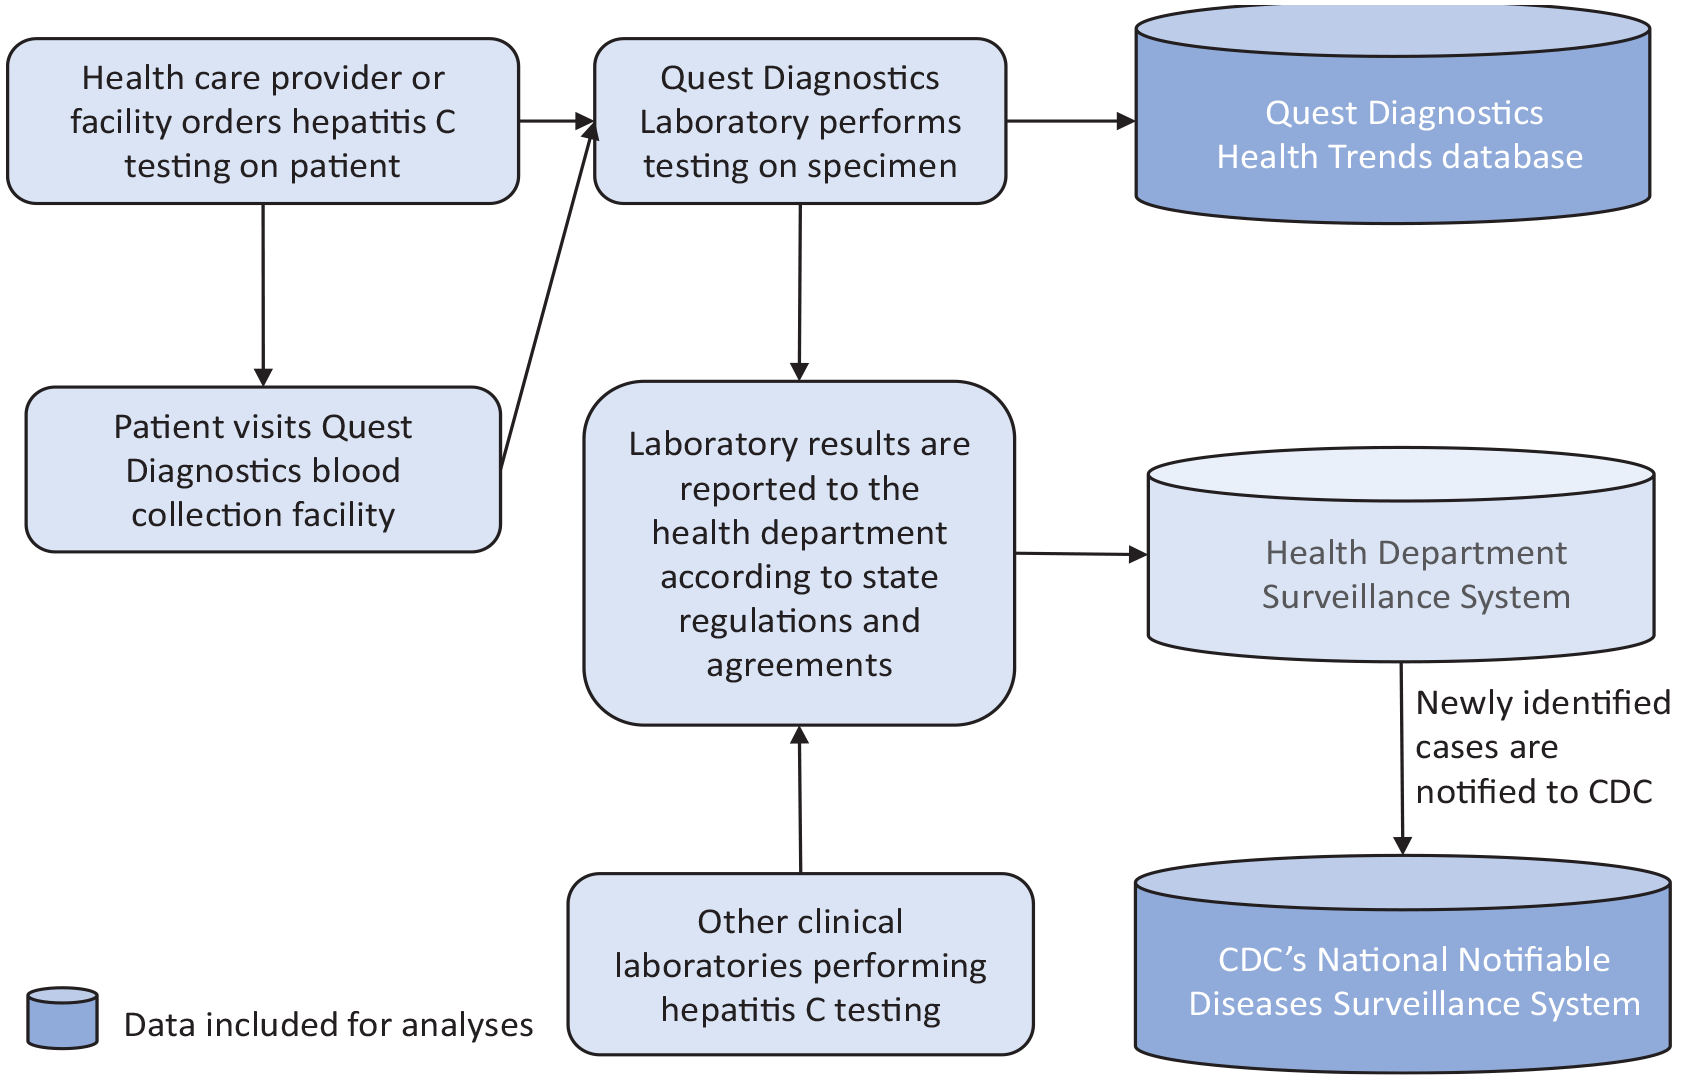
Simplified representation of the process from specimen collection to reporting to Quest Diagnostics Health Trends database and the Centers for Disease Control and Prevention’s (CDC’s) National Notifiable Diseases Surveillance System.
Methods
Data Sources and Definitions
We included people aged ≥18 years who had ≥1 HCV antibody test performed by Quest Diagnostics and whose earliest specimen collection date was from January 1, 2013, through December 31, 2021. We counted test results as once per person each calendar year; person-level deduplication did not occur across years. For a positive HCV antibody test during 2013-2015, a specimen collected for HCV RNA testing in the following year was considered associated with the positive HCV antibody test if collected within 180 days. If multiple HCV RNA tests were performed during the 180-day window, we included only the first result. We excluded people who had an HCV RNA test result but did not have a prior HCV antibody–positive result. In November 2015, Quest Diagnostics discontinued standalone HCV antibody testing, offering only HCV RNA reflex testing when the HCV antibody test result was positive.
Hepatitis C cases in NNDSS 20 met standard clinical and laboratory criteria in accordance with the surveillance case definitions for acute and chronic hepatitis C.21,22 We included in the analysis all confirmed acute and chronic hepatitis C cases, which require a positive HCV detection result, reported during 2013-2020 among adults aged ≥18 years.
Statistical Analyses
We used Quest Diagnostics data to determine the annual number of patients with ≥1 HCV antibody test, HCV antibody positivity, and HCV RNA positivity. We stratified data by patient age (18-39, 40-59, ≥60 y), sex (male, female), health insurance (commercial, Medicaid, Medicare), and ordering provider setting (office, hospital, substance use disorder [SUD] treatment facility, all other settings) and specialty (gastroenterology or hepatology, infectious disease, primary care [eg, internal medicine or family practice], obstetrics or gynecology, pediatrics, addiction medicine, all other specialties). We considered SUD treatment facilities and addiction medicine providers as high-impact settings and specialties, defined as those in which hepatitis C testing would be more likely than settings and specialties serving the general population to identify people who were HCV RNA positive. For this analysis, we included emergency departments, which may include inpatients and outpatients, in the hospital category. Using NNDSS data, we calculated the annual number of new hepatitis C cases (acute and chronic combined) and proportions by age and sex.
We applied joinpoint regression to calculate the slope of the overall trend and trend segments when the final model included 1 joinpoint. 23 We selected the final model using the permutation test method and by determining the optimal number and locations of joinpoints that adequately captured the underlying relationships in the data while avoiding overfitting. We calculated the significance of trends by using the t test. We used the Pearson χ2 test to assess significant differences in proportion positive for patient and ordering provider characteristics. We considered P < .05 to be significant. We performed statistical analyses using SAS version 9.4 (SAS Institute, Inc) and Joinpoint Regression Program version 4.9.0.0 (National Cancer Institute). The WCG Institutional Review Board deemed research activities using the Quest Diagnostics database as exempt from institutional review board review because data were deidentified. NNDSS data are deidentified without patient-identifying information; therefore, our study did not require approval by an institutional review board.
Results
HCV Antibody Testing and Positivity
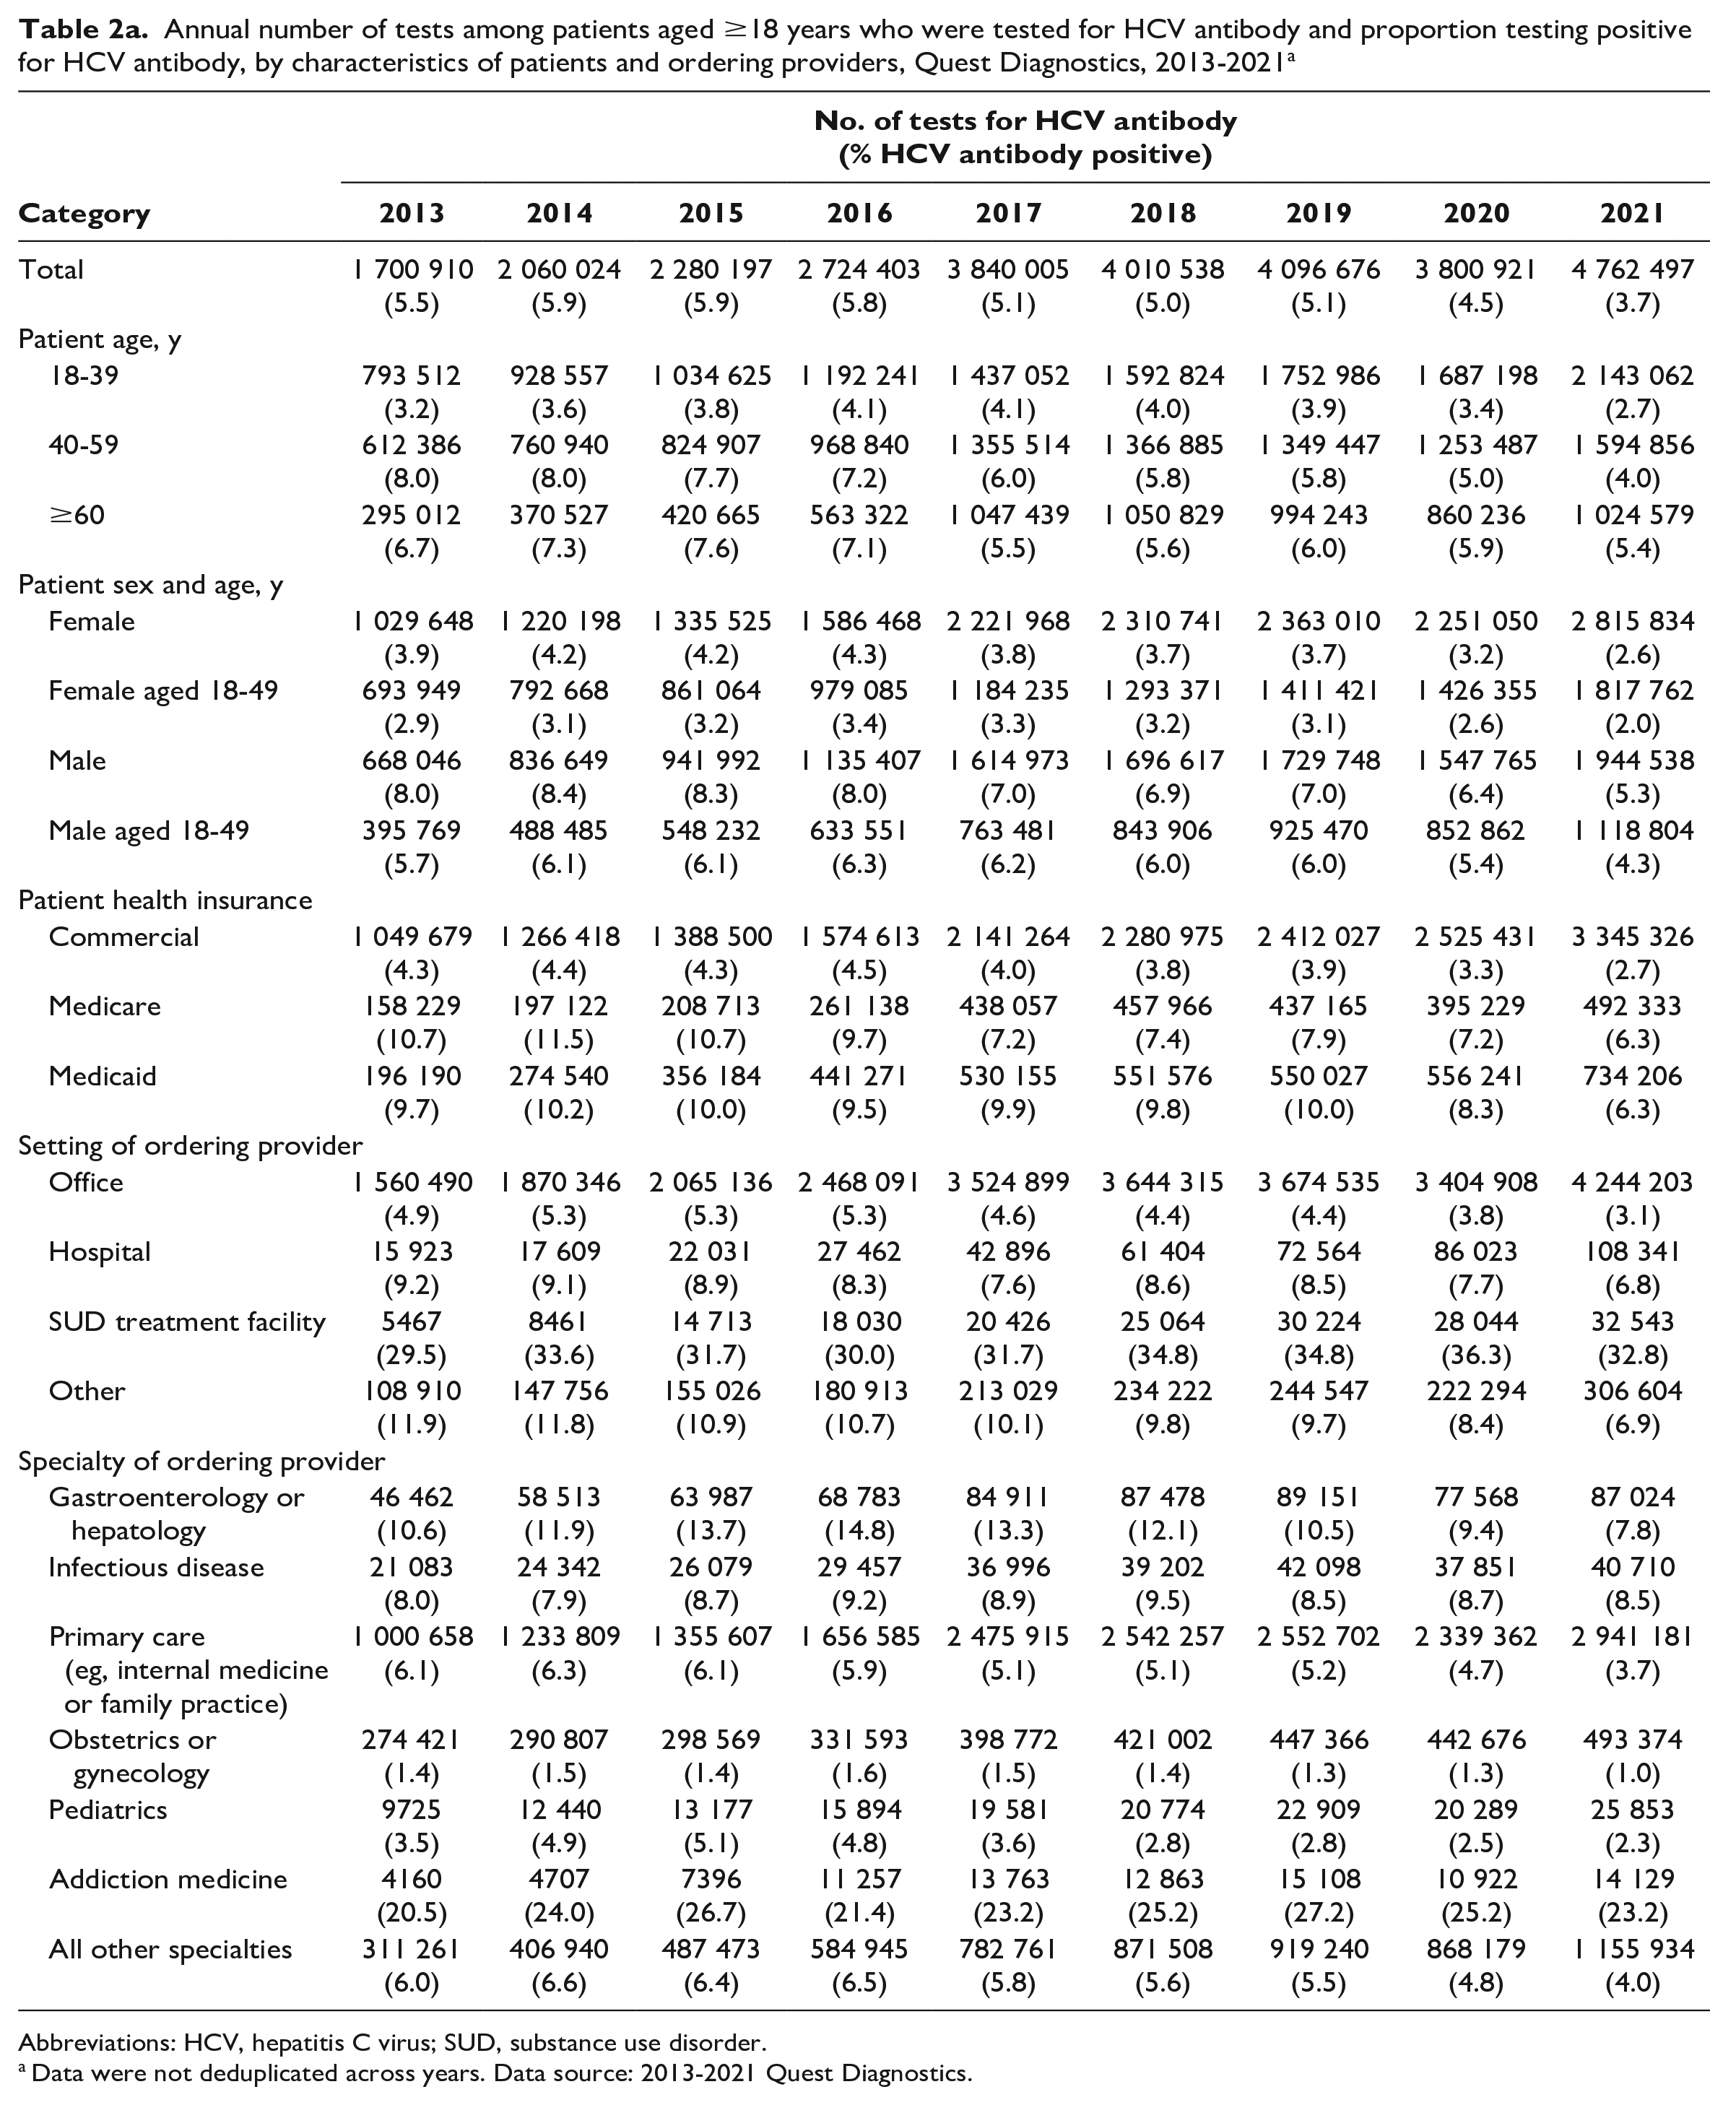
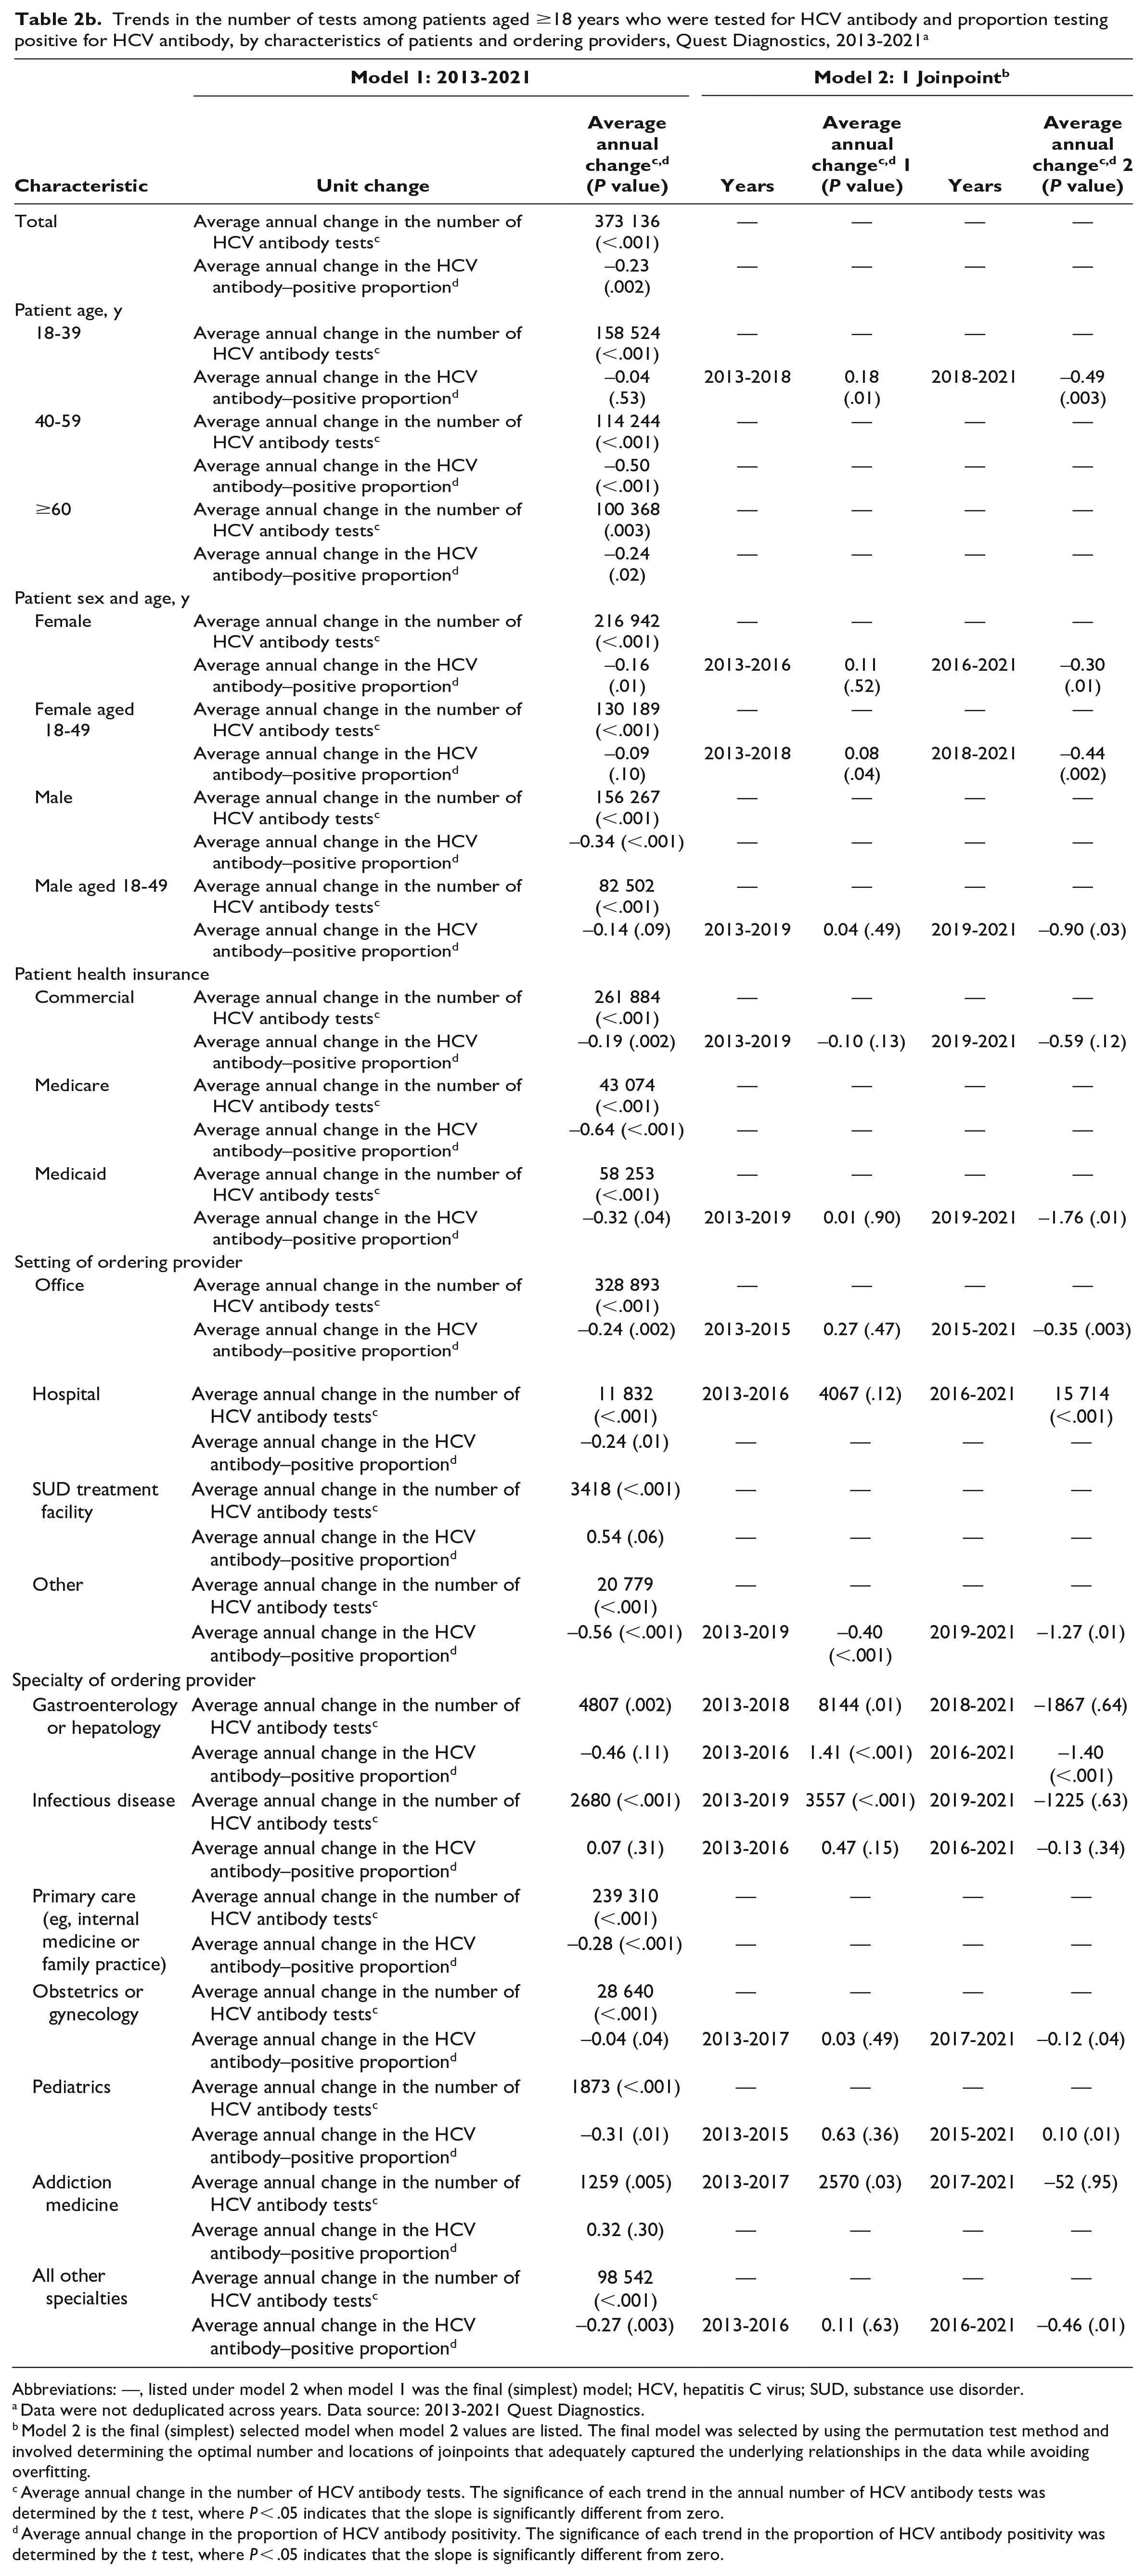
During 2013-2021, an average of 3.3 million specimens (range, 1.7-4.8 million) among adult patients were tested for HCV antibody through Quest Diagnostics annually, with an average increase of 373 136 specimens per year (P < .001) (Table 2a and b, Supplemental Figure 1). A 7.2% decline occurred during 2019-2020, rebounding by 25.3% during 2020-2021. The highest proportions tested were among female patients (58.5%) and people aged 18-39 years (42.9%). Testing was most frequently ordered in physicians’ offices (90.4%), by primary care providers (PCPs) and pediatricians (62.4% combined), and among commercially insured people (61.4%). People with Medicaid and Medicare accounted for 14.3% and 10.0% of testing, respectively. From 2013 to 2021, the greatest increase in HCV antibody testing occurred among patients tested in hospitals (from 15 923 to 108 341; 580%) and SUD treatment facilities (from 5467 to 32 543; 495%) and by addiction medicine providers (from 4160 to 14 129; 240%). The number of female patients aged 18-49 years and patients in obstetrician/gynecologist offices screened for HCV antibody increased by an average of 130 189 and 28 640 female patients per year, respectively (P < .001).
Annual number of tests among patients aged ≥18 years who were tested for HCV antibody and proportion testing positive for HCV antibody, by characteristics of patients and ordering providers, Quest Diagnostics, 2013-2021 a
Abbreviations: HCV, hepatitis C virus; SUD, substance use disorder.
Data were not deduplicated across years. Data source: 2013-2021 Quest Diagnostics.
Trends in the number of tests among patients aged ≥18 years who were tested for HCV antibody and proportion testing positive for HCV antibody, by characteristics of patients and ordering providers, Quest Diagnostics, 2013-2021 a
Abbreviations: —, listed under model 2 when model 1 was the final (simplest) model; HCV, hepatitis C virus; SUD, substance use disorder.
Data were not deduplicated across years. Data source: 2013-2021 Quest Diagnostics.
Model 2 is the final (simplest) selected model when model 2 values are listed. The final model was selected by using the permutation test method and involved determining the optimal number and locations of joinpoints that adequately captured the underlying relationships in the data while avoiding overfitting.
Average annual change in the number of HCV antibody tests. The significance of each trend in the annual number of HCV antibody tests was determined by the t test, where P < .05 indicates that the slope is significantly different from zero.
Average annual change in the proportion of HCV antibody positivity. The significance of each trend in the proportion of HCV antibody positivity was determined by the t test, where P < .05 indicates that the slope is significantly different from zero.
Among the 29.3 million specimens from adult patients that were tested for HCV antibody during 2013-2021, 5.0% (1.5 million) were HCV antibody positive. The proportion of HCV antibody positivity declined from 5.1% in 2019 to 3.7% in 2021, and we found significant declines among male patients who were aged 18-49 years (P = .03), those who were insured by Medicaid (P = .01), and those who were tested by ordering providers in office (P = .003) or “other” (P = .01) settings (Table 2a and b). The proportion of HCV antibody positivity was highest among patients insured by Medicaid and Medicare and lowest among commercially insured patients. In 2021, the proportion of HCV antibody positivity was highest among patients who were insured by Medicaid (6.3%) or Medicare (6.3%), aged ≥60 years (5.4%), male (5.3%), and aged 40-59 years (4.0%), as well as among patients who were tested in SUD treatment facilities (32.8%), in other settings (6.9%), in hospitals (6.8%), and by providers of addiction medicine (23.2%), infectious disease (8.5%), gastroenterology/hepatology (7.8%), and “other” (4.0%) (P < .001 for all comparisons with overall HCV antibody positivity) (Table 2a, Supplemental Figure 3).
HCV RNA Testing and Positivity
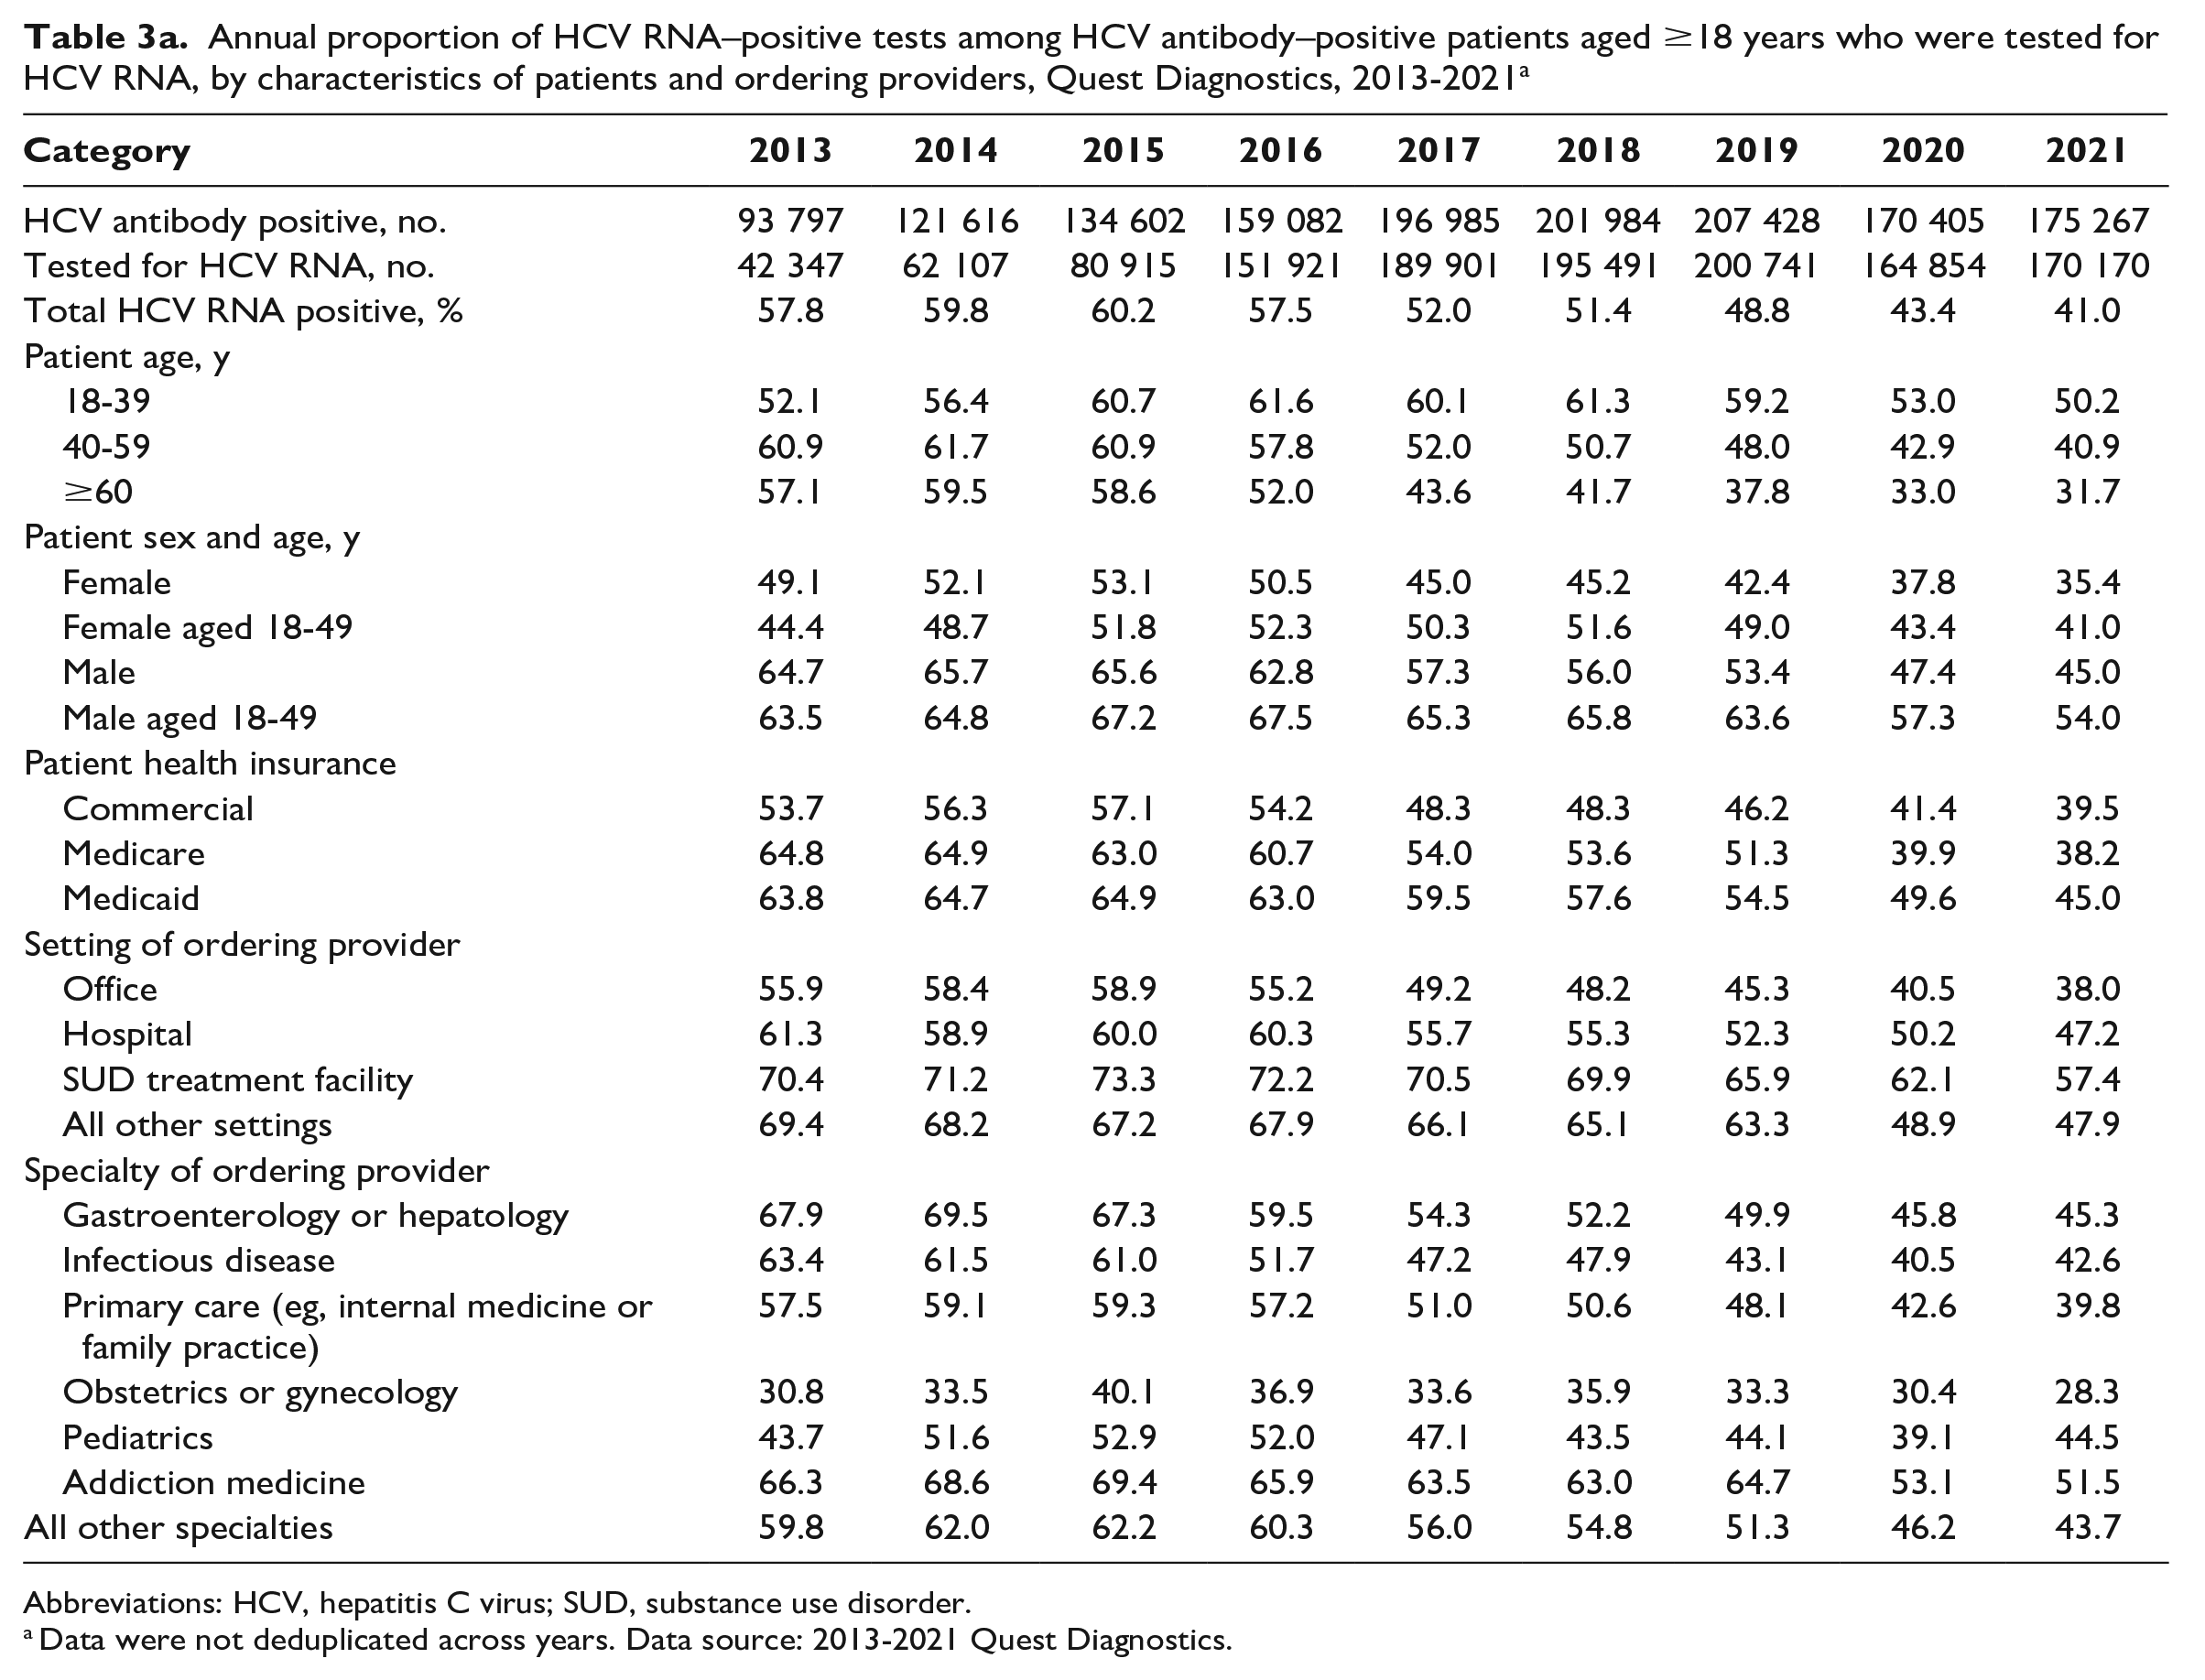
During 2013-2021, 86.1% (1.3 million) of HCV antibody–positive specimens among adult patients were tested for HCV RNA, of which 50.6% (n = 636 183; average, 70 687) were positive (Table 3a). HCV RNA testing increased significantly from 53.0% during 2013-2015 to 96.6% during 2016-2021 (P < .001) (eTable 1 in Supplement).
Annual proportion of HCV RNA–positive tests among HCV antibody–positive patients aged ≥18 years who were tested for HCV RNA, by characteristics of patients and ordering providers, Quest Diagnostics, 2013-2021 a
Abbreviations: HCV, hepatitis C virus; SUD, substance use disorder.
Data were not deduplicated across years. Data source: 2013-2021 Quest Diagnostics.
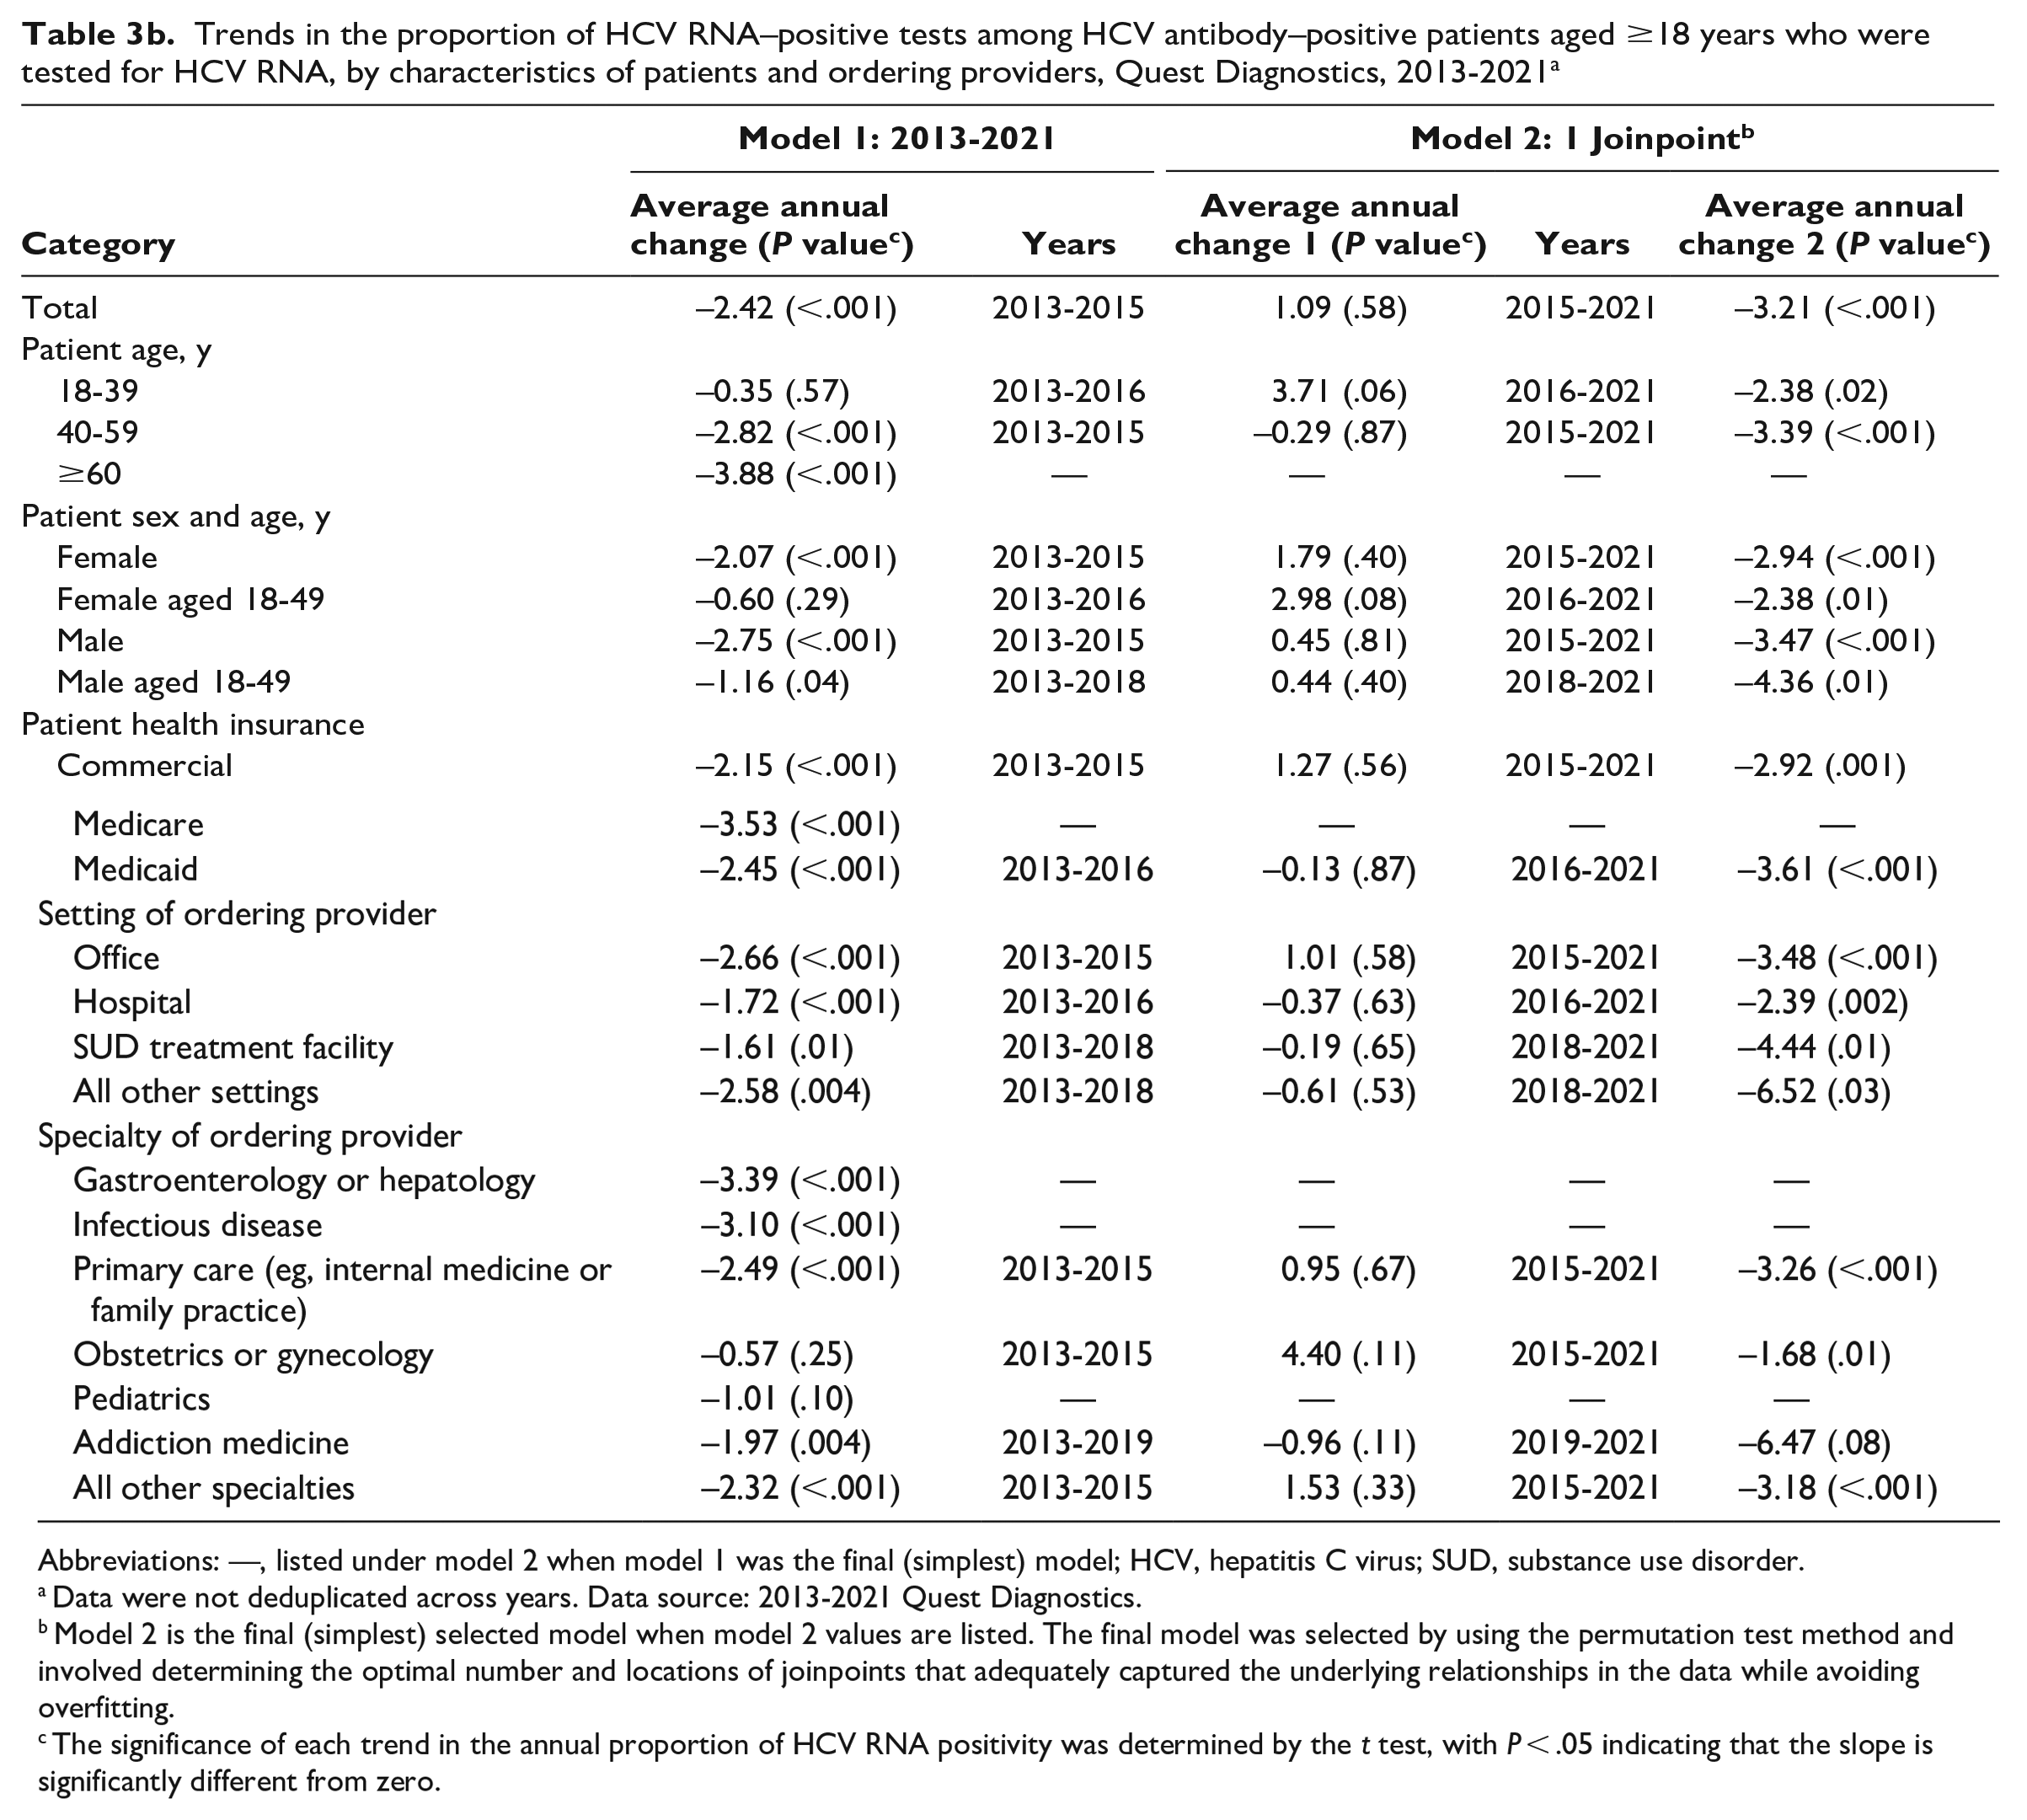
Trends in the proportion of HCV RNA–positive tests among HCV antibody–positive patients aged ≥18 years who were tested for HCV RNA, by characteristics of patients and ordering providers, Quest Diagnostics, 2013-2021 a
Abbreviations: —, listed under model 2 when model 1 was the final (simplest) model; HCV, hepatitis C virus; SUD, substance use disorder.
Data were not deduplicated across years. Data source: 2013-2021 Quest Diagnostics.
Model 2 is the final (simplest) selected model when model 2 values are listed. The final model was selected by using the permutation test method and involved determining the optimal number and locations of joinpoints that adequately captured the underlying relationships in the data while avoiding overfitting.
The significance of each trend in the annual proportion of HCV RNA positivity was determined by the t test, with P < .05 indicating that the slope is significantly different from zero.
The overall proportion of HCV RNA positivity among HCV antibody–positive specimens tested for HCV RNA was approximately 60% during 2013-2015 and declined by 3.2% per year during 2015-2021; it was 41.0% in 2021 (P = .58 for 2013-2015; P < .001 for 2015-2021) (Table 3a and b, eFigure 2 in Supplement). Age-specific HCV RNA positivity was highest among people aged 40-59 years during 2013-2015 and shifted to people aged 18-39 years during 2016-2021. Significant declining trends occurred among several patient and ordering provider groups after 2015 (Table 3b). In 2021, the proportion of HCV RNA positivity was significantly higher than the overall proportion among patients who were male, aged 18-49 years, insured by Medicaid, and tested in SUD treatment facilities and hospitals or by addiction medicine providers and gastroenterologists, including hepatologists (P < .001) (Figure 4b in Supplement).
NNDSS-Reported Hepatitis C Cases
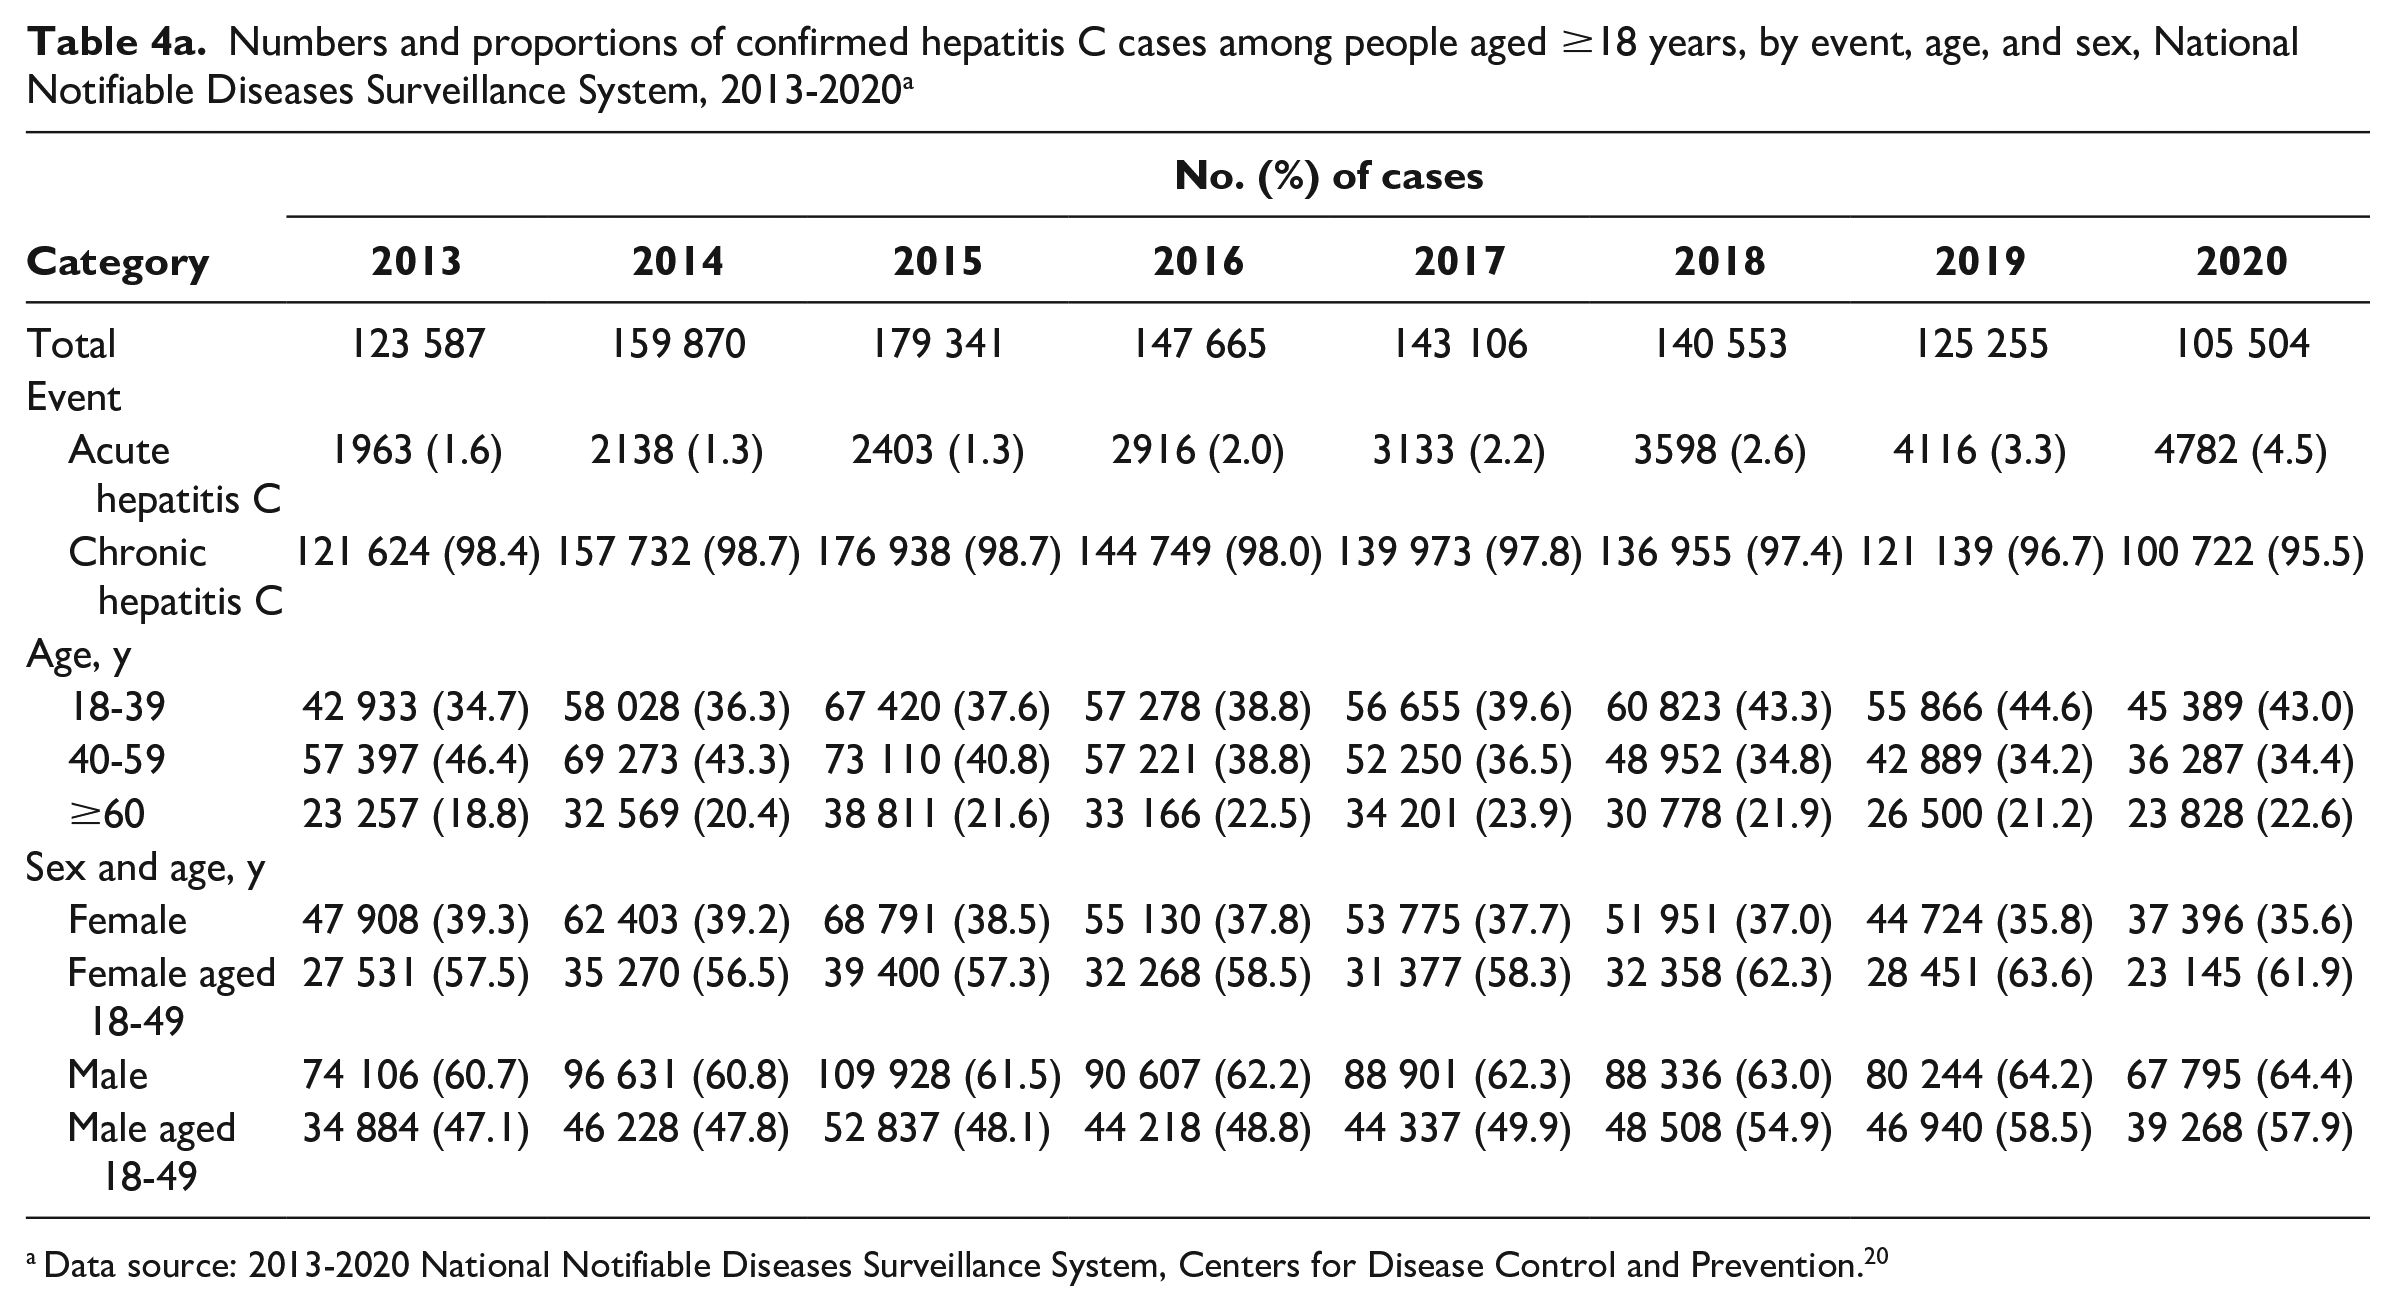
During 2013-2020, 1.1 million (average, 140 610) adult cases of confirmed hepatitis C were newly reported to NNDSS; 97.8% were classified as chronic hepatitis C (Table 4a). The number of cases reported peaked at 179 341 in 2015 and then declined on average by 13 177 cases per year to 105 504 in 2020 (P = .01 for 2015-2020) (Table 4b). During 2013-2020, most cases were among people who were aged 18-59 years (78.4%) and male (62.3%). The average annual increase in the proportion of cases among people aged 18-39 years was 1.4% (P < .001), while the proportion of cases among people aged 40-59 years declined significantly by 2.3% annually during 2013-2018 (P < .001) and remained stable during 2018-2020 (P = .99). The proportion of cases among men aged 18-49 years increased from 47.1% in 2013 to 57.9% in 2020 (average, 1.8% per year; P = .001) and among women aged 18-49 years increased by 1.0% per year and was 61.9% in 2020 (P = .004).
Numbers and proportions of confirmed hepatitis C cases among people aged ≥18 years, by event, age, and sex, National Notifiable Diseases Surveillance System, 2013-2020 a
Data source: 2013-2020 National Notifiable Diseases Surveillance System, Centers for Disease Control and Prevention. 20
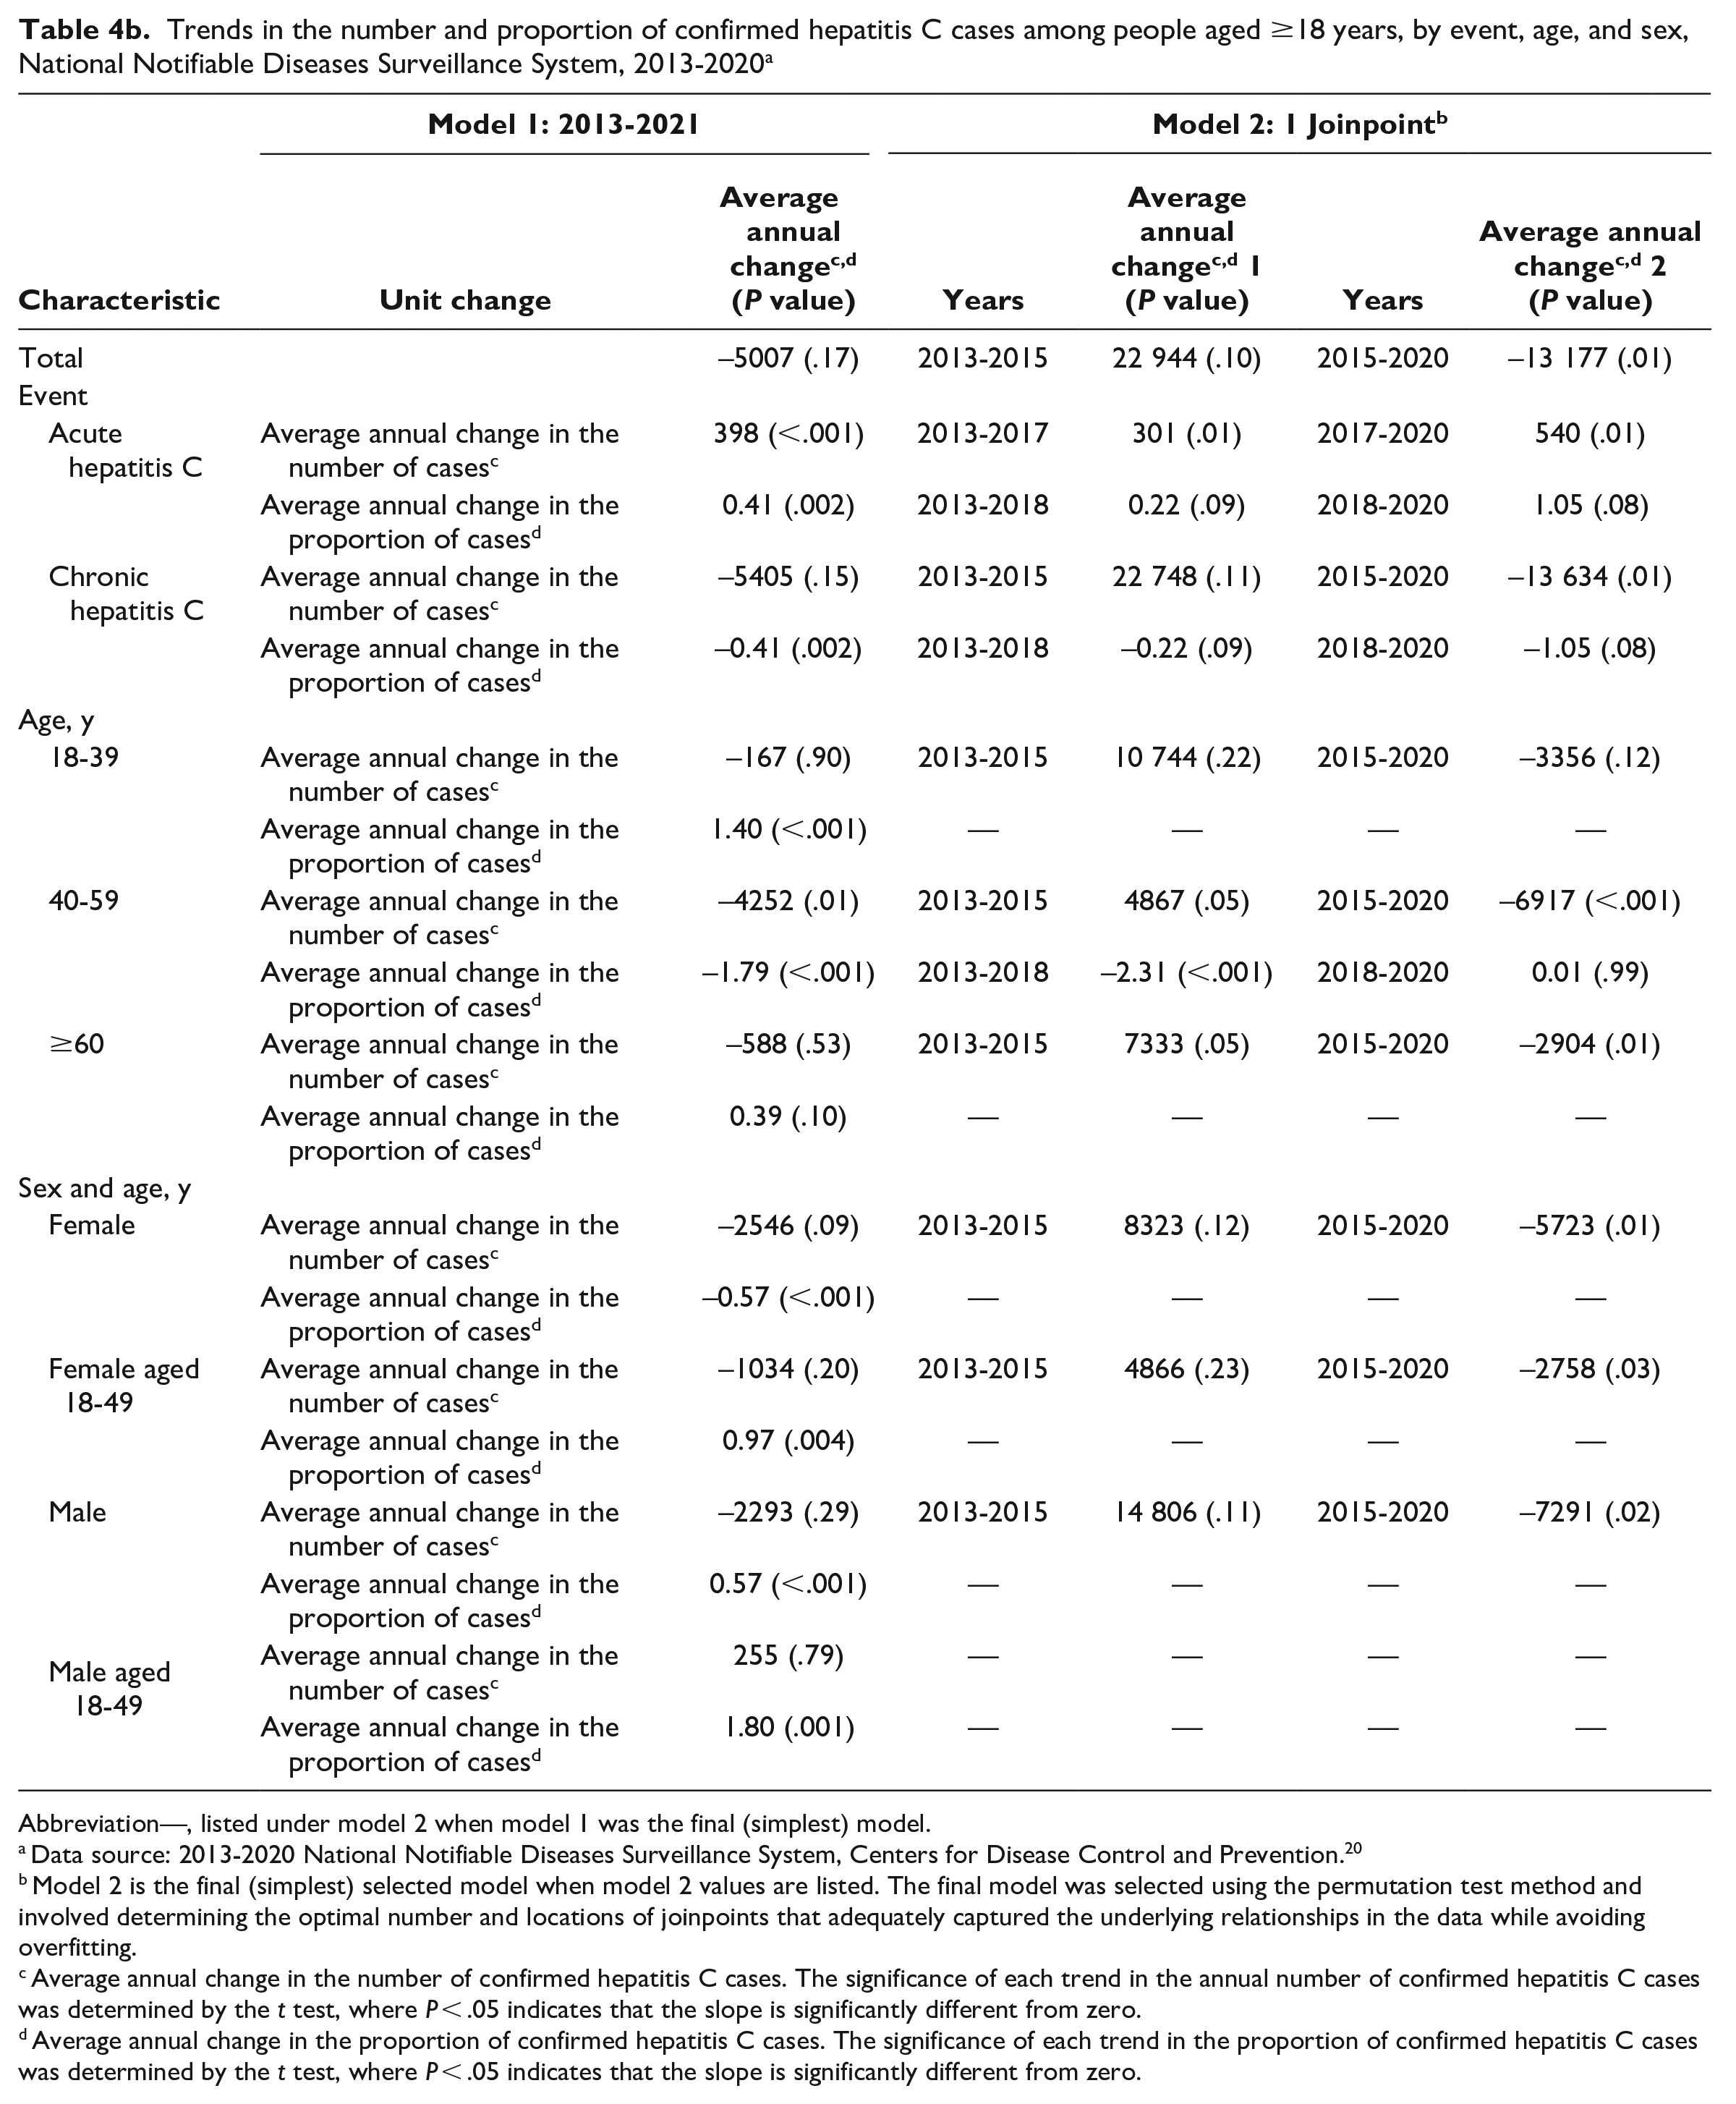
Trends in the number and proportion of confirmed hepatitis C cases among people aged ≥18 years, by event, age, and sex, National Notifiable Diseases Surveillance System, 2013-2020 a
Abbreviation—, listed under model 2 when model 1 was the final (simplest) model.
Data source: 2013-2020 National Notifiable Diseases Surveillance System, Centers for Disease Control and Prevention. 20
Model 2 is the final (simplest) selected model when model 2 values are listed. The final model was selected using the permutation test method and involved determining the optimal number and locations of joinpoints that adequately captured the underlying relationships in the data while avoiding overfitting.
Average annual change in the number of confirmed hepatitis C cases. The significance of each trend in the annual number of confirmed hepatitis C cases was determined by the t test, where P < .05 indicates that the slope is significantly different from zero.
Average annual change in the proportion of confirmed hepatitis C cases. The significance of each trend in the proportion of confirmed hepatitis C cases was determined by the t test, where P < .05 indicates that the slope is significantly different from zero.
Discussion
This analysis used 2 temporally parallel data sources to evaluate trends among (1) adults tested for hepatitis C from a large commercial clinical laboratory during 2013-2021 and (2) newly reported hepatitis C cases in adults from national surveillance in CDC’s NNDSS during 2013-2020. From Quest Diagnostics, of 1.3 million HCV antibody–positive specimens tested for HCV RNA, 50.6% (n = 636 183) were HCV RNA positive. From NNDSS, 1.1 million cases of HCV RNA–confirmed hepatitis C cases were reported.
Clinical laboratory testing data can help describe the effect of screening recommendations and changes in screening practices. While most health departments receive positive HCV antibody and RNA test results, only a subset are receiving all HCV RNA test results, regardless of the result. 24 This information can be used to identify where additional resources may be needed. Health department staff with access to comprehensive laboratory testing data can use this information to identify disparities in testing and case-reporting practices, inform linkage-to-care and treatment efforts, create and maintain a longitudinal hepatitis C registry, and develop HCV care cascades. 25 With sufficient resources, health departments may obtain additional information that is unavailable on laboratory reports. For example, implementation of electronic case reporting can expedite case investigations and improve the completeness of patient data. 26 To better characterize patients, trends, and progress toward elimination goals, health departments have enhanced surveillance data by integrating multiple data sources, including laboratory, prevention and care systems, and syndemic surveillance programs. 24
HCV antibody testing from Quest Diagnostics increased overall during 2013-2021, especially from 2020 to 2021. The proportion of HCV antibody positivity declined overall and in many categories. The increase in HCV antibody testing and decrease in HCV antibody positivity suggests early evidence of the adoption of universal adult screening recommendations. The greatest percentage increase in HCV antibody testing occurred in hospitals, in SUD treatment facilities, and by addiction medicine providers, indicating improvements in testing among people at risk of HCV exposure in high-impact settings. Universal testing in high-impact settings ensures that people who have an increased likelihood of living with hepatitis C and who may not have established access to health care are provided testing services.9,27 Widespread adoption of new recommendations into clinical practice takes time, and universal hepatitis C screening recommendations may have been further delayed when health care systems were strained by the COVID-19 pandemic. A separate analysis of Quest Diagnostics data showed a 59% reduction in HCV antibody testing during April 2020 than in prior years. 17 Continued monitoring of hepatitis C laboratory test data will be necessary to ensure that people living with hepatitis C are diagnosed and appropriately linked to care and to fully characterize the implementation of the new recommendations.
Increased rates of HCV detection have been reported among people of childbearing potential and an increased number of perinatally exposed infants, raising the concern of increased perinatal transmissions.16,28 The number of female patients aged 18-49 years and patients seen by obstetricians/gynecologists who were screened for HCV antibody increased annually, which may reflect adoption of HCV screening prior to the official recommendations during 2018-2021.7-10 A recent study found that the percentage of pregnant patients with an HCV antibody screening test increased before, and was also higher after, recommendations were revised in 2020. 15 In addition, the highest proportions of HCV antibody testing occurred among female patients (58.5%) and among patients aged 18-39 years (42.9%), which may be explained by increased opportunities to screen for HCV in combination with other preventive care provided during primary care and prenatal visits.29,30 The high proportion of HCV antibody testing as well as HCV RNA positivity among patients aged 18-39 years is likely attributed to the higher occurrence of hepatitis C–related risk behaviors among younger compared with older age groups. 31 Similarly, during 2013-2020, the number of hepatitis C cases reported to NNDSS among patients aged 18-39 years increased significantly. These increases occurred concurrently with the opioid crisis. 32
Because a sizeable percentage (44.4%) of people are unaware of their HCV infection status, 33 strategies that optimize testing and linkage to cure include reducing disease stigma 34 ; using electronic health record reminders to identify people who are eligible for testing and treatment35-37; integrating testing, prevention, and treatment approaches, especially those that are community-based and syndemic focused38-40; and using telemedicine programs. 41 Other factors that might influence implementation of expanded hepatitis C testing include state viral hepatitis elimination planning initiatives 42 ; health insurance access, including state Medicaid expansion and removal of treatment restrictions42,43; and HCV RNA testing availability.25,44 Legal challenges exist in requirements for health insurers to pay for preventive services that might negatively affect HCV testing trends. In addition, PCPs are more likely to perform services that are specified as clinical quality measures than to perform services that are not specified as clinical quality measures, which is a mechanism for evaluating patient quality of care. 45 Recently, the Centers for Medicare & Medicaid Services updated its clinical quality measures to align with current guidelines,7-10,45 which might increase adoption of the recommended practice of screening and linkage to cure by more PCPs, who were the main providers of hepatitis C screening in our analysis.
In the absence of automatic HCV RNA reflex testing policies, studies suggest that approximately one-third of HCV antibody–positive people were not tested for HCV RNA.44,46 Following Quest Diagnostics’ discontinuation of stand-alone HCV antibody testing and offering only HCV RNA reflex testing in November 2015, the fraction of HCV antibody–positive patients tested for HCV RNA increased from 53.0% to nearly 100%. An HCV RNA–positive laboratory test result is required to confirm current infection and identify people eligible for treatment.5,7 An HCV RNA–positive test result is also required for application of the confirmed acute, chronic, and perinatal hepatitis C surveillance case definitions used with NNDSS.21,22,47 Therefore, efforts to make available and increase HCV RNA testing, as shown by offering only reflex testing, are necessary to enhance diagnosis, clinical care, surveillance, and elimination efforts.
The high rate of HCV RNA positivity during 2013-2015 (approximately 60%) likely reflects testing among people born during 1945-1965 and groups at increased risk of HCV exposure in accordance with CDC recommendations.2,3 Subsequent declines in HCV RNA positivity are likely due to various factors, including access to direct-acting antiviral therapies among people diagnosed with hepatitis C and expansion of HCV screening recommendations to include a larger proportion of the United States.6,8-10,48 Moving toward universal screening of people without reported risks (ie, in settings serving the general population) can increase the occurrence of false-positive HCV antibody results and lower the proportion of HCV RNA positivity.49,50 Consistent with results from a National Health and Nutrition Examination Survey analysis of the general US population, 50 we found HCV RNA positivity to be lowest among health care providers serving the general population, including obstetricians/gynecologists and PCPs.
Limitations
This study had several limitations. First, Quest Diagnostics is not the sole source of hepatitis C testing; therefore, these data do not represent all hepatitis C testing in the United States. 14 Second, comparisons of HCV antibody testing across patient and ordering provider categories should be interpreted with caution because Quest Diagnostics’ market share may vary by demographic factors. Third, this analysis followed the CDC testing sequence guidelines of screening for HCV antibody first followed by HCV RNA testing on HCV antibody–positive specimens.5,9 As such, we did not include people who had HCV RNA testing conducted but did not have an HCV antibody–positive test result (eg, HCV antibody drawn elsewhere, from settings where only HCV RNA testing is performed, or following treatment completion). Fourth, while Quest Diagnostics data were not deduplicated across years, we observed the highest testing percentage increase in high-impact settings, which may indicate repeat testing among people at increased risk of HCV infection. 9 Fifth, the representativeness of NNDSS is limited by various reporting policies and jurisdictional capacity to conduct routine surveillance.12,19 In 2020, a total of 44 and 41 states submitted data on cases of acute and chronic hepatitis C, respectively, to NNDSS. Sixth, data on race and ethnicity were not included because this information was unavailable for a large proportion of patients. Efforts to routinely include data on race and ethnicity are a public health imperative.51,52 Seventh, most jurisdictions received federal funding for the first time in 2021 to conduct hepatitis C surveillance and are working toward establishing a longitudinal surveillance database of people living with hepatitis C. 53 As such, it is likely that not all chronic hepatitis C cases reported to NNDSS during 2013-2020 were deduplicated and reflect unique individuals. Finally, because of health care and public health challenges during the COVID-19 pandemic, results from 2020 and 2021 should be interpreted with caution.
Conclusion
This analysis provides parallel views of commercial laboratory (29.3 million HCV antibody and 1.3 million HCV RNA test results) and hepatitis C surveillance (1.1 million cases) data. Access to various data sources is helpful to generate public health insights to allow for monitoring people with hepatitis C along the care cascade and monitoring progress toward hepatitis C elimination goals.11,25
HCV RNA positivity and cases reported through surveillance have shifted to younger adults since 2013. Increasing HCV antibody and HCV RNA testing with decreasing HCV antibody positivity suggest improved implementation of universal screening. Public health strategies such as using data modernization strategies, 54 integrating hepatitis C testing and treatment, bundling costs, and motivating laboratories to adopt policies to perform HCV RNA reflex testing can facilitate the diagnosis, treatment, and surveillance of people living with hepatitis C. Efforts to widely implement hepatitis C screening recommendations coupled with access to treatment and harm reduction can reach the remaining groups disproportionately affected by hepatitis C.
Supplemental Material
sj-docx-1-phr-10.1177_00333549231224199 – Supplemental material for Hepatitis C Virus Testing, Infection, and Cases Reported Through Public Health Surveillance During Expanded Screening Recommendations, United States, 2013-2021
Supplemental material, sj-docx-1-phr-10.1177_00333549231224199 for Hepatitis C Virus Testing, Infection, and Cases Reported Through Public Health Surveillance During Expanded Screening Recommendations, United States, 2013-2021 by Kathleen N. Ly, Justin K. Niles, Ruth B. Jiles, Harvey W. Kaufman, Mark K. Weng, Priti Patel, William A. Meyer, William W. Thompson and Nicola D. Thompson in Public Health Reports
Footnotes
Disclaimer
The findings and conclusions in this article are those of the authors and do not necessarily represent the official position of the Centers for Disease Control and Prevention.
Declaration of Conflicting Interests
The authors declared the following potential conflicts of interest with respect to the research, authorship, and/or publication of this article: Harvey W. Kaufman and Justin K. Niles are employees of, and William A. Meyer III serves as a consultant to, Quest Diagnostics. Harvey W. Kaufman and William A. Meyer III own stock in Quest Diagnostics.
Funding
The authors received no financial support for the research, authorship, and/or publication of this article.
Supplemental Material
Supplemental material for this article is available online. The authors have provided these supplemental materials to give readers additional information about their work. These materials have not been edited or formatted by Public Health Reports’s scientific editors and, thus, may not conform to the guidelines of the AMA Manual of Style, 11th Edition.
References
Supplementary Material
Please find the following supplemental material available below.
For Open Access articles published under a Creative Commons License, all supplemental material carries the same license as the article it is associated with.
For non-Open Access articles published, all supplemental material carries a non-exclusive license, and permission requests for re-use of supplemental material or any part of supplemental material shall be sent directly to the copyright owner as specified in the copyright notice associated with the article.