
Abstract
A key component of decreasing severe disease, hospitalizations, and death due to COVID-19 has been increasing vaccine accessibility to residents in communities where access to health care is poor and residents are at increased risk of poor health outcomes. Driven by the expansive geography and diverse population it serves, the Los Angeles County Department of Public Health built an extensive school vaccination network by partnering with the county’s roughly 3000 schools and vaccine providers. We report on the process of building this network and its impact on vaccination coverage. We describe a unique equity metric (HPI+) that used a combination of the Healthy Places Index (HPI) and COVID-19 transmission and vaccination data to prioritize school-located vaccination efforts. More than 328 991 doses of COVID-19 vaccine were administered at 1050 schools in Los Angeles County from April 15, 2021, through June 18, 2022. Nearly 10% of all doses administered to children aged 5-11 years in Los Angeles County were at school-located vaccine clinics. Most vaccine clinic days (77.3%) were held at schools in HPI+ zip codes. Most doses (68.3%) were administered in HPI+ regions and to people aged ≥12 years (70.3%). Vaccinating the community at schools is an effective public health intervention; however, increased outreach efforts were required in HPI+ regions to ensure equitable access to vaccines. This case study can be used to replicate public health interventions using schools to support access to health care services for students and the surrounding community.
In January 2020, the US Department of Health and Human Services declared a nationwide public health emergency in response to the SARS-CoV-2 virus. 1 The first COVID-19 vaccine became available in December 2020. Like most of the country, Los Angeles County, California, faced the challenge of quickly distributing COVID-19 vaccines to residents while ensuring equitable coverage. Los Angeles County is one of the largest counties in the nation, encompassing 4084 square miles, and one of the most populous, with nearly 10 million residents accounting for approximately 27% of California’s population. 2 According to the US Census Bureau, 48.3% of Los Angeles County residents are Hispanic/Latino, 25.9% are non-Hispanic White, 21.8% are Hispanic White, 21.1% are Hispanic other, 14.8% are Asian, 8.1% are non-Hispanic Black/African American, 7.3% are multiracial, 0.8% are American Indian/Alaska Native, and 0.2% are Native Hawaiian.3,4
Initially, COVID-19 vaccines were not available through typical health care channels due to a limited supply, a tiered rollout plan, novel cold-chain requirements, and administrative challenges related to managing a new vaccine. Mass vaccination sites were opened in strategic geographic locations, but barriers in vaccination access resulted in disproportionate COVID-19 vaccination coverage, with low levels of uptake in economically disadvantaged communities 5 that lacked the transportation or time off work to attend mass vaccination sites. These mass vaccination sites also required navigating complicated appointment systems. To address these barriers and reduce inequity of vaccine access, the Los Angeles County Department of Public Health (LACDPH) identified schools as 1 set of vaccine access points because they are trusted entities centrally located in communities.
School-located vaccination was first reported in the mid-1800s and has been a successful strategy for immunizing large numbers of children against influenza annually and during outbreaks of infectious disease.6,7 The school location allows rapid vaccination of many while minimizing disruption for students and their families. School-located vaccine clinics result in reduced absenteeism and missed work.7-10 According to Szilagyi et al, 11 parent reminders and education combined with school-located vaccine clinics raise vaccination rates, whereas reminders and education alone have little impact.
Purpose
We describe the process of creating an extensive network of local, convenient, and trusted COVID-19 vaccination sites using the roughly 3000 TK-12 schools (ie, transitional kindergarten through grade 12) in Los Angeles County. We report on the school-located vaccine clinic models and their impact on vaccination coverage.
Methods
Program Description
During the COVID-19 pandemic, LACDPH partnered with the Los Angeles County Office of Education, TK-12 school districts, charter associations, and private schools to determine how to quickly and equitably vaccinate staff, students, and their families. In July 2021, LACDPH and Los Angeles County Office of Education jointly requested that schools in Los Angeles County host a vaccine clinic for their students, families, and nearby community. Beginning in spring 2021, LACDPH provided guidance, tools, and templates for logistics and promotion. LACDPH encouraged eligible school districts to enroll in the California Vaccine Management System (myCAvax) to become a COVID-19 vaccine provider. LACDPH identified vaccine providers to administer vaccines at schools that were unable or unwilling to become a COVID-19 vaccine provider. Schools were partnered with COVID-19 vaccine providers based on several criteria: proximity to school, staffing capacity, vaccine clinic model (eg, mobile vehicle, walk-up, or drive-through), and ability to provide other health care services.
Based on experience from the initial school-located vaccine clinics, LACDPH developed the COVID-19 Vaccine Clinic Toolkit for TK-12 Schools in July 2021. 12 The toolkit served as a guide for school administrators coordinating school-located COVID-19 vaccine clinics. Key components of the toolkit were a step-by-step checklist, strategies for outreach and promotion, considerations for planning clinics with young children, sample templates for consent forms and event flyers, and COVID-19 vaccine information.
The 2 models for school-located vaccine clinics were (1) administering vaccine in an existing school-based health center (SBHC) or (2) hosting a mobile pop-up clinic (mobile). SBHCs are permanent health care centers located on a school campus and operated by the district health services department or a local health care provider. With this model, vaccine was administered by the health care entity operating the SBHC and was generally accessible during regular clinic hours and operations. With the mobile model, vaccine clinics were temporarily located on a school campus for ≥1 day and were set up in gymnasiums, auditoriums, parking lots, or other communal spaces. Mobile clinics had more flexibility than SBHCs and were scheduled during school hours, in the evenings, or on weekends depending on the needs of the community. Clinic days hosted by an SBHC were categorized as mobile if some or all the vaccine operations took place outside the walls of the SBHC to accommodate high demand. Both models required consent for minors, and the school and vaccine provider determined the process for obtaining consent. A parent or legal guardian was required to accompany one’s child to provide consent, or schools collected written consent forms prior to the clinic and excused students who obtained consent from class to receive their vaccine. The LACDPH Institutional Review Board reviewed the study and determined that it met the criteria for not human subjects research per 45 CFR 46.102(e)(1).
Schools used resources in the toolkit 12 to promote the vaccine clinics. Commonly used promotion strategies included sharing the clinic flyer through parent messaging platforms, posting the flyer to the school website, adding the clinic to the school events calendar, advertising on the school marquee, passing out physical flyers at school dismissal, and making robocalls. Additionally, LACDPH used community health workers and community-based organizations to distribute clinic flyers; provide outreach about COVID-19 vaccines; support clinic operations; and provide child-centered activities, incentives (eg, gift cards, books), and additional health and community resources at the clinic.
LACDPH developed an equity metric (HPI+) by using the Healthy Places Index (HPI) 13 and county COVID-19 data (+) to prioritize allocation of (1) vaccines while vaccine supply was limited and (2) personnel resources for vaccine events. The HPI maps data on social conditions that drive health, such as education, job opportunities, and clean air and water, and produces a score. The scores are derived from 23 social determinants of health and reflect cumulative community conditions. Scores range from 1 to 99, with lower scores indicating less healthy communities and higher scores indicating healthier communities. The scores were divided into even quartiles that show the relative impact of conditions in a selected area as compared with all other places in the state. 13 Additionally, data on community-level COVID-19 infection rates and community vaccination rates were used to identify high-priority zip codes (+). HPI+ 1.0 was released on March 17, 2021, and identified zip codes in the lowest quartiles of HPI and highest quartile of case rates. HPI+ 2.0 was released on December 20, 2021, and used lowest HPI quartiles and lowest community COVID-19 vaccination rates for people aged ≥12 years. HPI+ categorization was determined for each school based on zip code.
The data reported here focus on vaccine distribution at TK-12 schools from April 15, 2021, when adolescents aged 16-17 years became eligible for COVID-19 vaccine, through June 18, 2022, the last day of the 2021-2022 school year for the district with the latest end date.
Analysis
Data on school facilities, school-located vaccine clinic days, and vaccine doses administered at schools were captured in Microsoft Dynamics 365 SQL. School facility data were derived from the California Department of Education school directory and school administrators. Schools were categorized by grade level (kindergarten through grade 5 = elementary school; grades 6-8 = middle school; grades 9-12 = high school); categories were not mutually exclusive. Data from vaccine clinics were collected from vaccine providers. Dose data were collected in 2 ways: abstracted from the California Immunization Registry (CAIR2) 14 or collected directly from the vaccine provider. Dose data, including the number of doses administered and the age of recipients, were collected from CAIR2 for school-located vaccine clinics with a unique identification number in CAIR2. Age of recipients was then categorized into the following age groups: 5-11, 12-17, and ≥18 years. Data on the number of doses administered in school-located vaccine clinics without a unique identification number in CAIR2 were reported directly to LACDPH by the vaccine provider. For this subset of clinics, data on the age of the vaccine recipient were not collected; instead, the age range (5-11 or ≥12 years) of the recipient was determined by the vaccine product used. Each vaccine manufacturer had different products depending on a person’s age: children aged 5-11 or 6-11 years who received vaccine products were categorized in the 5-11 age group, and people aged ≥12 years who received vaccine products were categorized in the ≥12 age group.
The total number of doses administered at Los Angeles County clinics was abstracted from CAIR2 and used to determine the proportion of total doses in Los Angeles County administered at school-located vaccine clinics. Population estimates of Los Angeles County residents who received their primary vaccine series were calculated by using dose data abstracted from CAIR2 divided by population estimates from the Population Estimation and Projection System. 15
We performed data management and analysis by using SAS version 9.4 (SAS Institute, Inc) and Microsoft Excel. We used data on the number of school-located vaccine clinic days and the number of vaccine doses administered during the reporting period to calculate the median number of doses delivered by clinic model (SBHC or mobile), HPI+ status (HPI+ or non-HPI+), and age group (5-11 and ≥12 years or 5-11, 12-17, and ≥18 years). We used the Wilcoxon rank sum test to determine significant differences in the median number of doses administered by school type (elementary, middle, or high school), clinic model, and HPI+ status. We considered α = .05 to be significant. We calculated the proportions of clinics by provider type (federally qualified health center, LACDPH mobile vaccine partner, school district, pharmacy, other), HPI+ status, clinic model, and school type by dividing the relevant category by the total number of clinics during the reporting period. We generated time series of the number of administered doses, the median number of administered doses, and the number of clinics stratified by HPI+ status to examine trends over time.
Outcomes
Of the 80 school districts in Los Angeles County, 67 (83.8%) hosted school-located COVID-19 vaccine clinics. Three districts enrolled as COVID-19 vaccine providers and administered vaccines directly. The remaining 64 districts (95.5%) were partnered with a health care provider to administer vaccines. Los Angeles Unified School District, the second-largest school district in the nation, administered vaccine as a COVID-19 vaccine provider in its SBHCs and partnered with health care providers to administer COVID-19 vaccines at mobile clinics.
During the reporting period, 12 498 school-located vaccine clinic days were held at 1050 schools in 67 districts (Table). Forty-eight percent (6024 of 12 498) of school-located vaccine clinic days were conducted at SBHCs, and the remaining were conducted at mobile clinics. Vaccine providers at school-located vaccine clinics included federally qualified health centers (43.2% of clinic days), LACDPH-contracted mobile vaccine partners (23.6%), district providers (22.7%), pharmacies (6.8%), and other providers (3.7%). Of the 9924 (79.4%) clinic days with a documented clinic start and end time, 6449 (51.6%) were held during routine school hours, and 6049 (48.4%) were held after 5
Number of COVID-19 vaccine doses administered and characteristics of vaccination clinics at TK-12 schools in Los Angeles County, California, by clinic type, April 15, 2021, through June 18, 2022
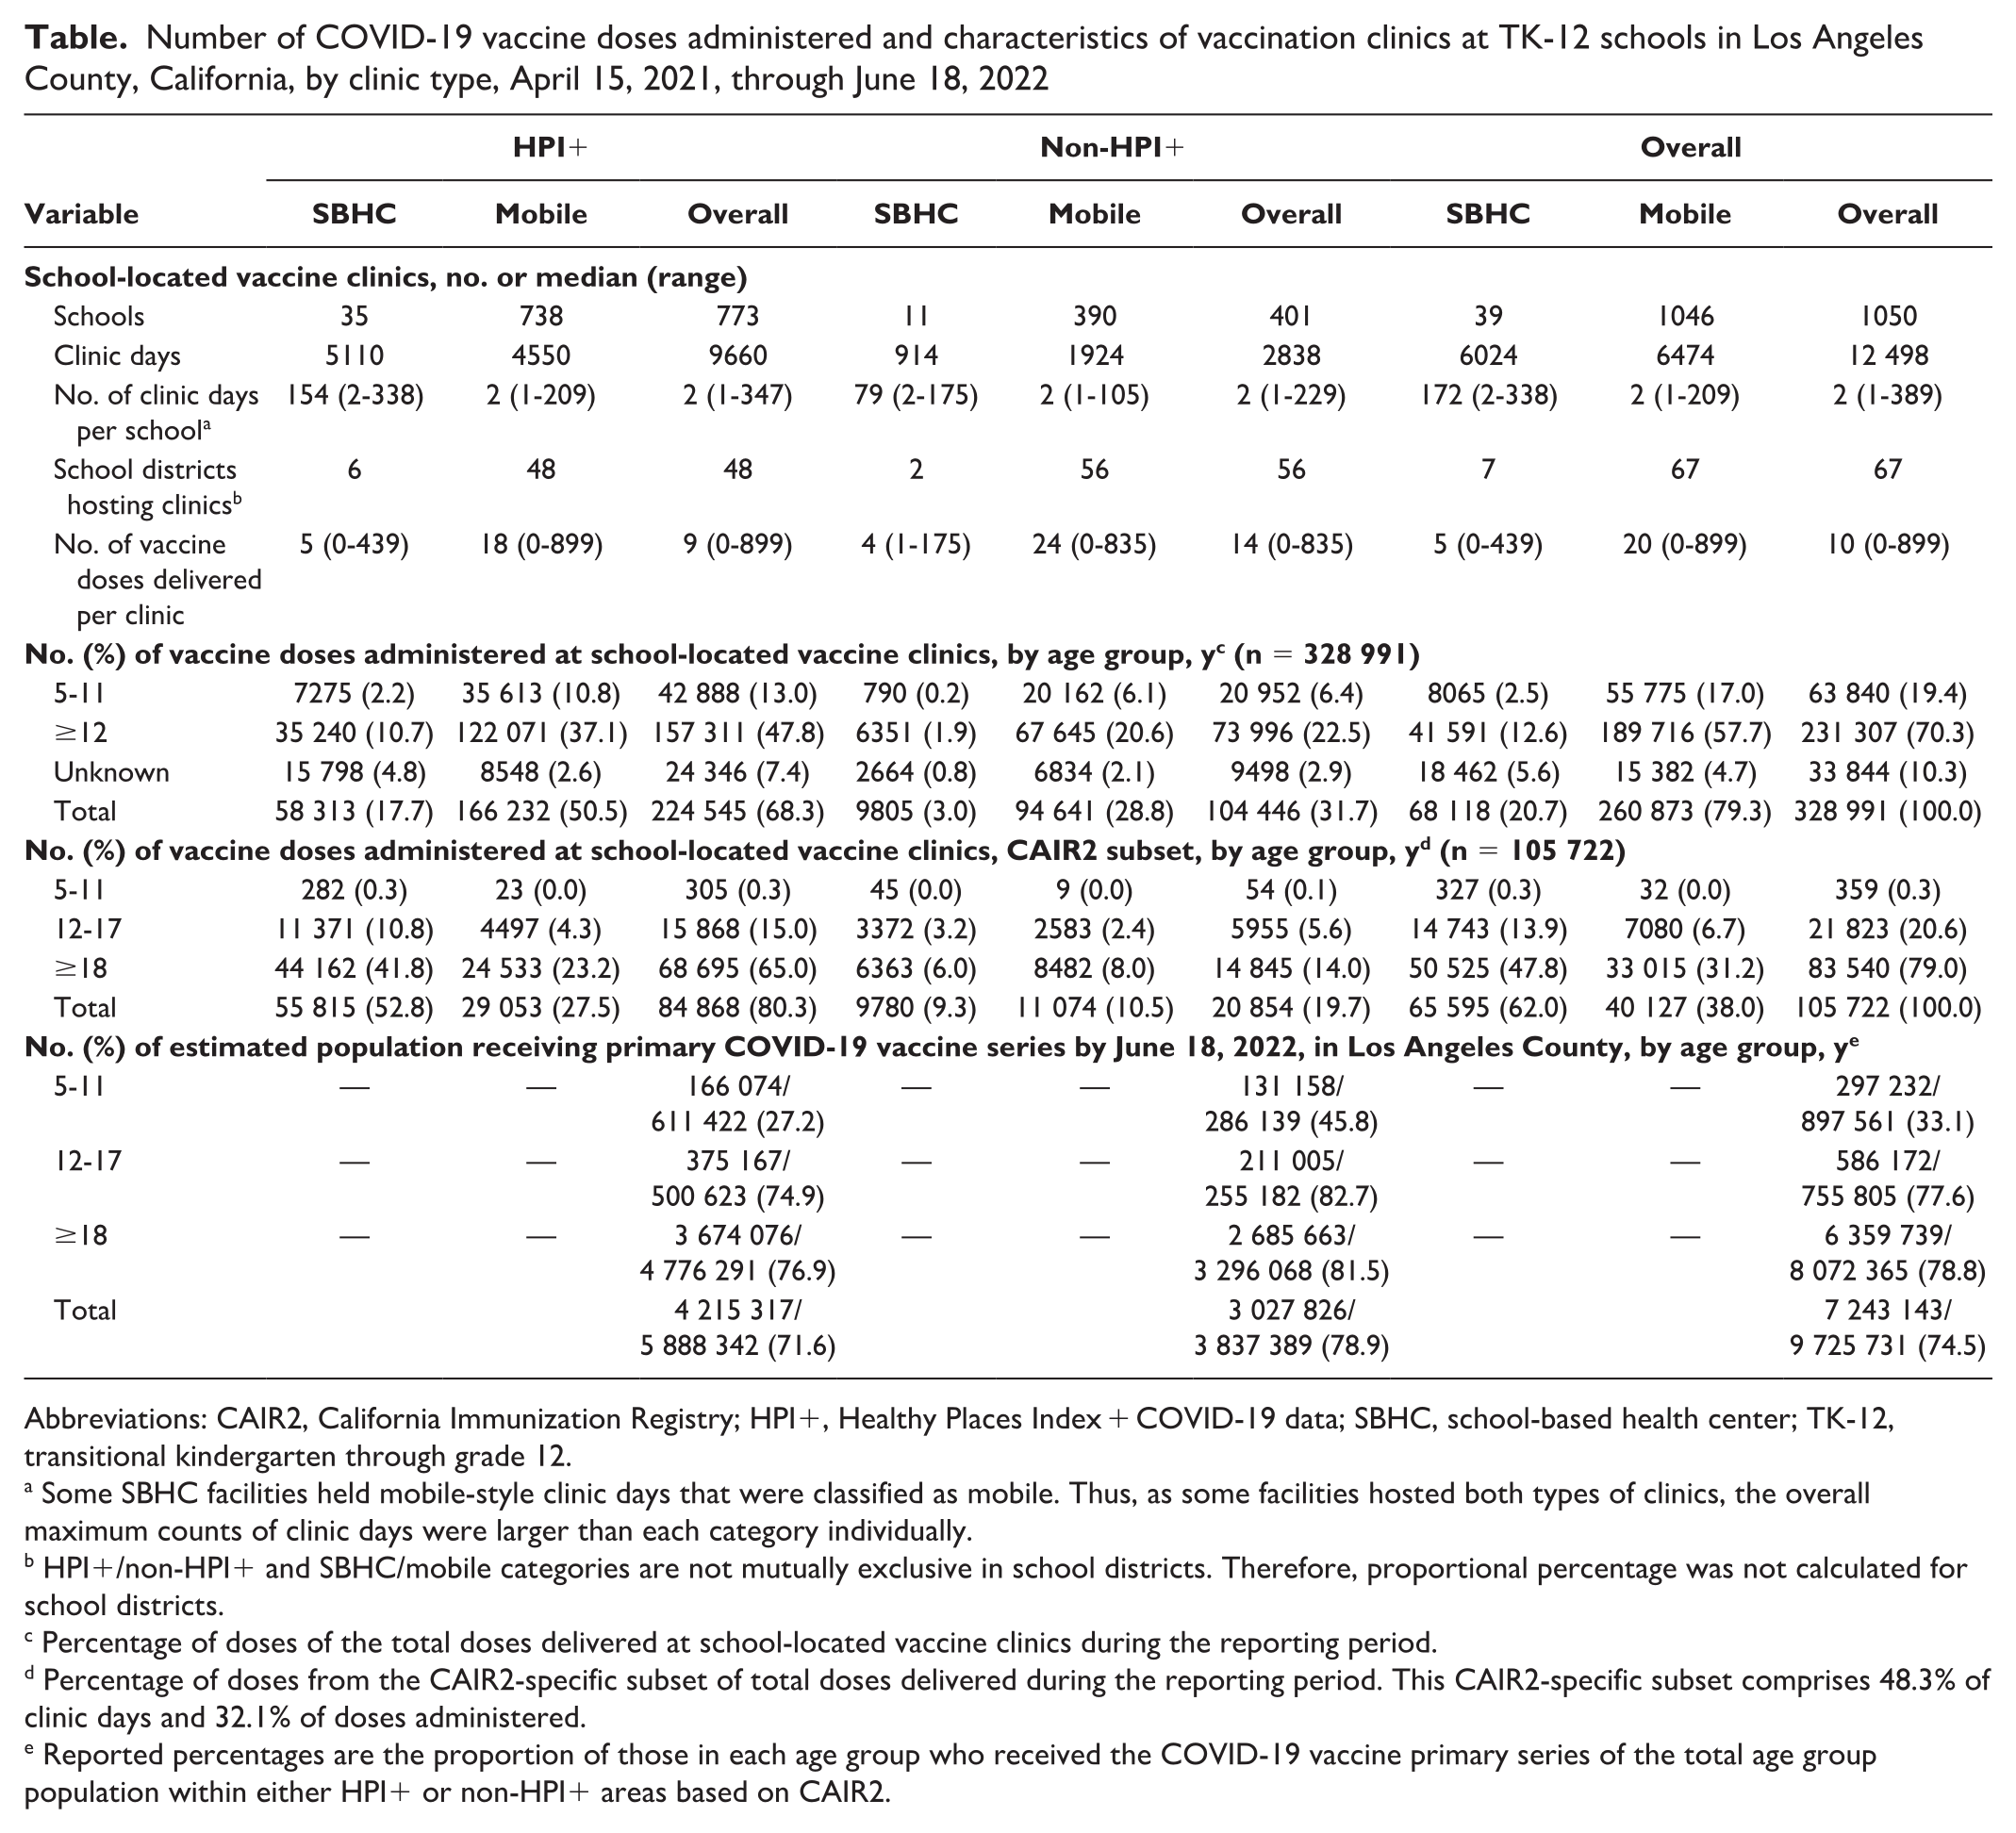
Abbreviations: CAIR2, California Immunization Registry; HPI+, Healthy Places Index + COVID-19 data; SBHC, school-based health center; TK-12, transitional kindergarten through grade 12.
Some SBHC facilities held mobile-style clinic days that were classified as mobile. Thus, as some facilities hosted both types of clinics, the overall maximum counts of clinic days were larger than each category individually.
HPI+/non-HPI+ and SBHC/mobile categories are not mutually exclusive in school districts. Therefore, proportional percentage was not calculated for school districts.
Percentage of doses of the total doses delivered at school-located vaccine clinics during the reporting period.
Percentage of doses from the CAIR2-specific subset of total doses delivered during the reporting period. This CAIR2-specific subset comprises 48.3% of clinic days and 32.1% of doses administered.
Reported percentages are the proportion of those in each age group who received the COVID-19 vaccine primary series of the total age group population within either HPI+ or non-HPI+ areas based on CAIR2.
Based on dose data available from 10 587 clinic days (84.8%), 328 991 doses were administered at school-located vaccine clinics. The number of doses accounted for approximately 3% of the >12.6 million total doses administered in Los Angeles County and nearly 10% of the 652 270 doses administered to children aged 5-11 years in Los Angeles County. Most doses at school-located vaccine clinics were administered to people aged ≥12 years (70.3%; Table). In the subset of data obtained through CAIR2 (48.3% of clinic days, 32.1% of doses reported at schools), most doses were delivered to adults aged ≥18 years (79.0%), followed by adolescents aged 12-17 years (20.6%).
A slightly higher number of clinic days occurred at high schools (n = 6245) than at middle (n = 4201) or elementary (n = 3078) schools, and the median number of doses delivered per clinic day was significantly higher at middle schools than at elementary and high schools (16 vs 8 and 11, respectively; P < .001). Most clinic days (77.3%) were in HPI+zip codes (Figure 1). Cumulatively, more doses were administered at schools in HPI+ regions than at schools in non-HPI+ regions (224 542 [68.3%] vs 104 446 [31.7%]). However, the median number of doses delivered per clinic at schools in non-HPI+ regions was significantly higher than at schools in HPI+ regions (14 vs 9; z = 8.9; P < .001; Table).
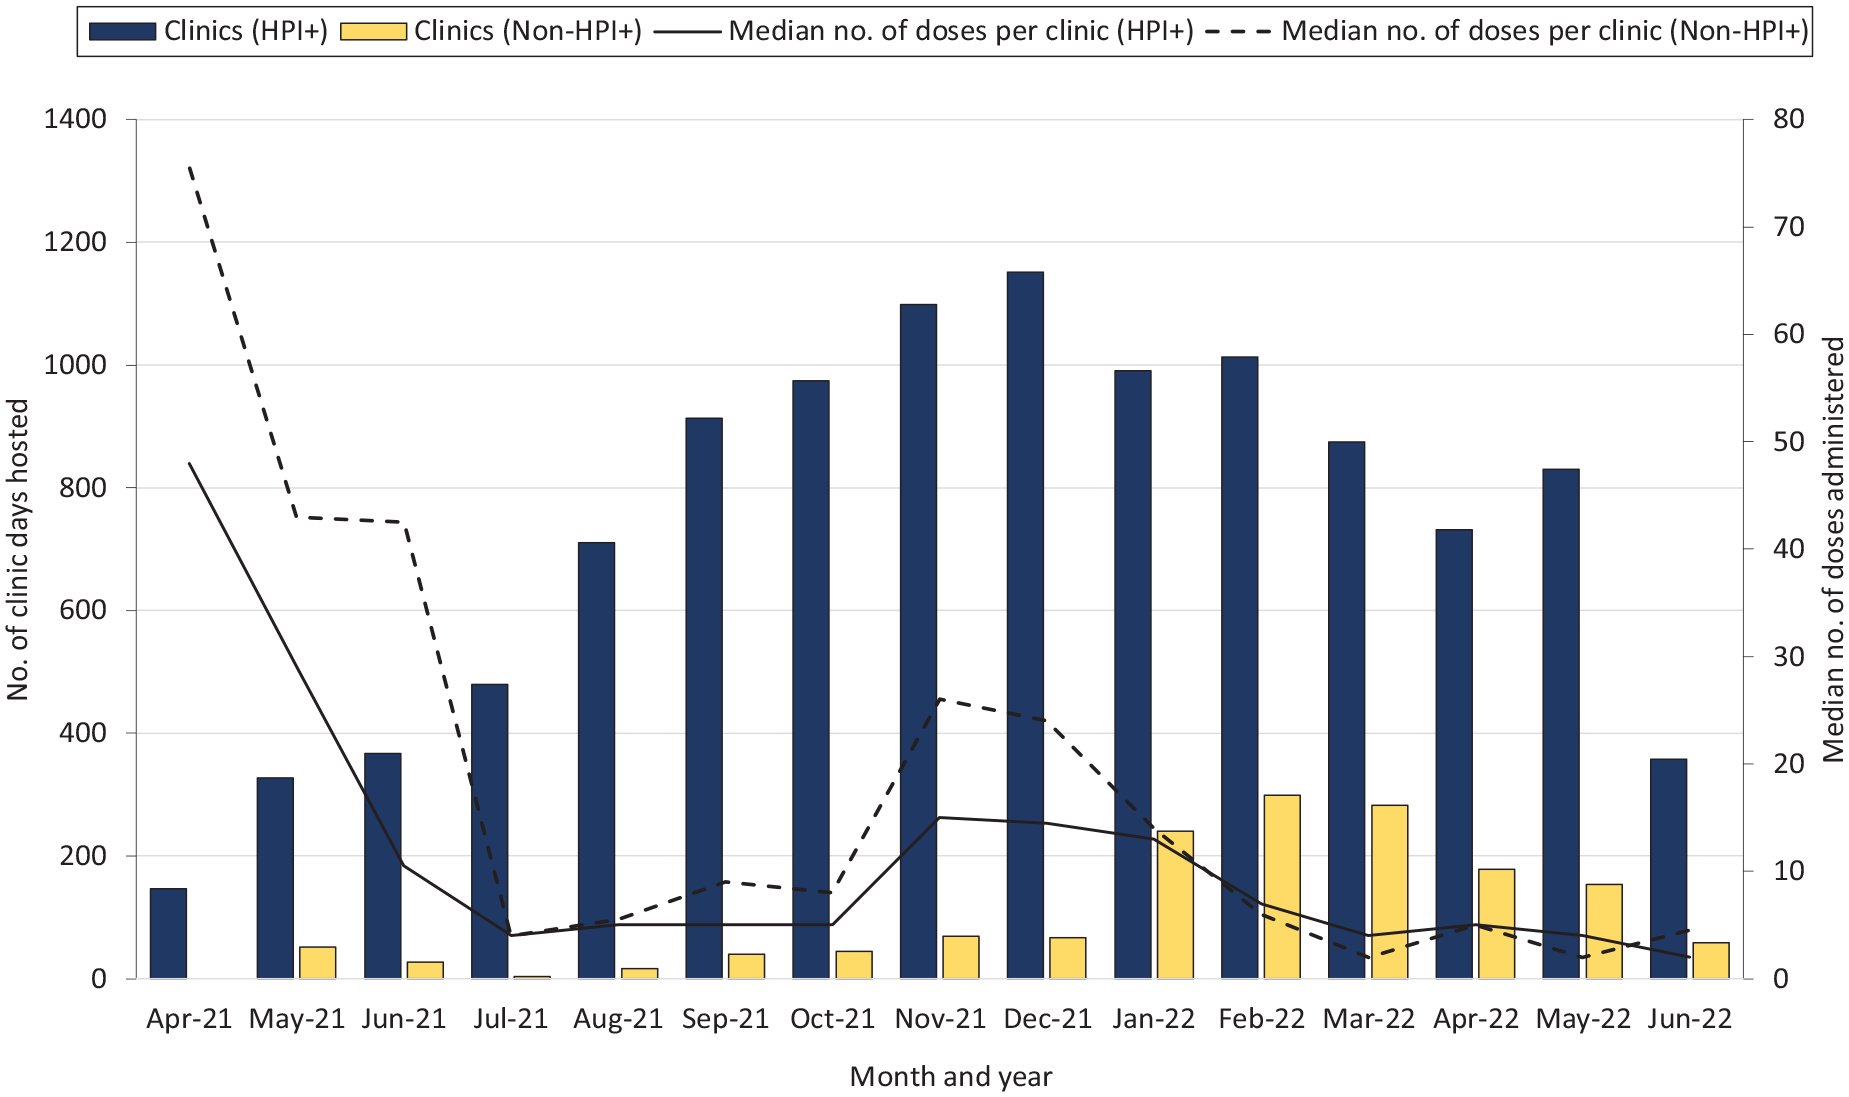
Number of clinic days and doses administered at school-located vaccine clinics, by HPI status, Los Angeles County, California, April 15, 2021, through June 18, 2022. Abbreviation: HPI+, Healthy Places Index + COVID-19 data.
The SBHC model was used at 39 of 1050 schools (3.7%) in 7 of 67 districts (10.4%); 89.7% were in HPI+ zip codes. The remaining school-located vaccine clinics were mobile clinics. The median number of doses administered per clinic was significantly lower at SBHCs than at mobile clinics (5 vs 20; z = −39.8; P < .001; Table).
Vaccine demand at school-located vaccine clinics fluctuated from 16 to 25 791 doses administered per week; the peaked occurred in November and December 2021 (Figure 2).
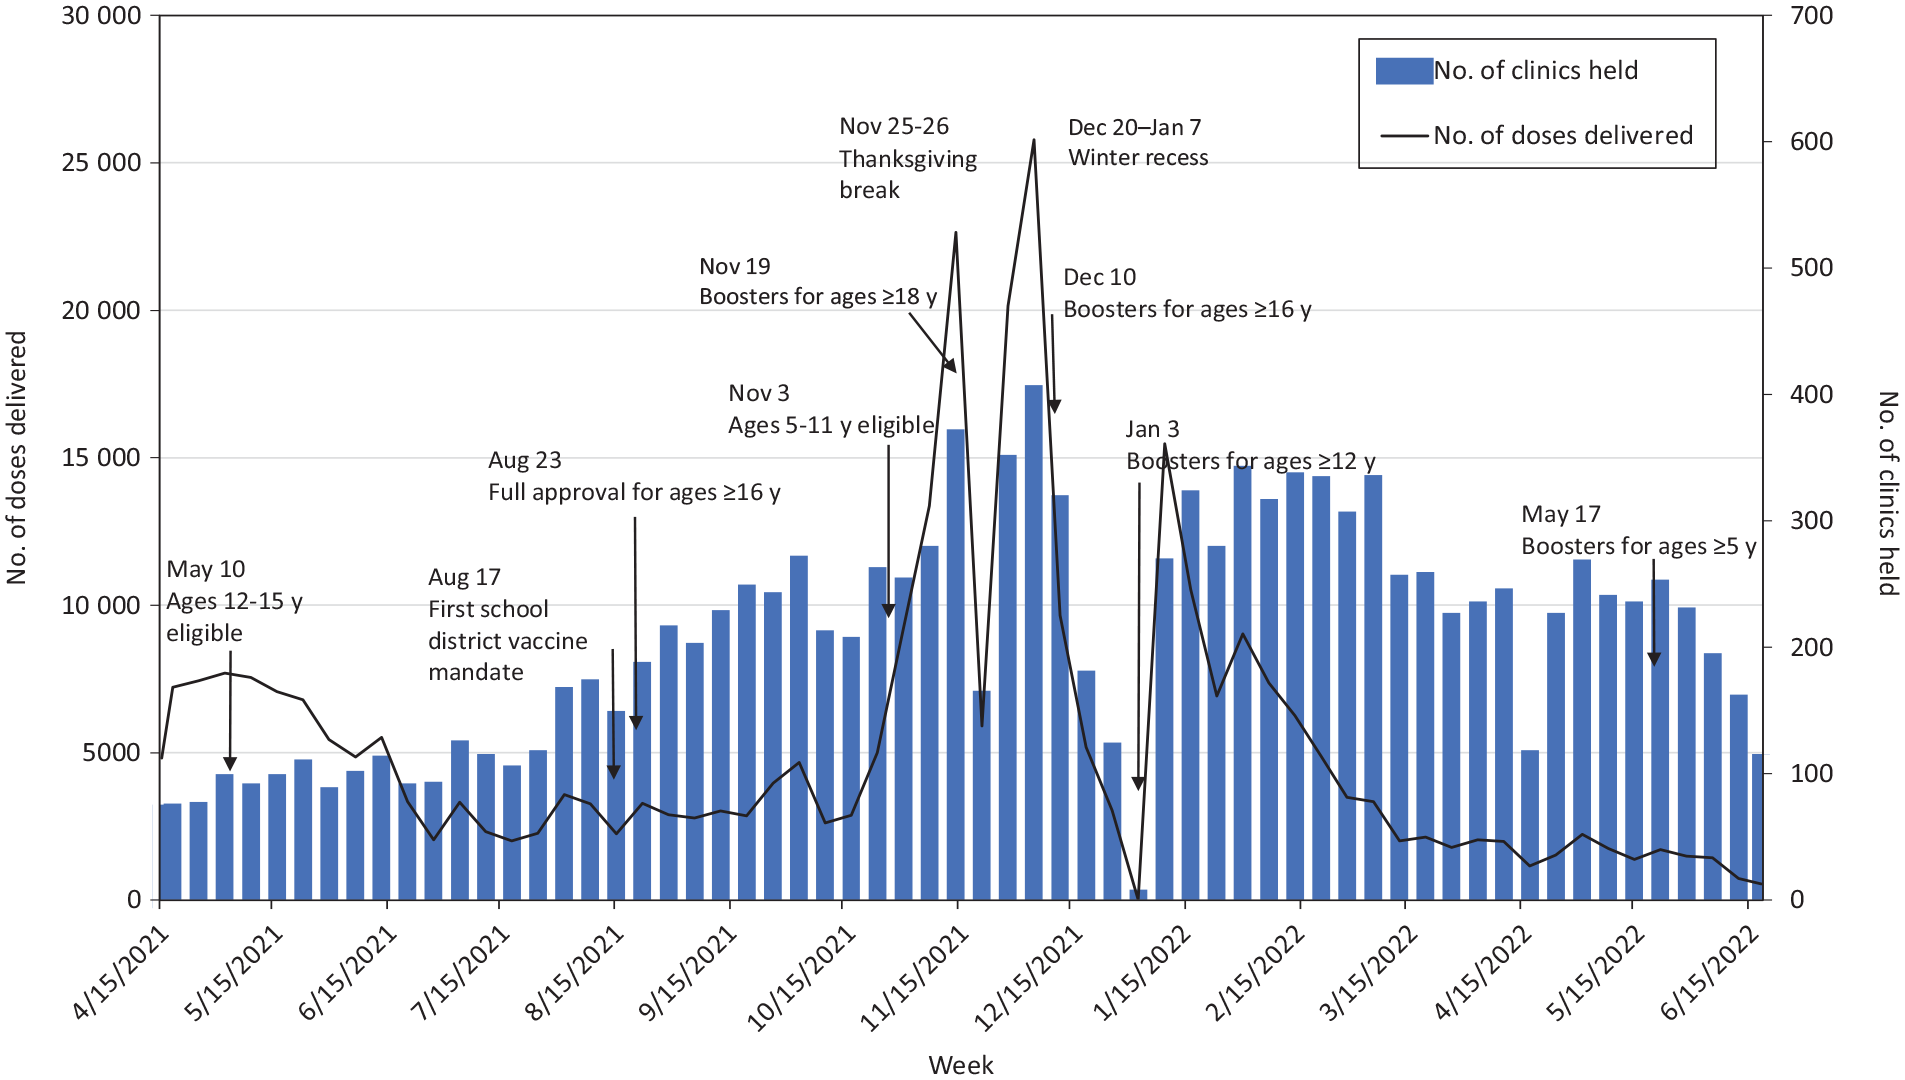
Number of doses of COVID-19 vaccine administered and number of school-located vaccine clinics held at K-12 schools in Los Angeles County, California, by week, April 15, 2021, through June 18, 2022. Abbreviation: K-12, kindergarten through 12th grade.
Lessons Learned
Vaccinating the community at TK-12 schools was a feasible and effective public health intervention. Despite this approach being broadly implemented throughout Los Angeles County, we found differences in how school-located vaccine clinics were received by the community and the resulting doses administered. The number of doses administered at school-located vaccine clinics surged after vaccine eligibility expanded for new age groups (eg, the US Food and Drug Administration 16 authorized vaccines for children aged 5-11 years on October 29, 2021); infection rates increased; and school mandates went into effect in 3 school districts that required all eligible students aged ≥12 years to be vaccinated against COVID-19. People living in zip codes in the higher 2 HPI quartiles were more likely than those in the lower 2 HPI quartiles to be vaccinated as soon as they became eligible, 17 whereas vaccination rates in zip codes in the lower HPI quartiles lagged and remained considerably lower for children aged 5-11 years than for people aged ≥12 years. 5 In Los Angeles County, the percentage of adults aged ≥18 years who completed their primary COVID-19 vaccine series was similar in HPI+ and non-HPI+ regions (76.9% vs 81.5%); however, the gap widened as age decreased (74.9% vs 82.7% among adolescents aged 12-17 years and 27.2% vs 45.8% among children aged 5-11 years). While most doses administered at school-located vaccine clinics were given to people aged ≥12 years, the proportion of children aged 5-11 years in Los Angeles County who received a vaccine dose at a school-located vaccine clinic was higher than the proportion of people aged ≥12 years who received a vaccine dose at a school-located vaccine clinic (9.8% vs 1.9%).
In HPI+ regions, additional community vaccine locations, including school-located vaccine clinics, were necessary. Communities in low HPI quartiles experience more adverse conditions than communities in high HPI quartiles, such as household income below the federal poverty level, unstable housing/living conditions, and lower levels of education.14,18,19 Black/African American and Hispanic/Latino people were also more likely than non-Hispanic White people to live in communities in the lower quartiles of HPI. Studies have demonstrated higher levels of vaccine hesitancy and low levels of vaccine confidence among Black/African American and Hispanic/Latino people than among non-Hispanic White people, as well as among people in households with lower income levels and with less than a bachelor’s degree than among people in households with higher income levels and a bachelor’s degree or higher.19-23 Strategies to address vaccine hesitancy and increase vaccine confidence should be considered by the clinics. In Los Angeles County, strategies included funding community-based organizations to provide vaccine outreach that was culturally and linguistically appropriate, distributing vaccine information and materials in multiple languages, providing monetary or material incentives, and incorporating health services and community resources at vaccine clinics. Consistent with Klaiman et al, 24 we found that strong partnerships with school administrators, vaccine partners, and community-based organizations were vital to successful school vaccination efforts. Data from the winter 2021 Kaiser Family Foundation COVID-19 Vaccine Monitor reported that parents who said that their child’s school encouraged COVID-19 vaccination for children were 4 times as likely as those whose school did not encourage vaccination to say that their child received the COVID-19 vaccine. 25
SBHCs fill a vital gap in health care access, including access to vaccines; they operate full-service clinics but often have limited space and personnel, and in Los Angeles County, <2.5% of schools have an SBHC. By creating partnerships between schools and local health care providers, mobile school-located vaccine clinics can scale up services based on demand and for communities with limited vaccine or health care access.
Conclusions
School-located vaccine clinics should be considered when needing to immunize large numbers of people in a short period. In communities with limited health care access or high levels of mistrust in the medical establishment, expanding SBHCs or using mobile school clinics with a consistent presence in the community coupled with trusted messengers and strategies to increase vaccine confidence may be needed to improve vaccine coverage.
Footnotes
Acknowledgements
The authors thank the Los Angeles County Office of Education for its partnership and the school administrators and health care providers who participated in school-located vaccine clinics. We acknowledge the contributions made by Karen Chang, PhD, MHS (Centers for Disease Control and Prevention), and personnel at LACDPH, including Adriana Diaz, MPH, Kenya McCloyn, MPH, Meera McLane, MPH, Olivia Moir, MSPH, Kashti Nayem, MPH, Sandra Trinidad, MPH, Sherry Yin, MPH, and the school vaccine team at Los Angeles County.
Declaration of Conflicting Interests
The authors declared no potential conflicts of interest with respect to the research, authorship, and/or publication of this article.
Funding
The authors received no financial support for the research, authorship, and/or publication of this article.