
Abstract
Objective:
Assessing mobility among people with HIV is an important consideration when measuring HIV incidence, prevalence, and the care continuum in the United States. Our aims were to measure mobility among people with HIV compared with the general population and to examine factors associated with migration among people with HIV.
Methods:
We calculated state-to-state move-in and move-out migration rates for 2011 through 2019 using National HIV Surveillance System data for people with HIV and using US Census data for the general population. For people with HIV, we also assessed the association between migration and HIV care outcomes.
Results:
From 2011 through 2019, the US general population had stable migration, whereas migration rates among people with HIV fluctuated and were higher than among the general population. Among people with HIV, migration rates in 2019 were higher among people assigned male sex at birth versus female sex at birth, among people aged ≤24 years versus ≥25 years, among people with HIV infection attributed to male-to-male sexual contact versus other transmission categories, and among non-Hispanic Other people (ie, American Indian or Alaska Native, Asian, Native Hawaiian or Other Pacific Islander, or multiple races) versus Hispanic, non-Hispanic Black, and non-Hispanic White people. Receipt of HIV medical care (90.3% vs 75.5%) and achieving viral suppression (72.1% vs 65.3%) were higher among people with HIV who migrated versus those who did not.
Conclusions:
People with HIV in the United States are more mobile than the general population. Determining the mobility of people with HIV can help with strategic allocation of HIV prevention and care resources.
Population mobility contributes to the transmission of infectious diseases, including HIV, across geographic areas over time. 1 In some areas of Africa, mobile populations have a higher prevalence of HIV infection and more often engage in sexual behaviors that increase the chances of acquiring HIV than nonmobile populations.2,3 Because of the long asymptomatic phase of HIV and diagnosis delays, 4 people with HIV may not be aware of their status for some time and may not know where they acquired HIV once HIV is diagnosed. After receiving a diagnosis, people with HIV may relocate for several reasons, such as seeking better care or being close to family support. Factors associated with migration among people with HIV have been shown to differ by race, age, and HIV transmission category. 5
Knowing the level of mobility among people with HIV in a geographic area can inform the assessment of incidence and prevalence of HIV and the HIV care continuum for that area. Resources for HIV testing, improved care, and effective treatment can be made available for subgroups moving into an area. This study explored the hypothesis that interstate migration differs between the general population and people with diagnosed HIV and by demographic characteristics and transmission categories among people with diagnosed HIV. This study also assessed the percentage of people with HIV who received HIV medical care and attained viral suppression, by migration status, and the associations between level of mobility in the general population and estimated incidence and prevalence rates of HIV.
Methods
We used data from the Centers for Disease Control and Prevention’s (CDC’s) National HIV Surveillance System (NHSS) 6 through December 2020 to assess changes in place of residence within a calendar year (based on state, including the District of Columbia) among people with diagnosed HIV who were alive at the end of each year for years 2011 through 2019. NHSS is a population-based census of all people with diagnosed HIV in the United States and 6 US dependent areas and has an estimated completeness of reporting of ≥85%. 7 To determine changes in place of residence (state-to-state migration), twice yearly, CDC informs local, state, and territorial HIV surveillance programs about potential interstate duplicates of HIV diagnoses reported in the most recent 6-month period. HIV surveillance programs are given 6 months to resolve potential duplicates and update their respective HIV reporting system.
Our study did not require institutional review board review or approval because, per federal guidelines, NHSS is determined to be a public health activity and not human subjects research.
Using NHSS data, we calculated state-to-state migration rates among people with diagnosed HIV by region (Northeast, Midwest, South, West), assigned sex at birth (male or female), race and ethnicity (non-Hispanic Black/African American, Hispanic/Latino, non-Hispanic White, non-Hispanic Other [American Indian or Alaska Native, Asian, Native Hawaiian or Other Pacific Islander, and >1 race]), age group (≤24, 25-44, ≥45 years), and HIV transmission category (male-to-male sexual contact [MMSC], injection drug use [IDU], heterosexual contact, other [other risk factors, including perinatal, hemophilia, and blood transfusion]) to assess differences in mobility. American Indian or Alaska Native, Asian, Native Hawaiian or other Pacific Islander, and multiracial people were combined into 1 group because estimates derived from small numbers resulted in large SEs. Because of small numbers, we also combined the number of diagnoses of HIV infection attributed to MMSC with the number of diagnoses attributed to both MMSC and IDU. We statistically adjusted data by using multiple imputation techniques to account for missing HIV transmission categories. 8
We obtained migration data for the general population from 2011 through 2019 from the US Census American Community Survey (ACS). 9 Data reported in the ACS are estimates with a margin of error (90% CI). We used these data to assess migration in the general population and to compare mobility in the general population with mobility among people with diagnosed HIV, overall and by state and region. Rate tables based on the ACS for state-to-state migration stratified by demographic variables are not publicly available. Although such rate tables exist, the data are based on Current Population Survey data, which are not required, as are ACS data.
We measured mobility by using the annual move-in and move-out migration rates for each of the 50 states and the District of Columbia and by using migration rate formulas. We calculated migration rates as follows:
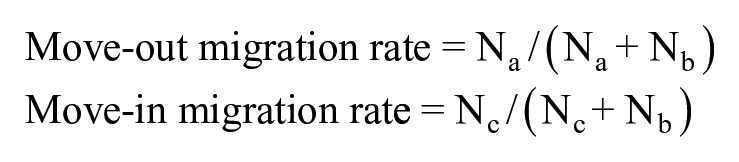
where Na is the number of people who resided in state X at time point Y0 but moved out of state X and are still alive at time point Y1, Nb is the number of people who resided in the same state (eg, state X) during the entire period between Y0 and Y1 (eg, 1 calendar year), and Nc is the number of people who resided in state X at time point Y1 but in a different state at time point Y0 (ie, moved into state X between Y0 and Y1). In a migration-balanced state, the annual move-out and move-in rates are approximately equal.
We calculated move-in and move-out migration rates and corresponding 95% CIs for the general population and for people with diagnosed HIV. We considered the year-to-year migration rates as stable if the change was <5%, regardless of whether the move-in and move-out rates were balanced. We also calculated migration rate ratios (RRs, dividing the rate for people with diagnosed HIV with the rate for the general population) for 2011 through 2019, which allowed us to compare move-in and move-out migration rates between the general population and people with diagnosed HIV over time. We assessed regional migration rates by grouping states by census-defined regions, regardless of whether a person moved within or outside of a region. We used SAS version 9.4 (SAS Institute Inc) for calculations in our analysis.
We estimated correlations between characteristics (population size, land area, population density, migration rates) of the general population in each state and characteristics of people with diagnosed HIV by using estimates of the number of HIV infections (incidence), incidence rate, the number of people living with HIV (prevalence), prevalence rate, and move-in and move-out migration rates for each state, in 2019. For estimates of incidence and prevalence, as described previously, CDC used the first CD4 T-lymphocyte (CD4+) count test result after HIV diagnosis and a CD4-depletion model indicating disease progression or duration after infection. 10 We excluded the District of Columbia in the correlation analysis because of its small land area and high rate of migration and HIV prevalence. We used the t test to identify significant correlations, with P < .05 considered significant.
We also assessed the percentage of people living with diagnosed HIV who received HIV care (CD4 test or viral load test) and who attained viral suppression (viral load <200 copies/mL) during 2019 by migration status (migrated or did not migrate).
Results
State-to-state migration rates were stable among the general population from 2011 through 2019, ranging from 2.28% to 2.39%. State-to-state migration rates among people with diagnosed HIV were higher and more varied than among the general population during all years, with a range of 3.04% to 3.98% (Table 1).
Move-in and move-out migration rates among the general population and among people with diagnosed HIV, United States, 2011-2019 a
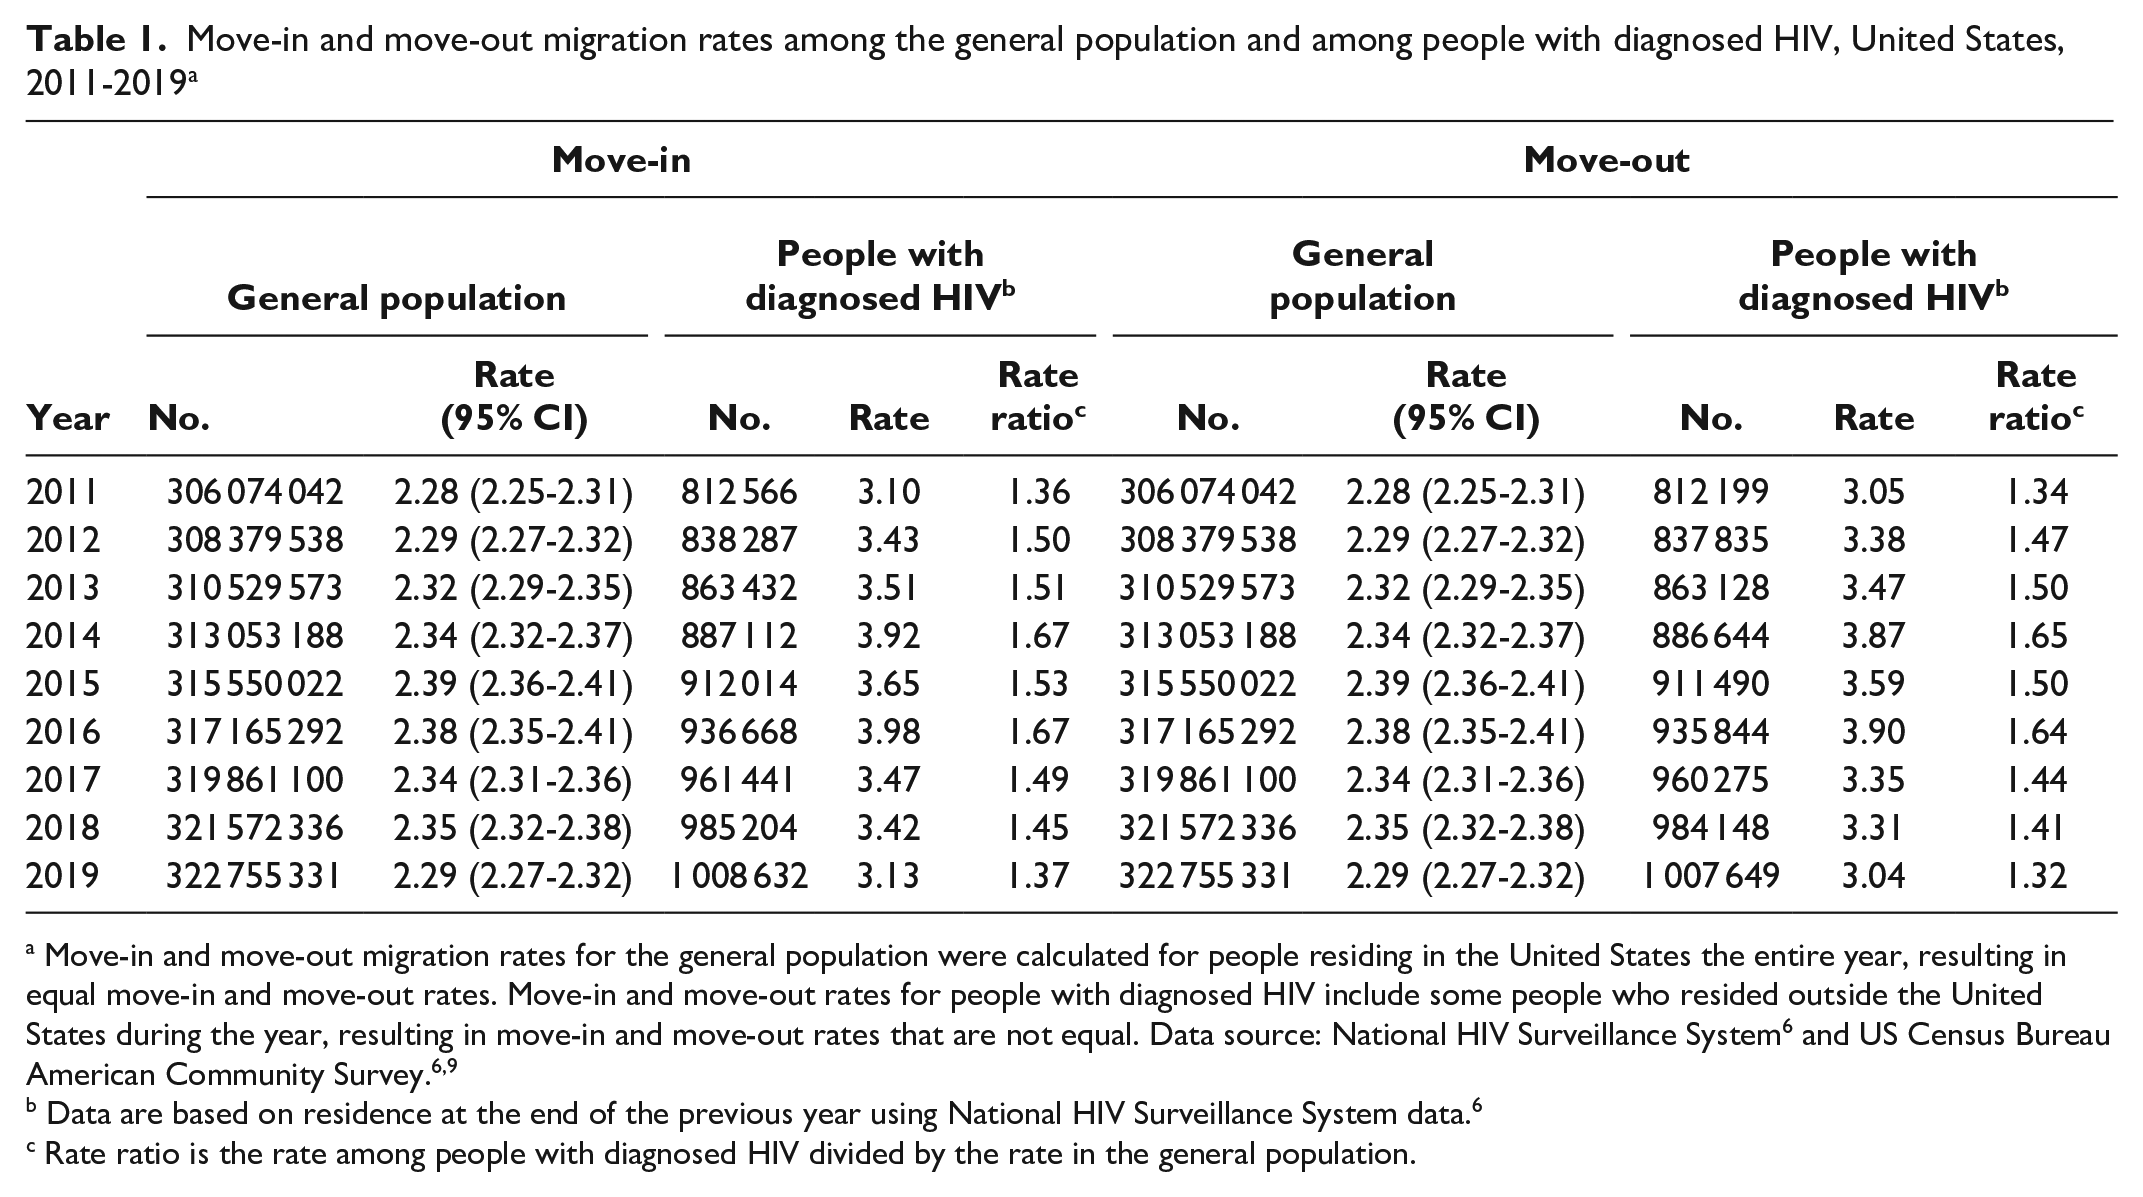
Move-in and move-out migration rates for the general population were calculated for people residing in the United States the entire year, resulting in equal move-in and move-out rates. Move-in and move-out rates for people with diagnosed HIV include some people who resided outside the United States during the year, resulting in move-in and move-out rates that are not equal. Data source: National HIV Surveillance System 6 and US Census Bureau American Community Survey.6,9
Data are based on residence at the end of the previous year using National HIV Surveillance System data. 6
Rate ratio is the rate among people with diagnosed HIV divided by the rate in the general population.
During 2019, among the general population and among people with diagnosed HIV, state-to-state move-in and move-out migration rates varied by region. Among the general population, states in the South had the highest move-in rate (2.57%), followed by the West (2.41%), the Midwest (1.97%), and the Northeast (1.90%) (eTable 1 in Supplemental Material). The Northeast had the highest state-to-state move-out rate (2.43%), followed by the West (2.39%), the South (2.27%), and the Midwest (2.11%). Among people with diagnosed HIV, the Midwest had the highest move-in and move-out rates (3.81% and 4.09%, respectively), followed by the South (3.28% and 3.05%, respectively), the West (3.10% and 2.82%, respectively), and the Northeast (2.50% and 2.65%, respectively).
The District of Columbia had the highest move-in and move-out rates among the general population during 2019 (8.56% and 7.65%, respectively); among people with diagnosed HIV, South Dakota had the highest move-in rate (9.11%) and Wyoming had the highest move-out rate (9.80%) (eTable 1 in Supplemental Material). At the state level, most states had migration rates among people with diagnosed HIV that were higher than rates among the general population. Iowa had the highest move-in RR of people with diagnosed HIV compared with the general population (RR = 3.13), whereas Indiana had the highest move-out RR (RR = 2.65). Move-in rates were greater among the general population than among people with diagnosed HIV in Colorado (RR = 0.98), Florida (RR = 0.91), Tennessee (RR = 0.90), and the District of Columbia (RR = 0.53), and move-out rates were higher among the general population than among people with diagnosed HIV in Connecticut (RR = 0.86), the District of Columbia (RR = 0.69), and Massachusetts (RR = 0.92) (Figure). Colorado was the only state in 2019 in which the move-in rate among people with diagnosed HIV (4.18%) did not differ significantly from the move-in rate among the general population (rate = 4.24%) (eTable 1 in Supplemental Material). Four states (Alaska, Connecticut, New Jersey, Tennessee) had move-out rates among people with diagnosed HIV that did not differ significantly from move-out rates among the general population (eTable 1 in Supplemental Material).
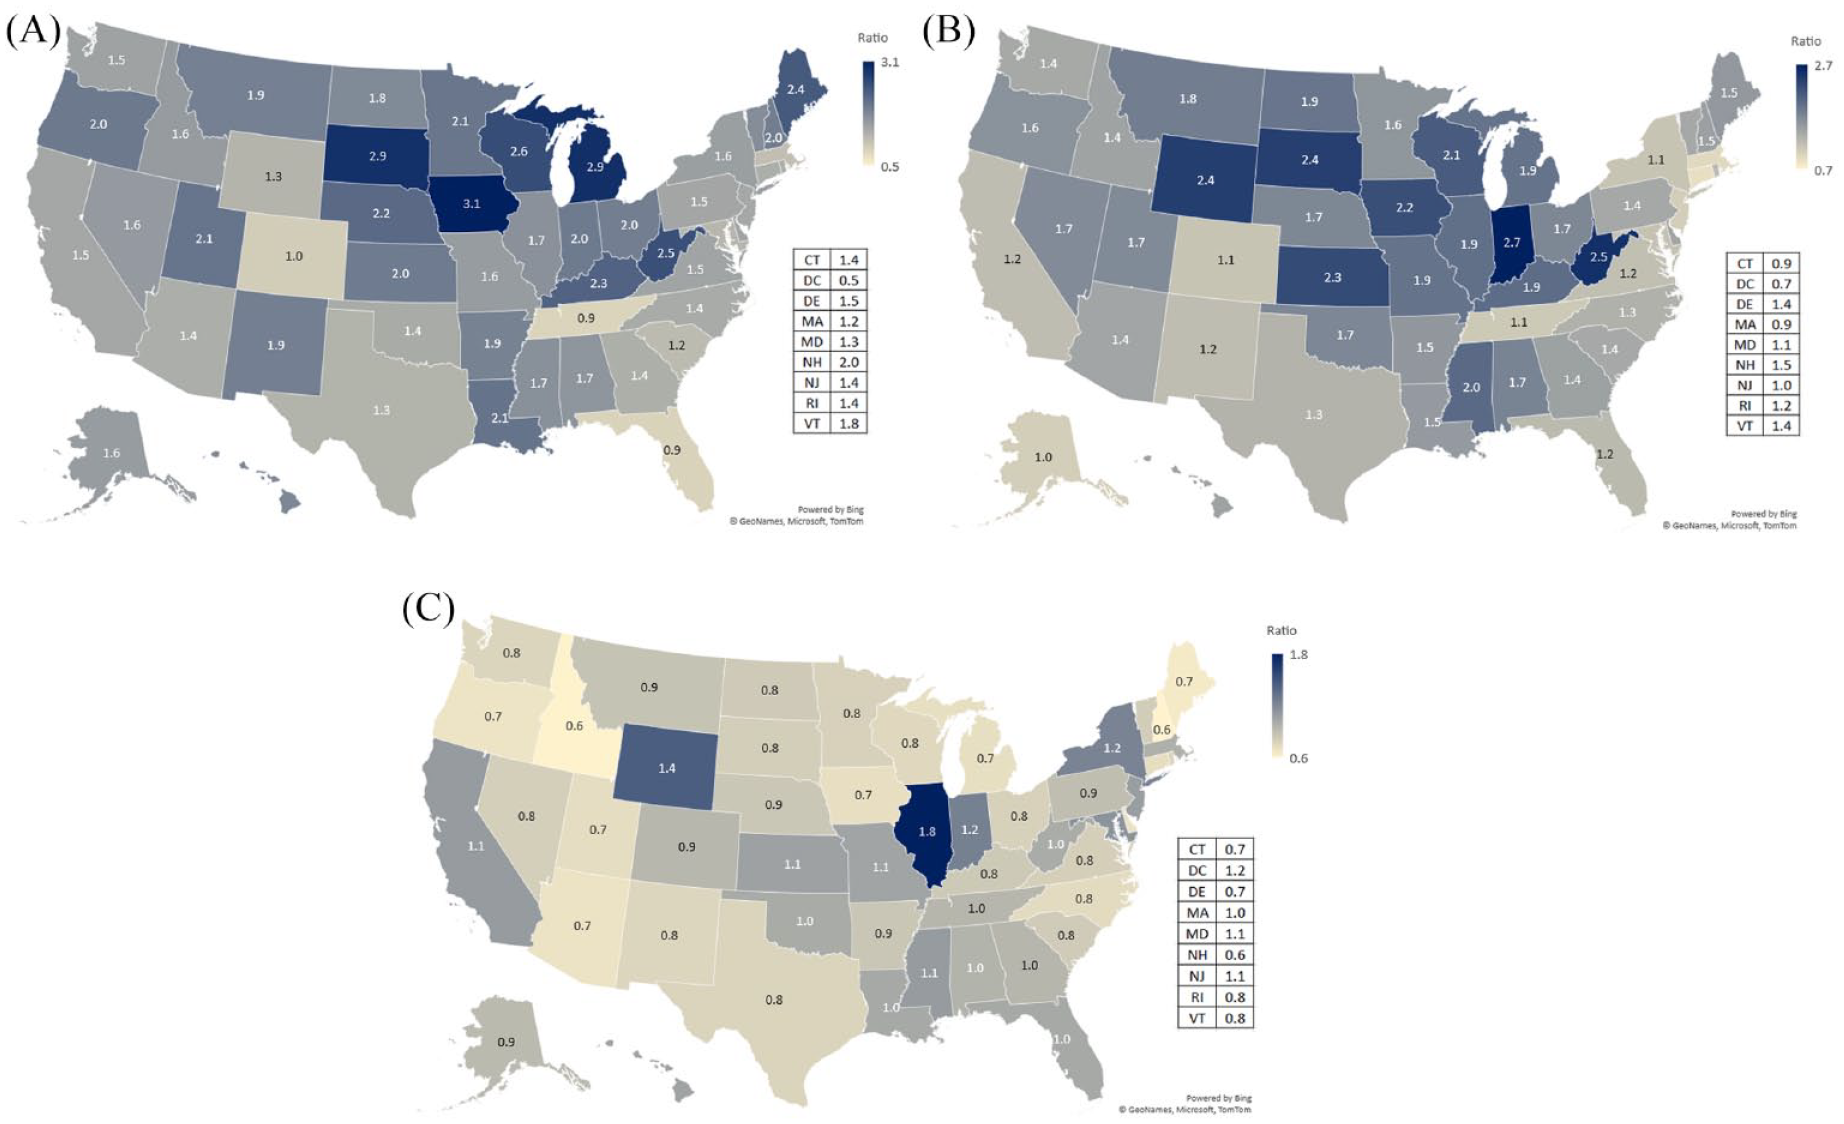
State-to-state move-in and move-out migration rates and rate ratios among people with diagnosed HIV versus the general population, United States, 2019. (A) Move-in migration rate ratio. (B) Move-out migration rate. (C) Move-out to move-in migration rate ratio. Data source: National HIV Surveillance System and US Census Bureau American Community Survey.6,9
During 2011 through 2019, state-to-state move-in and move-out migration rates were higher among people with diagnosed HIV assigned male sex at birth (3.4% and 3.3% in 2019, respectively) than among people with diagnosed HIV assigned female sex at birth (2.2% and 2.1% in 2019, respectively), among people aged ≤24 years (5.6% and 5.2% in 2019, respectively) than among people aged 25-44 years (4.7% and 4.5%, respectively) and ≥45 years (2.2% and 2.1%, respectively), and among people with HIV infection attributed to MMSC and attributed to MMSC and IDU (3.7% for both move-in and move-out migration rates in 2019) than among people from other transmission categories (Table 2 and eTable 2 in Supplemental Material). Across all regions in the United States in 2019, non-Hispanic Other people had the highest migration rates versus non-Hispanic White, non-Hispanic Black or African American, or Hispanic or Latino people. In 2019, among non-Hispanic Black or African American, Hispanic or Latino, and non-Hispanic White people with diagnosed HIV, non-Hispanic Black or African American people had the highest move-in and move-out rates in the West (3.9% and 3.4%, respectively); in addition, Hispanic or Latino people had the highest move-in and move-out rates in the Midwest (4.6% and 4.8%, respectively), and non-Hispanic White people had the highest move-in and move-out rates in the Northeast (2.6% and 2.9%, respectively) (Table 2).
State-to-state move-in and move-out migration rates among people with diagnosed HIV, by US region and demographic characteristics, 2019 a
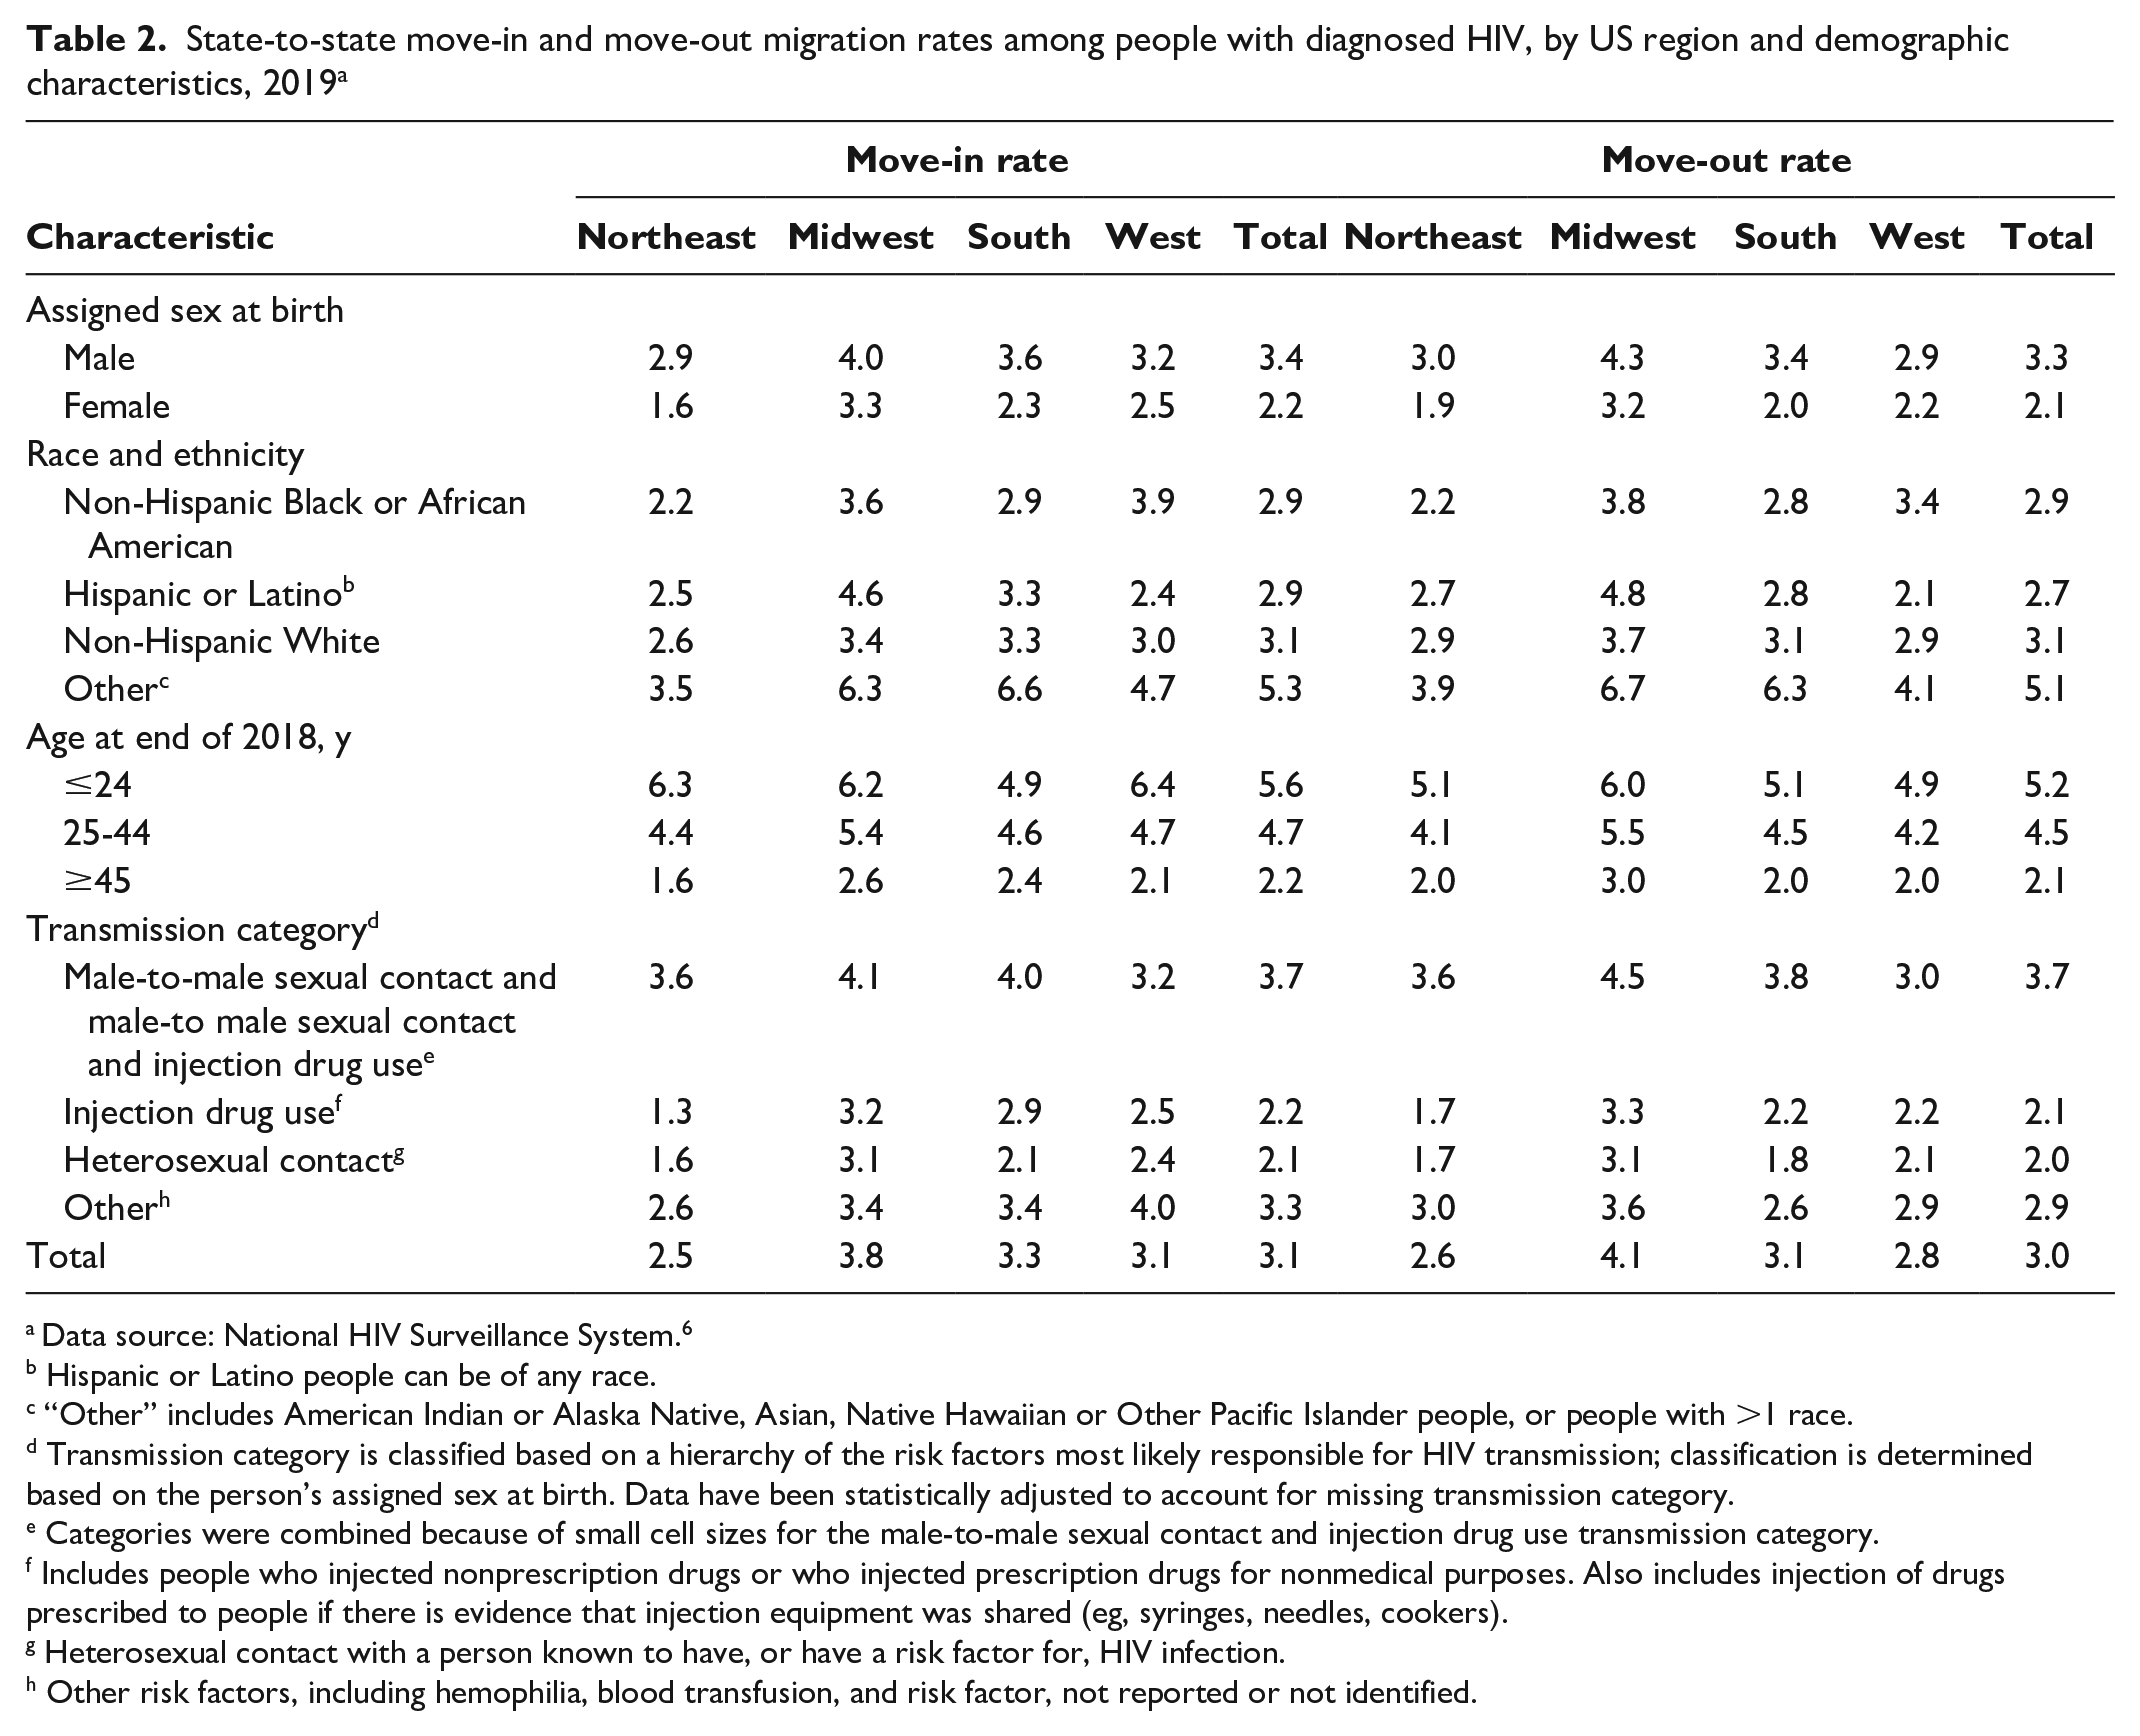
Data source: National HIV Surveillance System. 6
Hispanic or Latino people can be of any race.
“Other” includes American Indian or Alaska Native, Asian, Native Hawaiian or Other Pacific Islander people, or people with >1 race.
Transmission category is classified based on a hierarchy of the risk factors most likely responsible for HIV transmission; classification is determined based on the person’s assigned sex at birth. Data have been statistically adjusted to account for missing transmission category.
Categories were combined because of small cell sizes for the male-to-male sexual contact and injection drug use transmission category.
Includes people who injected nonprescription drugs or who injected prescription drugs for nonmedical purposes. Also includes injection of drugs prescribed to people if there is evidence that injection equipment was shared (eg, syringes, needles, cookers).
Heterosexual contact with a person known to have, or have a risk factor for, HIV infection.
Other risk factors, including hemophilia, blood transfusion, and risk factor, not reported or not identified.
State-to-state move-in and move-out migration rates among the general population were negatively correlated with HIV incidence (–0.37 and –0.41, respectively) and HIV prevalence (–0.44 and –0.39, respectively) (Table 3). The size of the general population had a high positive correlation with all HIV variables. The density of the general population had a high positive correlation with HIV prevalence rate, a negative correlation with migration rates among people with diagnosed HIV, and no significant correlation with HIV incidence, HIV incidence rate, or HIV prevalence (Table 3). The land area of a state had no significant correlation with any HIV variable. Correlation analyses by state revealed a positive correlation between HIV incidence rate and HIV prevalence rate (eFigure 1 in Supplemental Material). Among people with HIV, we found negative correlations between HIV incidence rate and move-in rate, between HIV prevalence rate and move-in rate, and between population density and move-in rate (eFigures 2-4 in Supplemental Material).
Correlations between characteristics in the general population (row variables) and measures of HIV (column variables), by US state, 2019 a
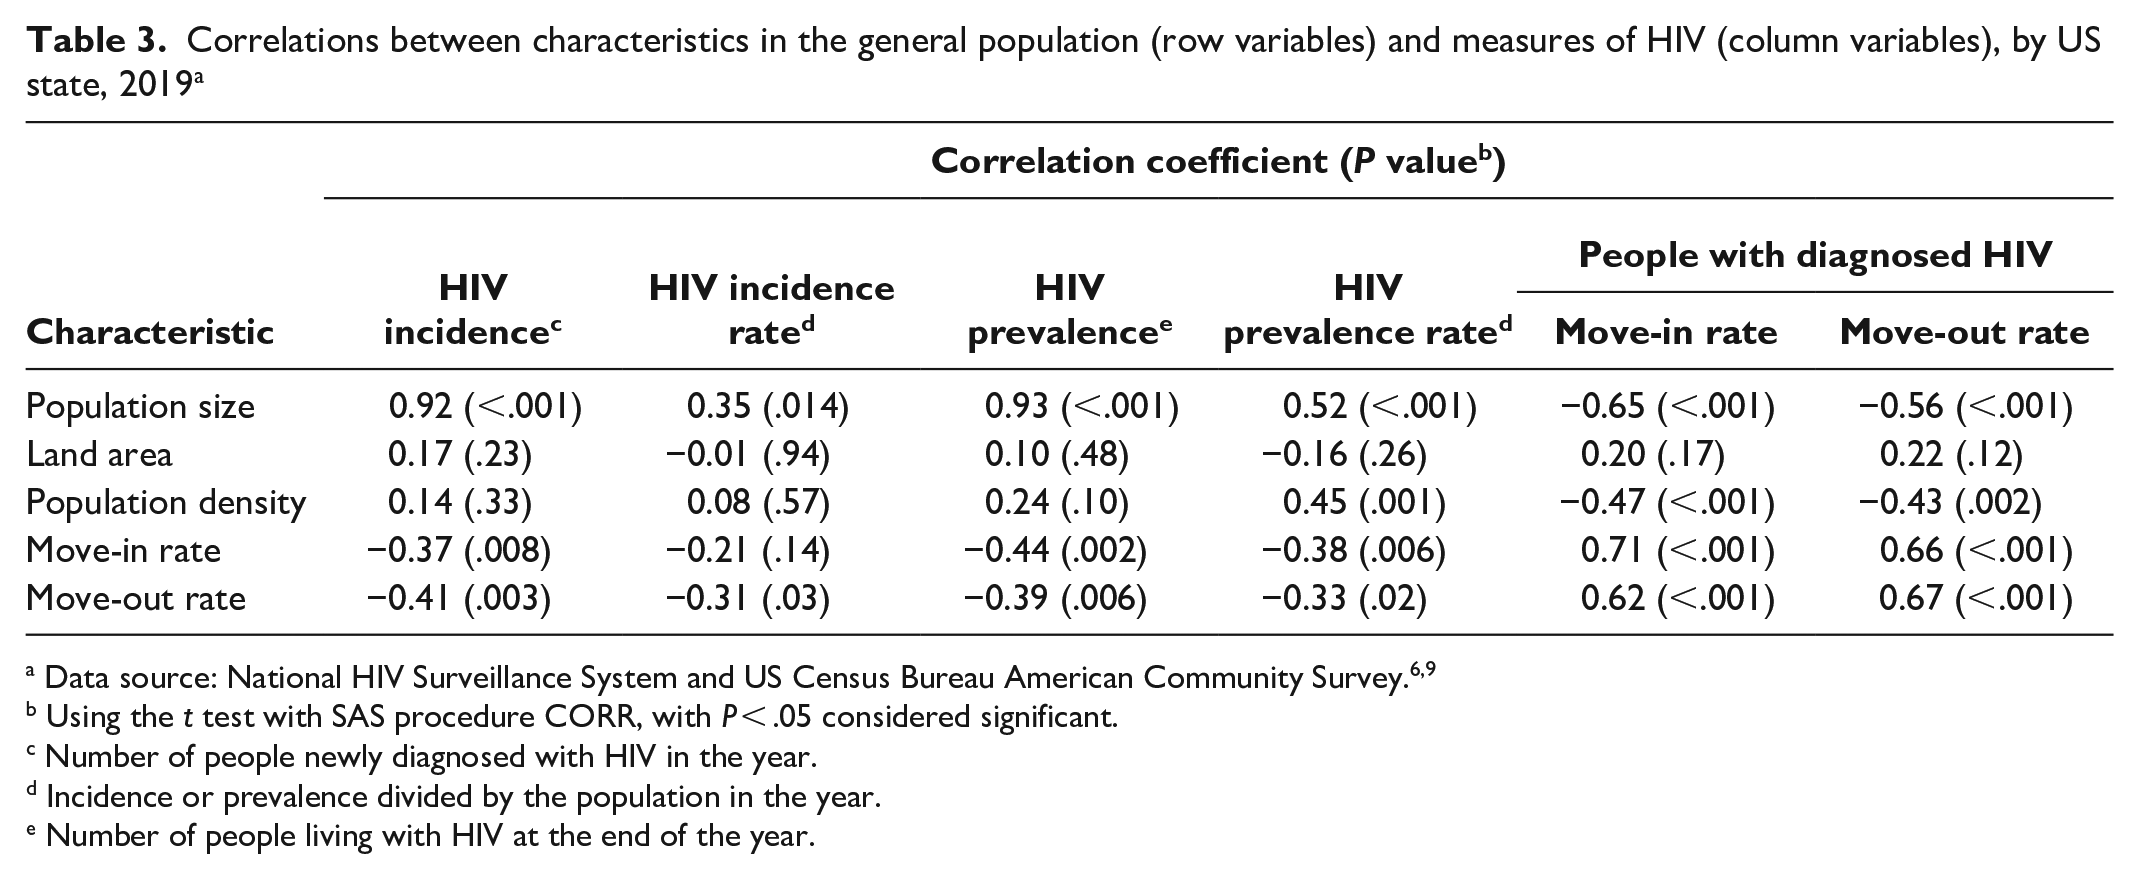
Using the t test with SAS procedure CORR, with P < .05 considered significant.
Number of people newly diagnosed with HIV in the year.
Incidence or prevalence divided by the population in the year.
Number of people living with HIV at the end of the year.
Overall, among people with diagnosed HIV in the United States, the rate of people who received 2 or more CD4 or viral load tests at least 3 months apart was higher among people who migrated between states in 2019 than among people who did not migrate between states in 2019 (64.2% and 57.6%, respectively) (Table 4). Moreover, the rate of received care (≥1 CD4 or viral load test) was higher among people with diagnosed HIV who migrated in 2019 than among people who did not migrate in 2019 (90.3% and 75.5%, respectively). Among people with diagnosed HIV, achievement of viral suppression was higher among people who had migrated (72.1%) than among those who did not migrate (65.3%) (Table 4). We found similar trends when people with diagnosed HIV were stratified by assigned sex at birth, race and ethnicity, age, and transmission category.
Rate of received HIV care and attained viral suppression by state-to-state migration status among people living with diagnosed HIV, United States, 2019 a
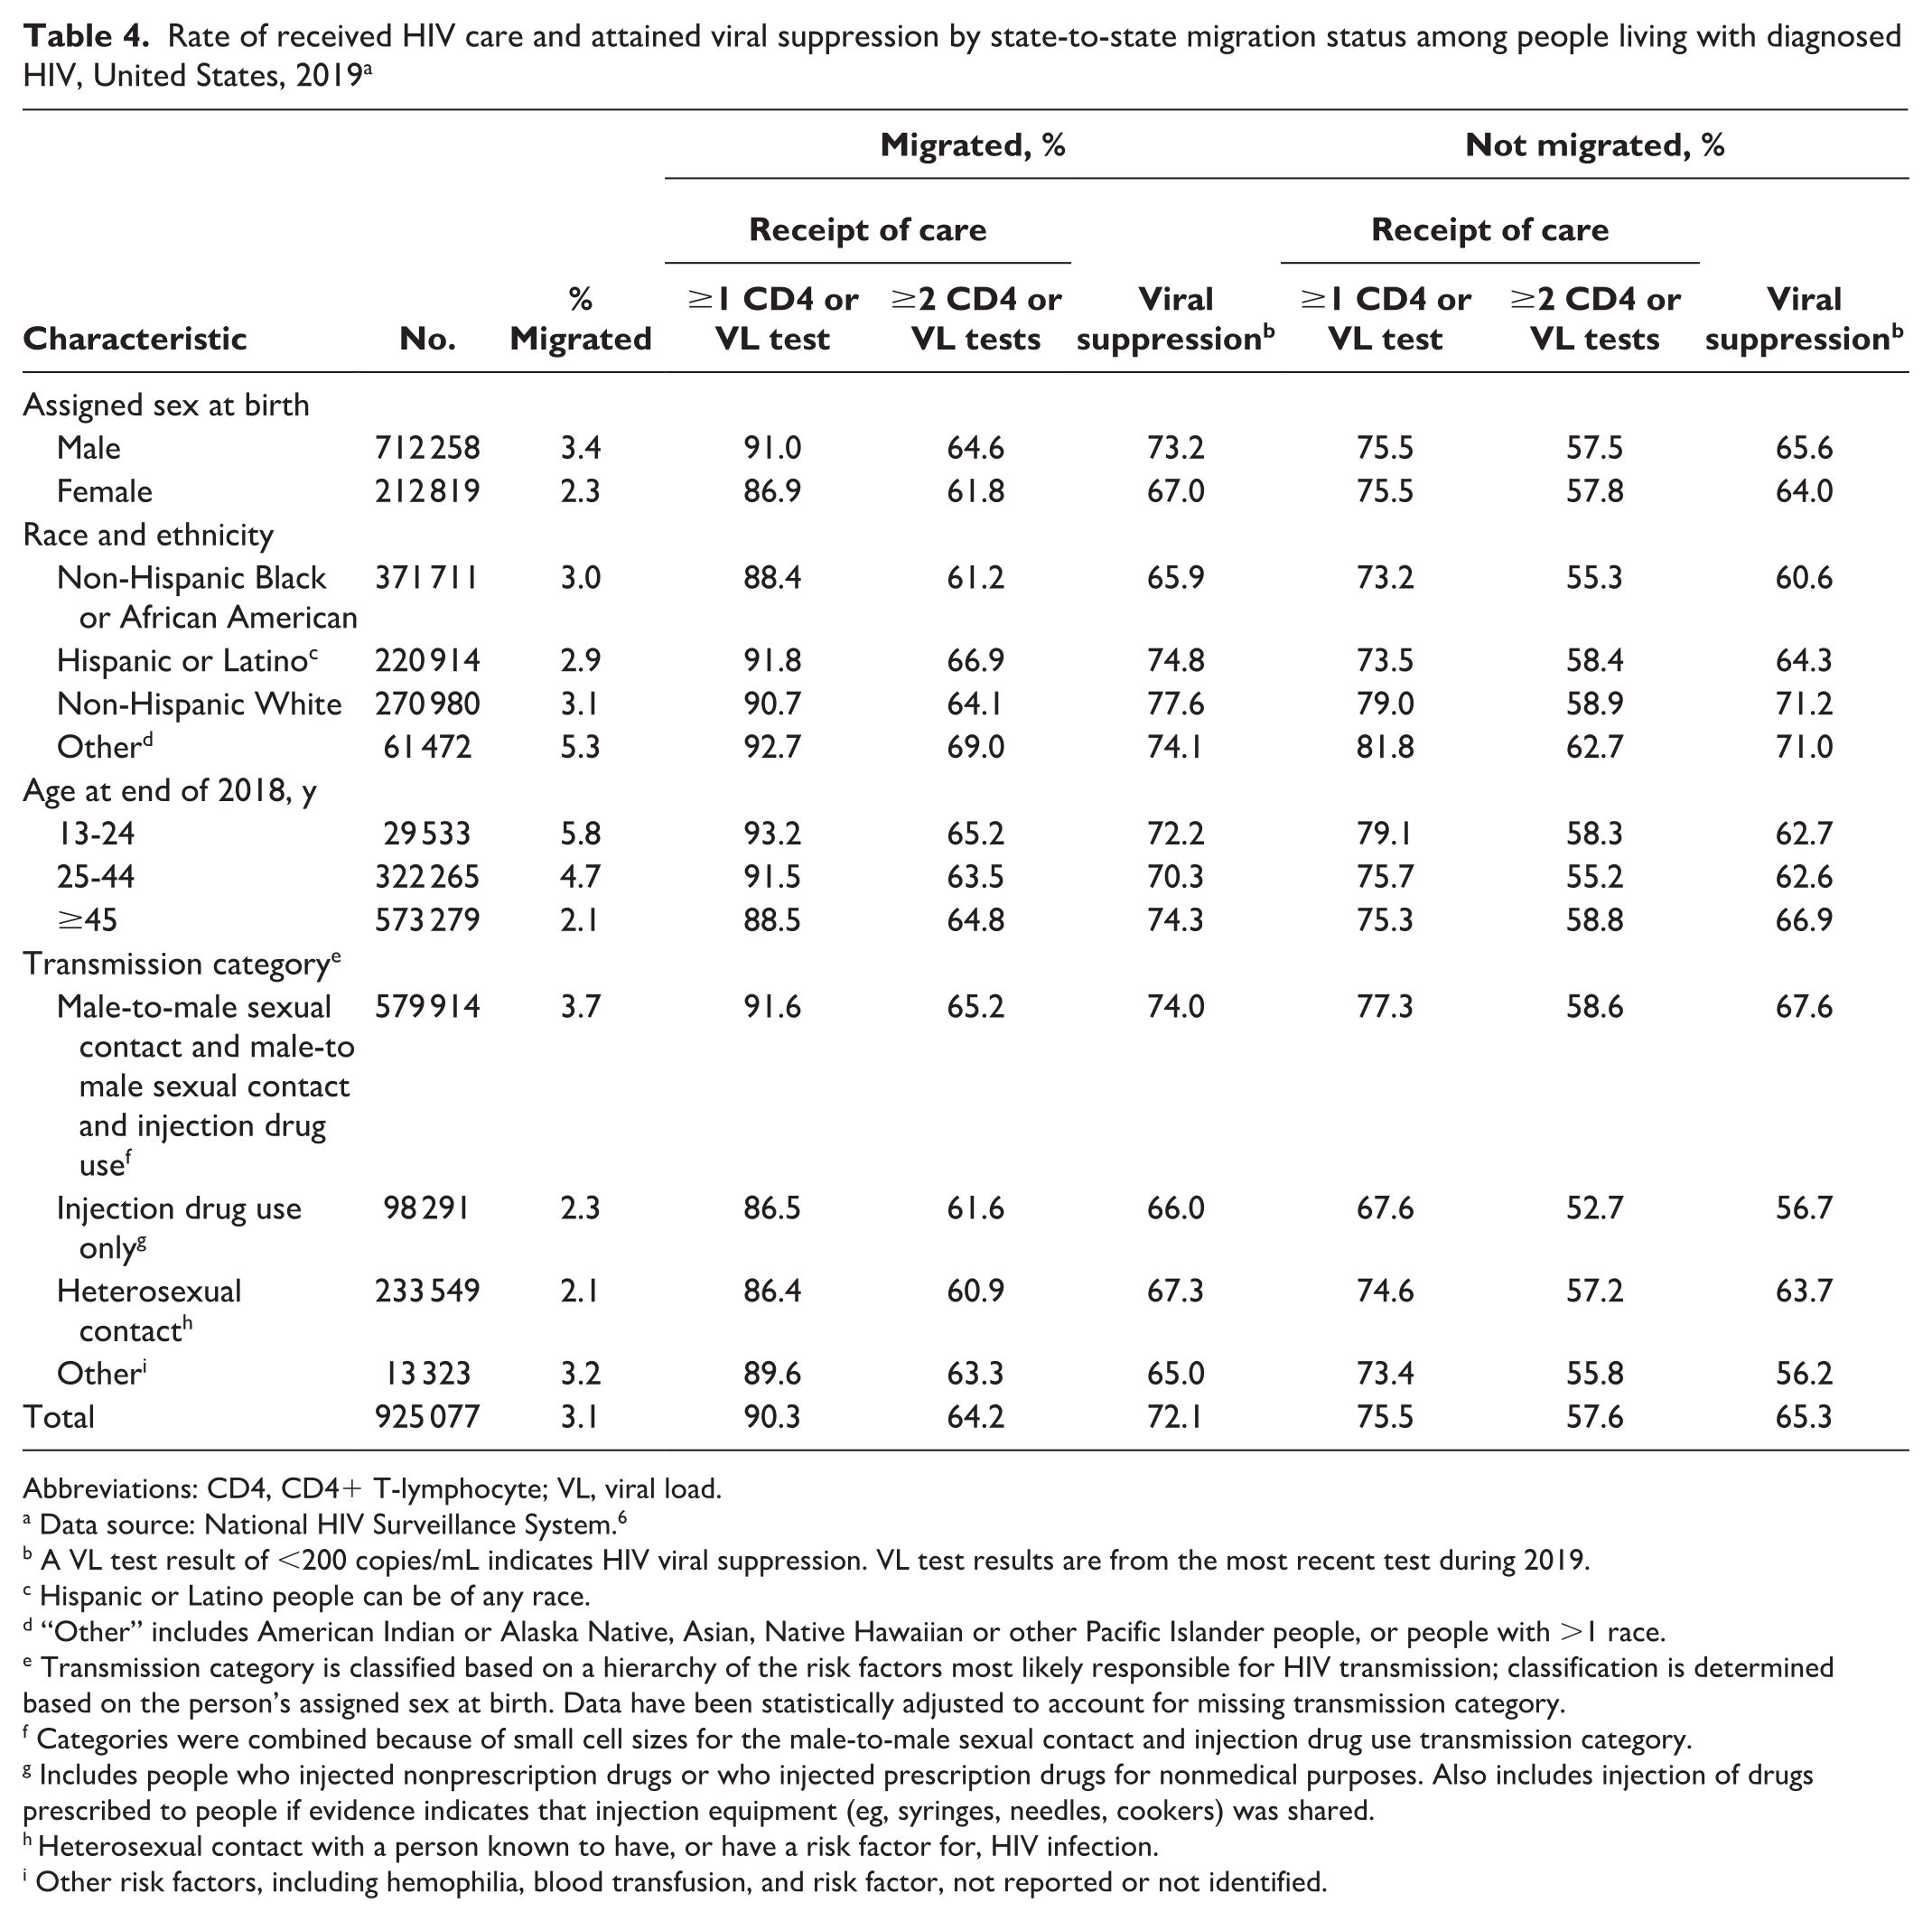
Abbreviations: CD4, CD4+ T-lymphocyte; VL, viral load.
Data source: National HIV Surveillance System. 6
A VL test result of <200 copies/mL indicates HIV viral suppression. VL test results are from the most recent test during 2019.
Hispanic or Latino people can be of any race.
“Other” includes American Indian or Alaska Native, Asian, Native Hawaiian or other Pacific Islander people, or people with >1 race.
Transmission category is classified based on a hierarchy of the risk factors most likely responsible for HIV transmission; classification is determined based on the person’s assigned sex at birth. Data have been statistically adjusted to account for missing transmission category.
Categories were combined because of small cell sizes for the male-to-male sexual contact and injection drug use transmission category.
Includes people who injected nonprescription drugs or who injected prescription drugs for nonmedical purposes. Also includes injection of drugs prescribed to people if evidence indicates that injection equipment (eg, syringes, needles, cookers) was shared.
Heterosexual contact with a person known to have, or have a risk factor for, HIV infection.
Other risk factors, including hemophilia, blood transfusion, and risk factor, not reported or not identified.
Discussion
Our study showed that, among people with diagnosed HIV, rates of received HIV care and achievement of viral suppression were higher among people who migrated in 2019 than among people who did not migrate in 2019, suggesting that accessing HIV medical care could be a reason for migration. The urbanicity or rurality in which a person with diagnosed HIV is currently residing may affect mobility. 11 Among people with diagnosed HIV in the southern United States, people who moved from a nonurban area to an urban area cited a chief reason for relocation as better access to health care, whereas people who moved from an urban area to a rural area were more likely to cite illness and wanting to live near family. 11 Moreover, evidence suggests that people with HIV may migrate from less densely populated areas to more densely populated areas because of issues related to fear of stigma and confidentiality.11-16
Our study showed that state-to-state migration rates among people with HIV were elevated from 2014 through 2016. One factor that may have affected migration among people with diagnosed HIV is access to health insurance. In 2014, through the Affordable Care Act Medicaid expansion, approximately 115 000 people living with HIV were eligible for Medicaid health insurance; however, half were residing in states that were not expanding Medicaid. 17 The move-in RRs of people with diagnosed HIV compared with the general population were higher in 2014-2016 in states that expanded Medicaid in 2014 than in states that did not expand Medicaid. The expansion of Medicaid through the Affordable Care Act may have affected migration rates among people with diagnosed HIV seeking care.
Although we were unable to compare mobility across demographic groups in the general population, we were able to make such comparisons among people with diagnosed HIV. People of non-Hispanic Other race had the highest state-to-state migration rates. Migration among these racial and ethnic groups with diagnosed HIV is situated in a complex web of historical, social, cultural, economic, and health factors. 18 Understanding the effects of migration among various racial and ethnic groups and systemic barriers to economic justice, health equity, educational attainment, and personal safety requires a nuanced understanding of the reasons for migration. It points to the need to recognize the multiple reasons for migration and the diverse behavioral practices that arise in given settings. 19
Non-Hispanic Black or African American and Hispanic or Latino people with HIV had similar migration rates from 2011 through 2019; the gap between migration rates among people with diagnosed HIV who are non-Hispanic White versus non-Hispanic Black or African American and Hispanic or Latino has narrowed in recent years (eTable 1 in Supplemental Material). Previous evidence suggests that Black or African American people may have low migration rates because of socioeconomic barriers and barriers experienced in the housing market.11,20,21
Migration patterns in 2019 among people with diagnosed HIV also differed based on HIV transmission categories. IDU and illicit non–IDU have been associated with migration among people with HIV.5,11 People who inject drugs may be mobile because of legal problems or attendance at drug treatment programs.22,23 Our study showed that people with diagnosed HIV attributed to MMSC, including attributed to MMSC and IDU, had the highest percentage of move-in and move-out migration rates compared with people with HIV attributed to other transmission categories. High rates of migration among people with HIV attributed to MMSC and attributed to MMSC and IDU may reflect the overall migration patterns among men who have sex with men (MSM). MSM may have unique motivations for migration, such as finding a community that is accepting of a wide range of gender identities and sexual orientations. Latino and African American MSM in Los Angeles with positive perceptions of their place of residence were often living in areas that were open and accepting to gay, bisexual, and other MSM. 24 Latino MSM may relocate to the United States for reasons such as being able to freely express their sexual orientation.25-27 However, migration among MSM may be associated with HIV transmission. Migrant MSM from other countries may experience poverty and a loss of social connectedness, which may result in engagement in high-risk sexual behaviors. 25
State-to-state migration may affect access to HIV care services. In King County, Washington, the rate of people with HIV identified as not currently in care was overestimated because of move-out migration, with a 19% overestimation of people living with HIV in King County and a 69% overestimation of people not in care. 28 State-to-state migration among people with HIV may result in surveillance programs overestimating the number of people with HIV in an area and underestimating the percentage of people receiving HIV medical care. 28 A high level of access to HIV care was associated with a high percentage of viral suppression in King County and elsewhere.28-31 Our study showed that people with diagnosed HIV who migrated had accessed HIV medical care and achieved viral suppression at a higher rate than people who did not migrate. In addition, people with HIV infection attributed to MMSC or attributed to MMSC and IDU were the most engaged in HIV care in 2019 compared with people with HIV infection attributed to other transmission categories.
Limitations
Our study had several limitations. First, we had no state-to-state migration data for the general population by demographic characteristics because such data are not available. Not having access to these data made it difficult to assess differences in migration by demographic group between people with diagnosed HIV and the general population. Second, ACS and NHSS data include migration information for people of all ages, including adolescents and children who may be at an age at which they may not have a choice in moving (ie, children who must move with a parent or guardian). As such, assessing reasons for motivation for migration (eg, seeking better medical care) would not be appropriately represented for people who did not have a choice in their mobility.
Third, we did not include cross-county migration rates among people with diagnosed HIV because the corresponding ACS data tables on the general population were not available. Assessing inter-county migration may be important in examining potential differences in HIV transmission, prevention, engagement in care, and viral suppression among subpopulations. Fourth, NHSS data may not have captured addresses of all people with diagnosed HIV who migrated, which can affect the accuracy of migration estimates among people with HIV. Fifth, our findings may have overestimated engagement in care and achievement of viral suppression among people with HIV who migrated compared with those with no migration information, because NHSS may have more complete information, including current residence, on people with HIV who were engaged in care than on people with HIV who were not engaged in care (eg, vital status, recent care visits).
Conclusions
To our knowledge, our study is the first national-level analysis to ascertain and compare state-to-state migration rates among people with diagnosed HIV versus the general population, using NHSS data and residential information that is explicitly assessed twice yearly for all people with diagnosed HIV. We found that people with diagnosed HIV are more mobile than the general population. Understanding the mobility of people with diagnosed HIV can help with accurate estimation of HIV incidence and prevalence. Assessing the migration patterns of people with diagnosed HIV is also of public health importance to assist state and local public health departments to determine where to focus HIV prevention and care resources to reduce disparities in access to important HIV prevention and care services.
Supplemental Material
sj-docx-1-phr-10.1177_00333549231208488 – Supplemental material for Interstate Mobility of People With Diagnosed HIV in the United States, 2011-2019
Supplemental material, sj-docx-1-phr-10.1177_00333549231208488 for Interstate Mobility of People With Diagnosed HIV in the United States, 2011-2019 by Amanda Okello, Ruiguang Song, H. Irene Hall, André Dailey and Anna Satcher Johnson in Public Health Reports
Footnotes
Acknowledgements
Amanda Okello and Ruiguang Song contributed equally to this work. The authors acknowledge the contributions of the state and territorial health departments and HIV surveillance programs that provided surveillance data to CDC. The authors thank CDC colleagues for their review of and feedback on this article.
Disclaimer
The findings and conclusions in this article are those of the authors and do not necessarily represent the official position of the Centers for Disease Control and Prevention (CDC).
Declaration of Conflicting Interests
The authors declared no potential conflicts of interest with respect to the research, authorship, and/or publication of this article.
Funding
The authors received no financial support for the research, authorship, and/or publication of this article.
Supplemental Material
Supplemental material for this article is available online. The authors have provided these supplemental materials to give readers additional information about their work. These materials have not been edited or formatted by Public Health Reports’s scientific editors and, thus, may not conform to the guidelines of the AMA Manual of Style, 11th Edition.
References
Supplementary Material
Please find the following supplemental material available below.
For Open Access articles published under a Creative Commons License, all supplemental material carries the same license as the article it is associated with.
For non-Open Access articles published, all supplemental material carries a non-exclusive license, and permission requests for re-use of supplemental material or any part of supplemental material shall be sent directly to the copyright owner as specified in the copyright notice associated with the article.