
Abstract
Objectives:
Prevention methods for carbon monoxide (CO) poisoning in Wisconsin address occupational and nonoccupational exposures together, but differences between the settings could inform new approaches to preventing occupational CO poisonings. We described occupational CO poisonings in Wisconsin from July 1, 2018, through July 1, 2021, using surveillance data from the Wisconsin Electronic Disease Surveillance System and Wisconsin Poison Center.
Methods:
We identified cases of CO poisoning from the Wisconsin Electronic Disease Surveillance System and Wisconsin Poison Center. Occupational CO poisonings were records where “workplace” was recorded as the location of exposure. We excluded records classified as suspect/not a case, those missing laboratory results or information on exposure source/location, and intentional poisonings. We compared characteristics between occupational and nonoccupational settings using odds ratios (ORs), and we estimated crude incidence rates of occupational exposures by occupation.
Results:
We identified 614 cases of CO poisoning, of which 168 (27.4%) were occupational exposures. When compared with patients with nonoccupational exposures, patients with occupational exposures were more likely to be male (OR = 3.8; 95% CI, 2.4-6.1), Hispanic (OR = 2.4; 95% CI, 1.4-4.2), and younger (mean difference [SD] = 6.6 [20.9]). Several CO sources were significantly associated with occupational poisonings: forklifts (OR = 58.4; 95% CI, 13.9-246.1; P < .001), pressure sprayers (OR = 2.4; 95% CI, 1.3-4.4; P = .003), and other gasoline-powered tools (OR = 3.8; 95% CI, 2.3-6.3; P < .001). The natural resources, construction, and maintenance occupation group had the highest crude incidence rate—45.0 poisonings per 100 000 full-time equivalent employees.
Conclusions:
Incorporating data from the Wisconsin Poison Center improved data quality, but surveillance is limited by underreporting. Creating strategies to increase reporting would allow for a more comprehensive understanding of occupational CO poisoning.
Carbon monoxide (CO) is a colorless, odorless gas that displaces oxygen from hemoglobin and causes CO poisoning. The risk of CO poisoning increases during winter months in northern states. 1 CO poisoning is the most frequent cause of fatality from any occupational inhalation exposure. 2 One study estimated that 23% of CO poisonings occurred at work. 3
Occupational Safety and Health Administration standards prohibit worker exposures to >50 parts per million (ppm) of CO in the atmosphere, averaged during an 8-hour period.4,5 This standard is more permissive than standards imposed by the National Institute for Occupational Safety and Health and the American Conference of Governmental Industrial Hygienists, which prohibit worker exposures to 35 ppm and 25 ppm, respectively.6,7 A growing body of evidence suggests that repeated exposures to low concentrations of CO can affect multiple organ systems and may cause long-term health effects.8 -10
CO poisoning is a nationally notifiable condition in the United States and has been a reportable condition in Wisconsin since 2018. Prevention methods in Wisconsin address occupational and nonoccupational exposures together, but differences between the settings could inform new approaches to preventing occupational CO poisonings. Surveillance data from the Wisconsin Electronic Disease Surveillance System (WEDSS) 11 and the Wisconsin Poison Center (WPC) 12 contain information on the source and setting of CO poisoning and are key to understanding differences by setting.
This cross-sectional analysis characterized Wisconsin CO poisonings by occupational and nonoccupational settings and identified factors associated with occupational exposures that could inform workplace safety measures. The objectives of this analysis were to describe occupational CO poisonings in Wisconsin by using surveillance data from WEDSS and WPC and to make recommendations for education and outreach efforts.
Methods
Data Sources
Wisconsin Electronic Disease Surveillance System
We obtained records in WEDSS created from July 1, 2018, through July 1, 2021, where the disease listed was “carbon monoxide poisoning.” WEDSS CO poisoning records are primarily sourced from laboratory results of blood carboxyhemoglobin (COHb) levels. Variables available from WEDSS included report date, patient’s first and last names, age, sex, race, ethnicity, exposure source, location of exposure, description of occupation, clinical treatment type, multiperson exposure (≥2 people), COHb level, and clinical outcome. We manually searched case notes for information about CO detectors using the words “detector,” “monitor,” and “alarm.” This analysis was reviewed in accordance with Wisconsin Department of Health Services policies concerning public health surveillance and research. The department determined that this analysis constituted a public health surveillance activity as defined in the 2018 Common Rule (45 CFR 46). As such, this project was not classified as human subjects research, and review by an institutional review board was not required.
Wisconsin Poison Center
We filtered WPC telephone call records by using the national case definition for case classification of administrative data established by the Council of State and Territorial Epidemiologists. 11 We obtained records if the telephone call occurred from July 1, 2018, through July 1, 2021; the telephone call type was “exposure”; the substance was “carbon monoxide” (generic code 0106000); the medical outcome was “minor,” “moderate,” “major,” or “death”; and the telephone call notes had any mention of CO, CO exposure, or house fire. Fields collected in WPC records included report date, age, sex, clinical treatment type, location of exposure, and clinical outcome. We manually searched records for patient identifiers, COHb level, source of CO exposure, occupation description, multiperson exposure (≥2 people), and whether CO detectors were absent or present. For information about CO detectors, we conducted the search using the words “detector,” “monitor,” and “alarm.”
Deduplicating WEDSS and WPC Records
We matched WEDSS and WPC records in a 2-tiered system using patient identifiers, event dates, and test results. First, we matched WEDSS and WPC records with first name and report date. Second, we matched all unmatched records from WEDSS and WPC using report date and COHb level.
We consolidated variables among the subset of duplicate records. We counted medical outcomes (emergency room visits, hospitalizations, or deaths), clinical treatment types (endotracheal intubation, supplemental oxygen, or hyperbaric treatment), cigarette smoking (yes/no), and event type (multiperson [≥2] or single exposure) if documented in at least 1 record, either WEDSS or WPC. We considered the reason for exposure as “intentional” and the location of exposure as “workplace” if it was implicated in either record. For CO detector status and CO source, we used WEDSS data by default.
Exclusions and Variable Definitions
We classified all records as confirmed, probable, suspect, or not a case according to the Council of State and Territorial Epidemiologists’ laboratory-based case definition. 13 The council’s laboratory criteria define a confirmed case as a nonsmoker, a person aged <14 years with unknown smoking status, and COHb ≥5% or as a smoker, a person aged ≥14 years with unknown smoking status, and COHb >12%. Probable cases are defined as a smoker, a person aged ≥14 years with unknown smoking status, and COHb ≥9% and ≤12%. The council defines suspect cases as a nonsmoker, a person aged <14 years with unknown smoking status, and COHb ≥2.5% and <5% or as a smoker, a person aged ≥14 years with unknown smoking status, and COHb ≥7% and <9%. Records not meeting these criteria are defined as “not a case.”
We excluded records that were classified as suspect or not a case, intentional exposures, missing COHb levels, or missing information on CO source or location of CO exposure. We considered a case occupational if “workplace” was listed as the location of exposure or if notes indicated that the patient was working when exposed. The fall/winter season included cases with a report date during September–February, and the spring/summer season included cases with a report date during March–August. We classified free-text fields that contained occupation information into 2018 Standard Occupational Code (SOC) major groups using the National Institute for Occupational Safety and Health’s Industry and Occupation Computerized Coding System. 14 We then combined SOC major groups into 6 groups of high-level aggregation, according to the 2018 SOC user guide. 15 We excluded students, volunteers, and retirees from occupational incidence calculations because we did not have a denominator to calculate incidence rates for unpaid workers or retirees.
Analytic Methods
We selected case characteristics for analysis a priori, and we calculated descriptive statistics for the analytic population. We used the Pearson χ 2 test to compare race, ethnicity, sex, medical treatment, and smoking status of the excluded group with the analytic population to test for selection bias. We summarized characteristics among occupational and nonoccupational settings and calculated odds ratios (ORs) and 95% CIs. We analyzed data for significant differences by using the Pearson χ 2 test. We used the Fisher exact test to calculate P values for contingency tables for cells with <5 observations, and we used the Haldane–Anscombe correction to calculate the OR when a contingency table contained a zero value. 16 We calculated SDs for mean age and COHb levels for occupational and nonoccupational poisonings by using 2-sample t tests. We considered P < .05 to be significant
We calculated crude incidence rates of CO poisoning by occupation group using 5-year (2016-2020) American Community Survey data.17,18 We adjusted workforce size for full-time equivalent employment and included adults aged 18-64 years who were employed in Wisconsin during 2016-2020, using the technique described by Pray et al. 19 We calculated incidence rates, 95% CIs, and SDs from case totals for each aggregated SOC category (numerator) and American Community Survey data (denominator). We performed all analyses using SAS version 9.4 (SAS Institute Inc).
Results
Analytic Sample After Deduplication and Exclusion Criteria
We obtained 2806 records from WEDSS and 312 records from WPC. Among the WPC records, 85 were matched to WEDSS records according to first name and report date, and an additional 68 records were matched according to report date and COHb level, for a total of 153 matching records. The combined dataset contained 2965 records before exclusion criteria were applied (Figure).
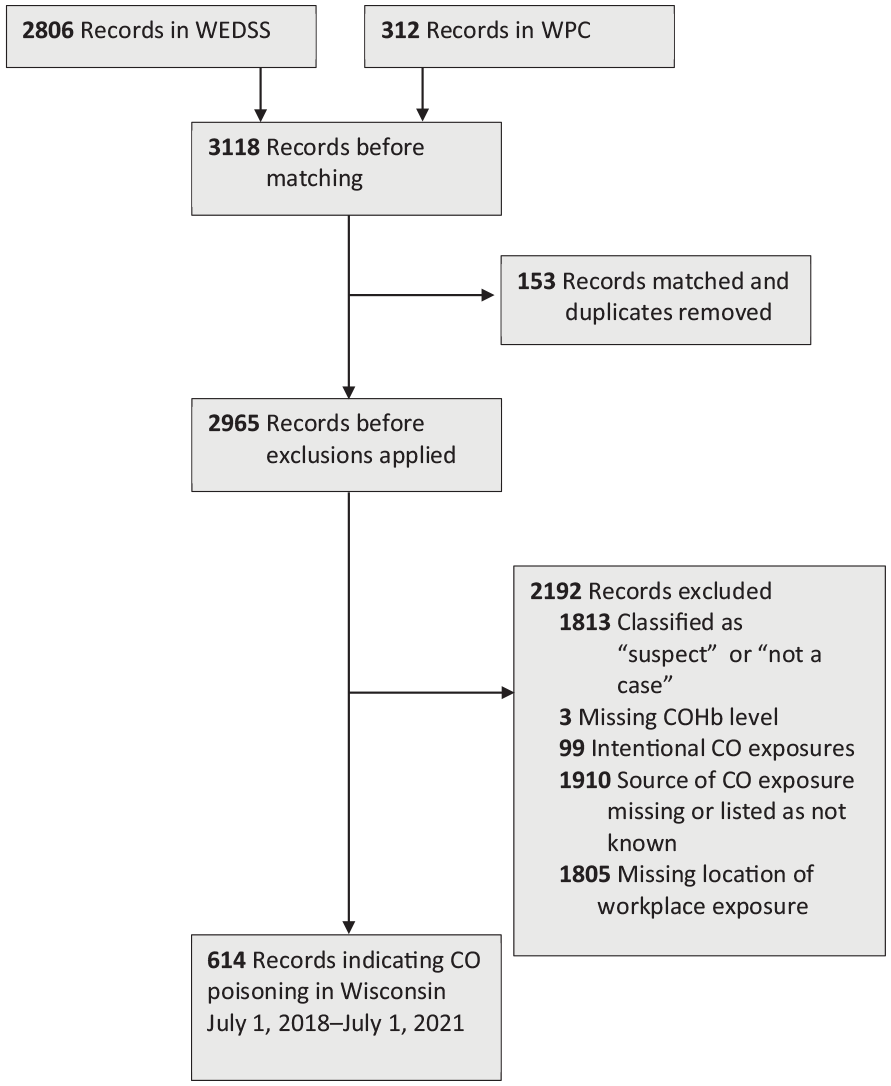
Case identification and exclusion flowchart for cases of carbon monoxide (CO) poisoning in Wisconsin, July 1, 2018, through July 1, 2021. The sum of excluded records is >2192 because records could be excluded for multiple reasons. Data source: Wisconsin Electronic Disease Surveillance System 9 and Wisconsin Poison Center. 10
Of the 153 matching records, WPC provided intubation and hyperbaric treatment data for 64 (41.8%) records and supplemental oxygen treatment data for 62 (40.5%) records. WPC also provided the location of exposure for 44 (28.8%) matching records and the source of exposure for 24 (15.6%) matching records.
A total of 614 of 2965 (20.7%) records met the inclusion criteria for this analysis. Some of the excluded records met multiple exclusion criteria: 1805 (60.9%) were missing the location of exposure (occupational vs nonoccupational), 99 (3.3%) were intentional exposures, 1910 (64.4%) were missing the source of CO exposure, and 1816 (61.2%) were classified as “not a case” or “suspect” or were missing COHb levels.
Cases among Black patients were significantly more likely than cases among White patients to be excluded from analysis because of missing information for location and source of CO exposure (OR = 2.7; 95% CI, 1.4-3.6; P < .001). No other characteristics were significantly associated with exclusion.
Characteristics of Cases in the Analytic Sample
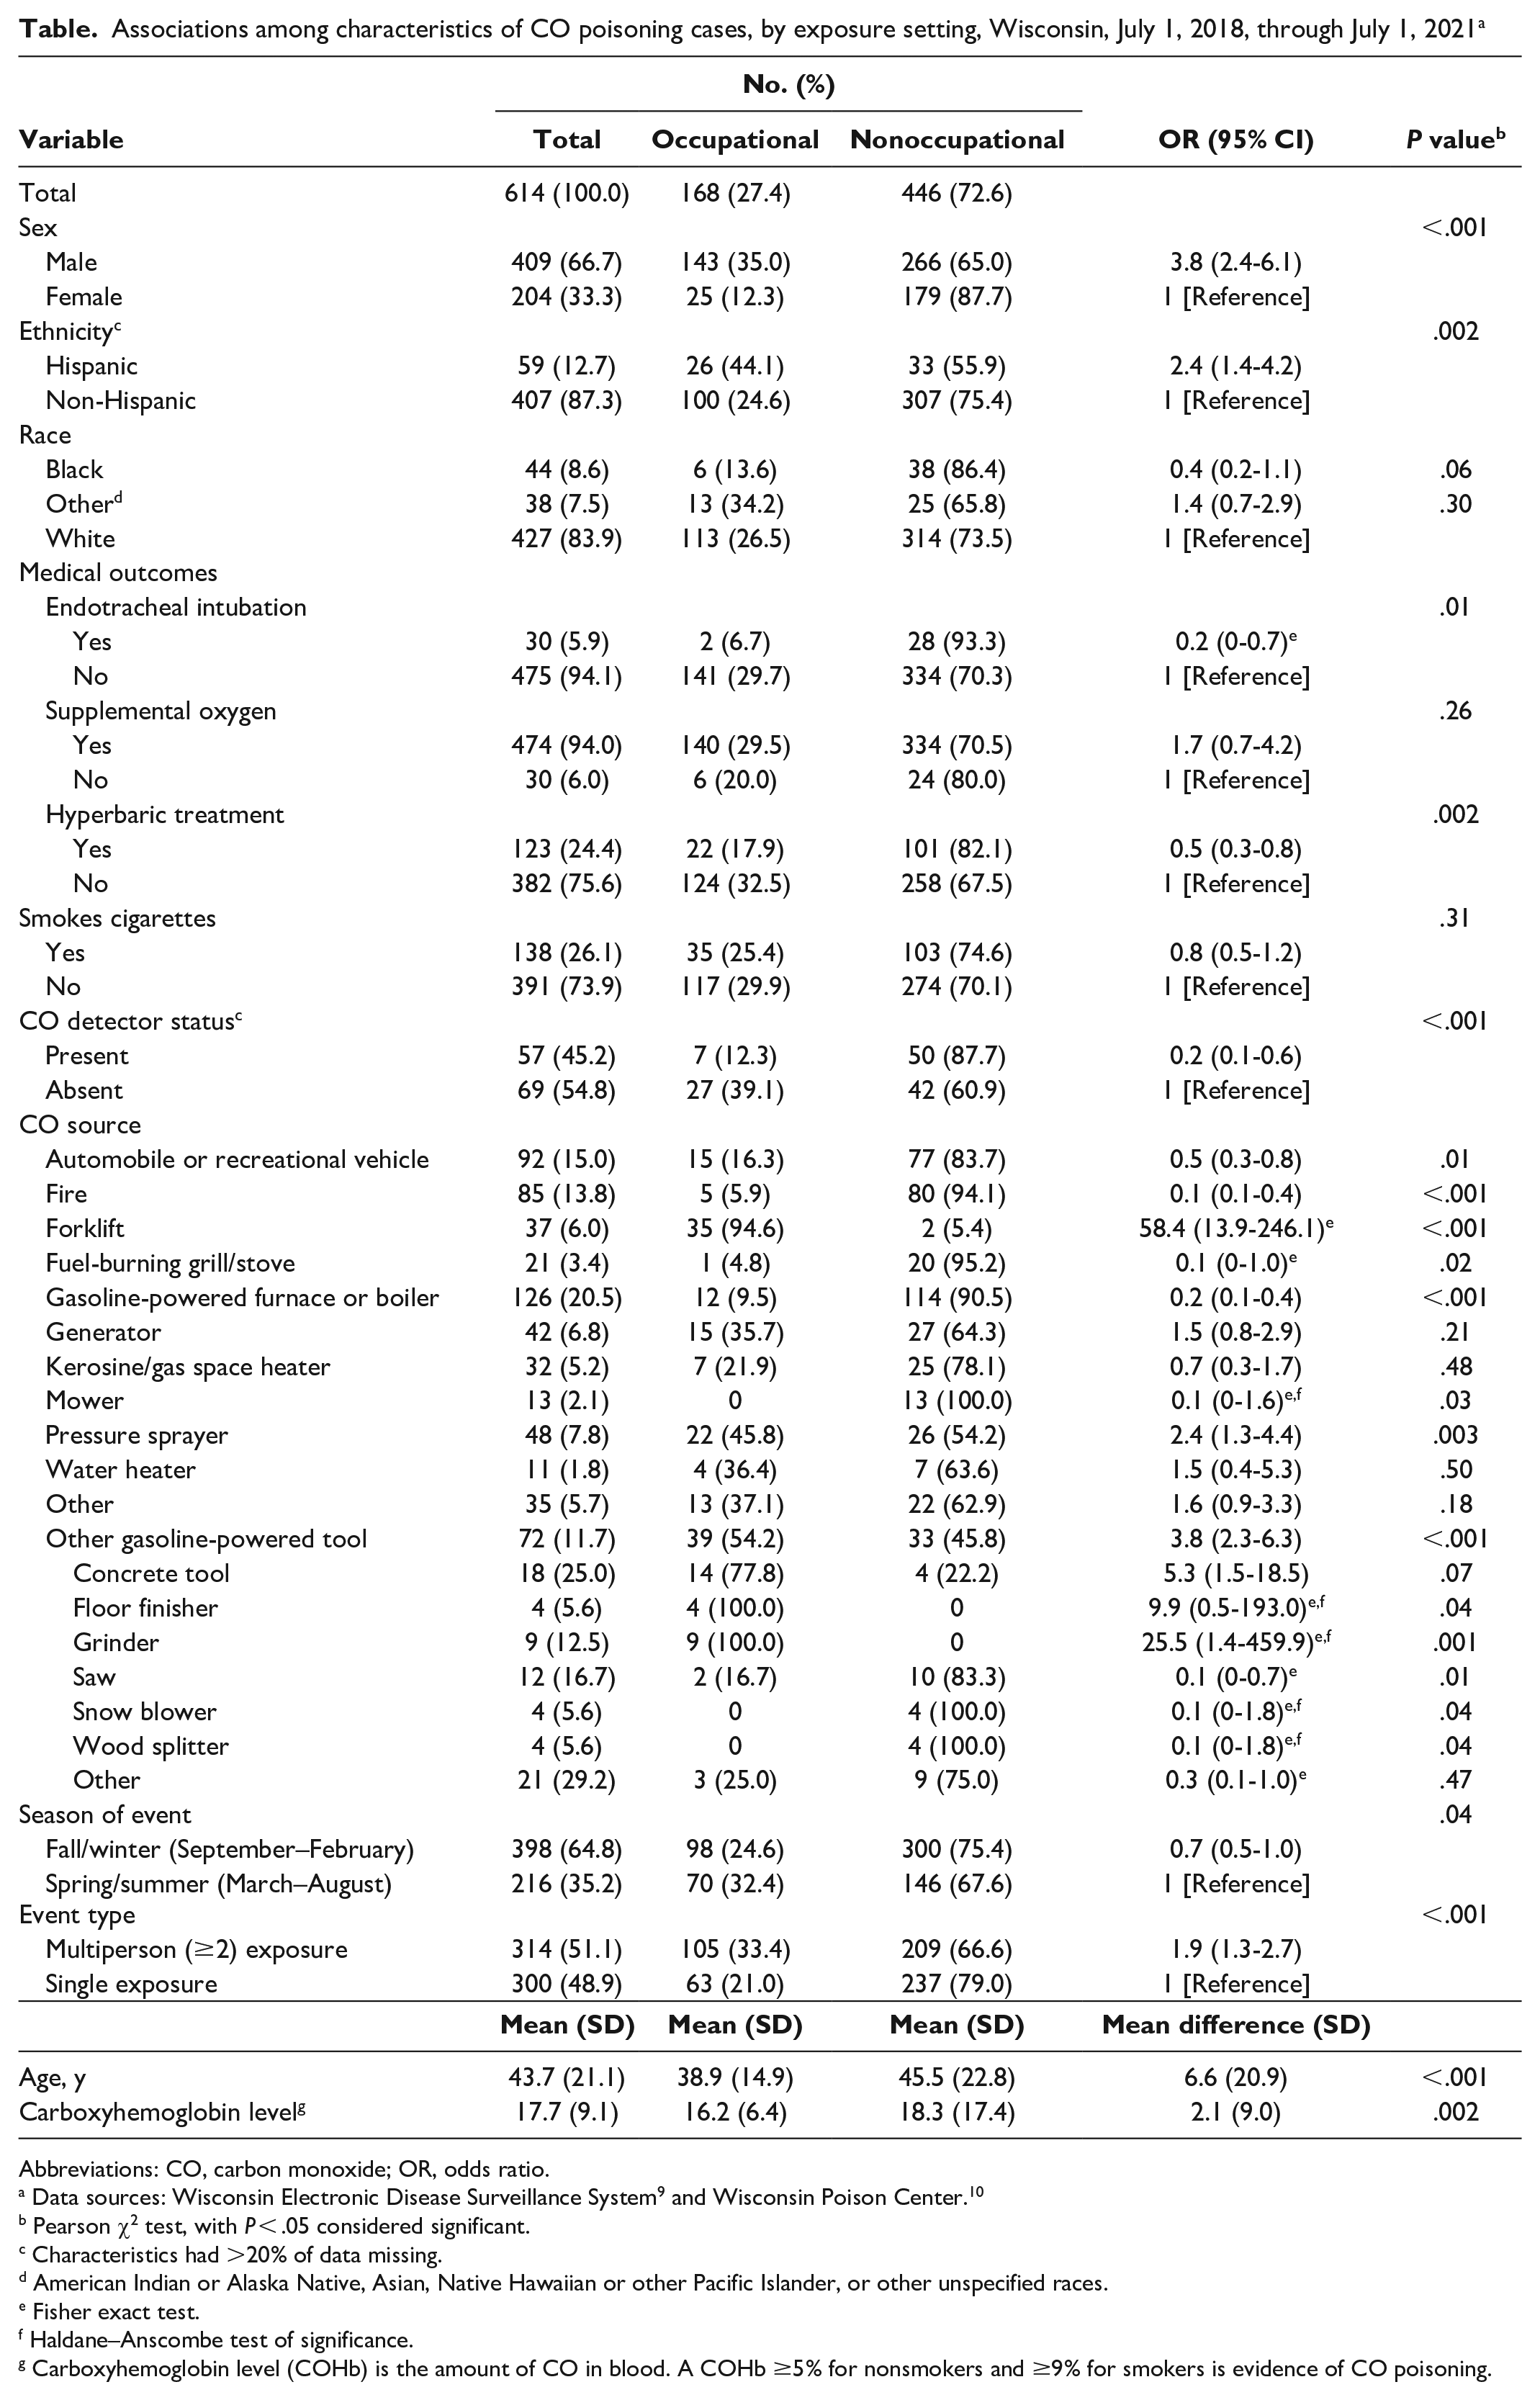
Of the 614 patients in the analytic sample, most were male (409 of 613; 66.7%), non-Hispanic (407 of 466; 87.3%), and White (427 of 509; 83.9%), and the mean age was 43.7 years (Table). More than one-quarter of patients (138 of 529; 26.1%) were current smokers, and 51.1% (314 of 614) were a part of multiperson incidents. For clinical treatments, 5.9% (30 of 505) of patients were endotracheally intubated, 94.0% (474 of 504) received supplemental oxygen, and 24.4% (123 of 505) received hyperbaric treatment. Patients with fire-related CO exposures were 11.8 (95% CI, 5.4-25.8) times more likely than patients with non–fire-related exposures to be intubated (P < .001).
Associations among characteristics of CO poisoning cases, by exposure setting, Wisconsin, July 1, 2018, through July 1, 2021 a
Abbreviations: CO, carbon monoxide; OR, odds ratio.
Pearson χ2 test, with P < .05 considered significant.
Characteristics had >20% of data missing.
American Indian or Alaska Native, Asian, Native Hawaiian or other Pacific Islander, or other unspecified races.
Fisher exact test.
Haldane–Anscombe test of significance.
Carboxyhemoglobin level (COHb) is the amount of CO in blood. A COHb ≥5% for nonsmokers and ≥9% for smokers is evidence of CO poisoning.
Of the 614 CO exposures in the analytic sample, gasoline-powered furnaces or boilers were the most common source of CO poisoning (n = 126, 20.5%), followed by automobile or recreational vehicle (RV) sources (n = 92, 15.0%) and fires (n = 85, 13.8%). Gasoline-powered tools accounted for 11.7% (n = 72) of poisonings, with tools used for concrete work comprising 25.0% (n = 18) of all gasoline-powered tool–related exposures. Information about the presence or absence of CO detectors was missing from 79.5% (n = 488) of all records. Detectors were noted to be absent in 54.8% (n = 69) of cases when information was available.
CO poisoning cases occurred most often during the fall/winter season (64.8%, n = 398) (Table), with the greatest number occurring during January and February. Sources of CO exposure were significantly associated with season. Sources significantly associated with the spring/summer season, as compared with all other CO sources, were forklifts (OR = 4.8; 95% CI, 2.3-10.0; P < .001), gasoline-powered tools (OR = 2.1; 95% CI, 1.3-3.5; P = .002), and pressure sprayers (OR = 2.1; 95% CI, 1.2-3.9; P = .01). Sources associated with the fall/winter season included gas-powered furnaces or boilers (OR = 3.6; 95% CI, 2.1-5.9; P < .001) and kerosene or gas space heaters (OR = 5.6; 95% CI, 1.6-18.5; P = .002). Automobiles or RVs, fuel-burning stoves or grills, generators, mowers, and fires were not associated with season.
Characteristics of Cases by Exposure Setting
A total of 168 cases (27.4%) were related to occupational CO exposures and 446 (72.6%) were related to nonoccupational exposures (Table). Patients with occupational exposures were 3.8 (95% CI, 2.4-6.1; P < .001) times more likely to be male and 2.4 (95% CI, 1.4-4.2; P = .002) times more likely to be Hispanic and were on average 6.6 years younger (P < .001) than patients with nonoccupational exposures. For clinical treatment, occupational CO exposures were less likely than nonoccupational CO exposures to lead to endotracheal intubation (OR = 0.2; 95% CI, 0-0.7; P = .01) and hyperbaric treatment (OR = 0.5; 95% CI, 0.3-0.8; P = .002). Mean COHb levels of occupational poisonings were significantly lower than nonoccupational poisonings by 2.1 percentage points (95% CI, 0.8-3.4; P = .002). We found no significant difference between occupational and nonoccupational exposures in the likelihood of receiving supplemental oxygen.
Occupational exposures were significantly more likely than nonoccupational exposures to be multiperson incidents (OR = 1.9; 95% CI, 1.3-2.7; P < .001) and significantly less likely to occur in the fall/winter (OR = 0.7; 95% CI, 0.5-1.0; P = .04). Among records with CO detector data available, functioning CO detectors were significantly less likely to be present during occupational exposures than during nonoccupational exposures (OR = 0.2; 95% CI, 0.1-0.6; P = .001).
Sources of CO differed between occupational and nonoccupational poisonings. Forklifts were significantly more likely to be associated with occupational poisonings than with nonoccupational poisonings (OR = 58.4; 95% CI, 13.9-246.1; P < .001). Other sources of CO poisoning significantly associated with occupational setting included pressure sprayers (OR = 2.4; 95% CI, 1.3-4.4; P = .003) and other gasoline-powered tools (OR = 3.8; 95% CI, 2.3-6.3; P < .001). Automobiles or RVs (OR = 0.5; 95% CI, 0.3-0.8; P = .01), fires (OR = 0.1; 95% CI, 0.1-0.4; P < .001), fuel-burning grills or stoves (OR = 0.1; 95% CI, 0-1.0; P = .02), and gasoline-powered furnaces or boilers (OR = 0.2; 95% CI, 0.1-0.4; P < .001) were significantly less likely to be associated with occupational poisonings than with nonoccupational poisonings.
Among the 72 cases with gasoline-powered tools as the source of CO, tools used for concrete work (OR = 5.3; 95% CI, 1.5-18.5; P = .01) and grinders (OR = 25.5; 95% CI, 1.4-459.9; P = .001) were significantly more likely, and saws (OR = 0.1; 95% CI, 0.0-0.7; P = .01) were significantly less likely, to be associated with occupational poisonings than with nonoccupational poisonings.
CO Poisoning Rates by Occupation Group
Occupation was available for 115 of 168 (68.5%) work-related cases. The aggregated SOC major group with the highest rate per 100 000 full-time equivalents of occupational CO poisoning was natural resources, construction, and maintenance occupations (45.0 poisonings), followed by production, transportation, and material moving occupations (19.8 poisonings).
Discussion
We found that 27.4% of the CO poisoning cases in this analysis were work-related, suggesting that >1 in 4 CO poisonings in Wisconsin were attributed to an occupational exposure during 2018-2021. CO poisonings are likely underrepresented in surveillance data. We queried workers’ compensation records in Wisconsin during the same analytic period and found only 15 records in which CO was responsible for injury, as compared with the 168 occupation-related cases recorded in WEDSS and WPC.
We found that patients with occupational CO poisoning were more likely than patients with nonoccupational poisoning to be Hispanic and male. This finding may be a result of the high frequency of Hispanic men to be employed in jobs where a CO-emitting source is present, such as construction or production. 1 Although CO poisonings are more frequent during the fall/winter season than during the spring/summer season, our analysis also showed that occupational CO exposures were slightly more likely than nonoccupational CO exposures to occur during the spring/summer season. 3 Job activities that involve CO-emitting sources (eg, construction projects) may be more active during warmer months than during cooler months.
Examination of CO-emitting sources showed that occupational poisonings were associated with gasoline-powered equipment, including forklifts, concrete work tools, power grinders, and pressure sprayers. One in 5 occupational poisonings was due to forklifts. Forklift operation is a CO poisoning risk even in a relatively open indoor space, such as a warehouse. 20 Forklifts are well documented as dangerous sources of CO and should continue to be a high priority for employer and Occupational Safety and Health Administration inspections.21,22
In interview notes, many patients stated that they thought they had adequate ventilation (eg, open window, exhaust fan) while working before becoming poisoned. A 1993 National Institute for Occupational Safety and Health assessment of perceptions of CO poisoning demonstrated that 54% of respondents incorrectly believed that it was safe to operate a gasoline-powered engine indoors with windows open and an exhaust fan running. 23 While the accounts in our analysis generally showed awareness of CO, they demonstrated a lack of understanding of what constitutes a properly ventilated space. Misconceptions about the safe use of gasoline-powered equipment put workers at risk of CO poisoning.
CO detectors have been shown to be effective in reducing the odds and severity of CO poisoning by alerting people to leave the area, thereby shortening their exposure period. 24 Although data on CO detectors were limited in our analysis, results suggest that CO detectors are less likely to be present and functioning in occupational settings than in nonoccupational settings. While the Occupational Safety and Health Administration recommends that employers use CO detectors in areas where CO may be a hazard, no legal requirement exists to install detectors at workplaces or in public spaces in Wisconsin.
Occupational exposures were more likely than nonoccupational exposures to be multiperson events. If multiple people exhibit CO poisoning symptoms simultaneously, it may alert others to leave the area, which may help limit the length of exposure and mitigate severe symptoms.3,20,25,26 Alternatively, CO poisoning may be especially dangerous for people who work alone, because others are not present to help recognize and escape danger. Employees performing rigorous activities for their work are especially at risk of CO poisoning because CO absorption is proportionate to respiratory effort.24,27
Limitations
Our study had several limitations. First, WEDSS data have a high prevalence of false-positive cases (ie, cases with an elevated COHb result unrelated to an environmental exposure to CO). To avoid the inclusion of false-positive cases, we excluded all records in which source of CO exposure was listed as “not known” or was missing (1910 of 2965; 64.4%), which limited the sample size. Second, no standard field was used by investigators in WEDSS to differentiate missing information from an incomplete interview. Third, the fields “Was the patient hospitalized?” and “Did the patient die?” could not be analyzed because the answer “no” could not be distinguished from missing data. Fourth, occupation information was collected only for patients who indicated that their CO exposure happened while they were working, and job information was collected in open-text fields, which did not allow for standardized collection and coding of industry and occupation, as preferred. Fifth, neither WEDSS nor WPC includes standardized fields to collect data on whether a CO detector was present and/or sounding at the scene. Sixth, selection bias among races may have resulted in an artificially low prevalence of CO poisoning among Black patients in the analytic population.
Finally, the WPC database is an important source of data for characterizing CO poisoning and related occupational exposures. However, discrepancies exist between poison center data and data collected by government agencies, and these discrepancies have been noted in prior studies. 28 While poison centers can provide substantial assistance and education after occupational exposures, epidemiologic assessment is limited by underreporting. One study found that for each occupational case reported to the poison control center, an average of 12 exposed people per workplace were not reported. 29 Written workplace protocols in occupations that pose a high risk of CO poisoning that include reporting to the poison control center may be an effective strategy to increase reporting.
Conclusion
More than one-quarter of documented CO poisonings in Wisconsin during 2018-2021 occurred at work. Recognizing the differences between occupational and nonoccupational CO poisonings is the first step in developing effective prevention messaging tailored to each setting. Occupations that pose a high risk of CO poisoning included those in which forklifts and gasoline-powered tools were commonly used, especially construction, maintenance, and production occupations. Half of occupational poisonings involved ≥2 people. Common misconceptions occurred about the safety of using gasoline-powered equipment in enclosed or partially enclosed spaces. Education and prevention measures for occupational CO poisoning risks should be promoted year-round and include thorough instruction on effective ventilation. CO detectors should be used in workspaces that contain a CO-emitting source, especially when an employee is working alone. CO poisoning surveillance data are limited by underreporting, but combining data from WEDSS and WPC improved data quality. Improving surveillance data quality and completeness would allow for a more comprehensive picture of the work-related risks of CO poisoning.
Footnotes
Acknowledgements
The authors thank Kim Webber, MBA, BSN, BA, RN, NEA-BC, at the Wisconsin Poison Center for her prompt responses to data requests and the investigators at local public health departments and poison control centers for their vital role in data collection and health education.
Declaration of Conflicting Interests
The authors declared no potential conflicts of interest with respect to the research, authorship, and/or publication of this article.
Funding
The authors disclosed receipt of the following financial support for the research, authorship, and/or publication of this article: This work was funded by the Centers of Disease Control and Prevention, National Center for Environmental Health, Modernizing Environmental Public Health Tracking to Advance Environmental Health Surveillance in Wisconsin project grant no. NUE1EH001466.