
Abstract
Objectives:
Reports of unsafe school drinking water in the United States highlight the importance of ensuring school water is safe for consumption. Our objectives were to describe (1) results from our recent school drinking water sampling of 5 common contaminants, (2) school-level factors associated with exceedances of various water quality standards, and (3) recommendations.
Methods:
We collected and analyzed drinking water samples from at least 3 sources in 83 schools from a representative sample of California public schools from 2017 through 2022. We used multivariate logistic regression to examine school-level factors associated with lead in drinking water exceedances at the American Academy of Pediatrics (AAP) recommendation level (1 part per billion [ppb]) and state action-level exceedances of other contaminants (lead, copper, arsenic, nitrate, and hexavalent chromium).
Results:
No schools had state action-level violations for arsenic or nitrate; however, 4% had ≥1 tap that exceeded either the proposed 10 ppb action level for hexavalent chromium or the 1300 ppb action level for copper. Of first-draw lead samples, 4% of schools had ≥1 tap that exceeded the California action level of 15 ppb, 18% exceeded the US Food and Drug Administration (FDA) bottled water standard of 5 ppb, and 75% exceeded the AAP 1 ppb recommendation. After turning on the tap and flushing water for 45 seconds, 2%, 10%, and 33% of schools exceeded the same standards, respectively. We found no significant differences in demographic characteristics between schools with and without FDA or AAP exceedances.
Conclusions:
Enforcing stricter lead action levels (<5 ppb) will markedly increase remediation costs. Continued sampling, testing, and remediation efforts are necessary to ensure drinking water meets safety standards in US schools.
Promoting the consumption of safe drinking water in schools is critical to help children avoid the developmental and health consequences associated with consumption of contaminated water, underhydration, or excessive intake of sugary beverages, including added and naturally occurring sugars. 1 Despite improvements in school water access, reports of unsafe school drinking water in the United States highlight the importance of ensuring the water provided to students is safe to drink.2,3
Until the 2021 revisions to the US Environmental Protection Agency’s (EPA’s) Lead and Copper Rule, 4 most schools had no federal requirements to test drinking water for lead or copper. Prior state-initiated drinking water lead-testing programs documented geographic differences in the proportion of schools with ≥1 sample exceeding the state’s action level, ranging from 3% in California (15 parts per billion [ppb] threshold), to 85% in New York (15 ppb threshold), and 78% in Washington, DC (1 ppb threshold).5,6 Older school facilities and greater elapsed time since renovation or construction can influence lead levels in drinking water due to the presence of unsafe, outdated lead plumbing, notably in city schools. 7
The Safe Drinking Water Act regulates allowable levels of contaminants in water provided by public utilities. 8 Little is known about the prevalence of the most common contaminants, arsenic and nitrate, in water systems serving schools, 9 while hexavalent chromium is currently unregulated federally. 8
Testing school drinking water is critical to inform policies needed to minimize children’s exposure to the well-documented adverse health and economic effects of consuming contaminated water.10-18 Compared with the recent California one-time lead sampling program, which tested lead down to 5 ppb,19,20 our study is the first to examine the implications of the American Academy of Pediatrics (AAP) recommendation of 1 ppb in California schools, which serve 1 in 8 US children.15,21 As California considers the reimplementation of a stricter 10 ppb hexavalent chromium standard, 22 it is our understanding that this study is the first to estimate the number of public schools in the state whose water supplier potentially violates this standard. In addition, this study contributes to the limited existing literature on the potential scope of copper, nitrate, and arsenic contamination in US public school drinking water.
Although we based our initial hypotheses on data available during initial project conception, 23 we revised them as other studies were published after sampling began.6,24 We hypothesized that on the first draw, 15% of water sources in food service areas (FSAs) would have lead levels greater than the EPA and California state action lead level of 15 ppb, and 50% of schools would have lead levels greater than the AAP recommendation of 1 ppb. Given the well-documented geographic disparities in access to safe drinking water,23-30 we hypothesized a 10% difference in arsenic levels for rural schools compared with urban schools.
Methods
Setting and Participants
This study leveraged a representative sample of 240 public and charter schools previously used in funded studies by Robert Wood Johnson Foundation Healthy Eating Research (HER).23,31 Schools were stratified by geography (rural, town, suburban, city) and school type (elementary, middle/junior, high) and randomly selected from 10 481 California schools (Figure 1). Non–standard grade configurations such as special education, vocational, and alternative schools were excluded. The primary outcome of our study was to assess noncompliant drinking water systems. Adjusting for the size of the total population (10 000 public schools in California), the estimated sample design effect of 1.3, and the anticipated response rate of 80%, a sample size of 240 schools achieves >80% power at the 5% significance level to detect an absolute difference in proportions of 15% for likely moderate-prevalence outcomes and 10% for likely low-prevalence outcomes. Stanford University’s Institutional Review Board reviewed the study protocol and determined it to be exempt from the regulations stated in 45 CFR 46 or 21 CFR 56.
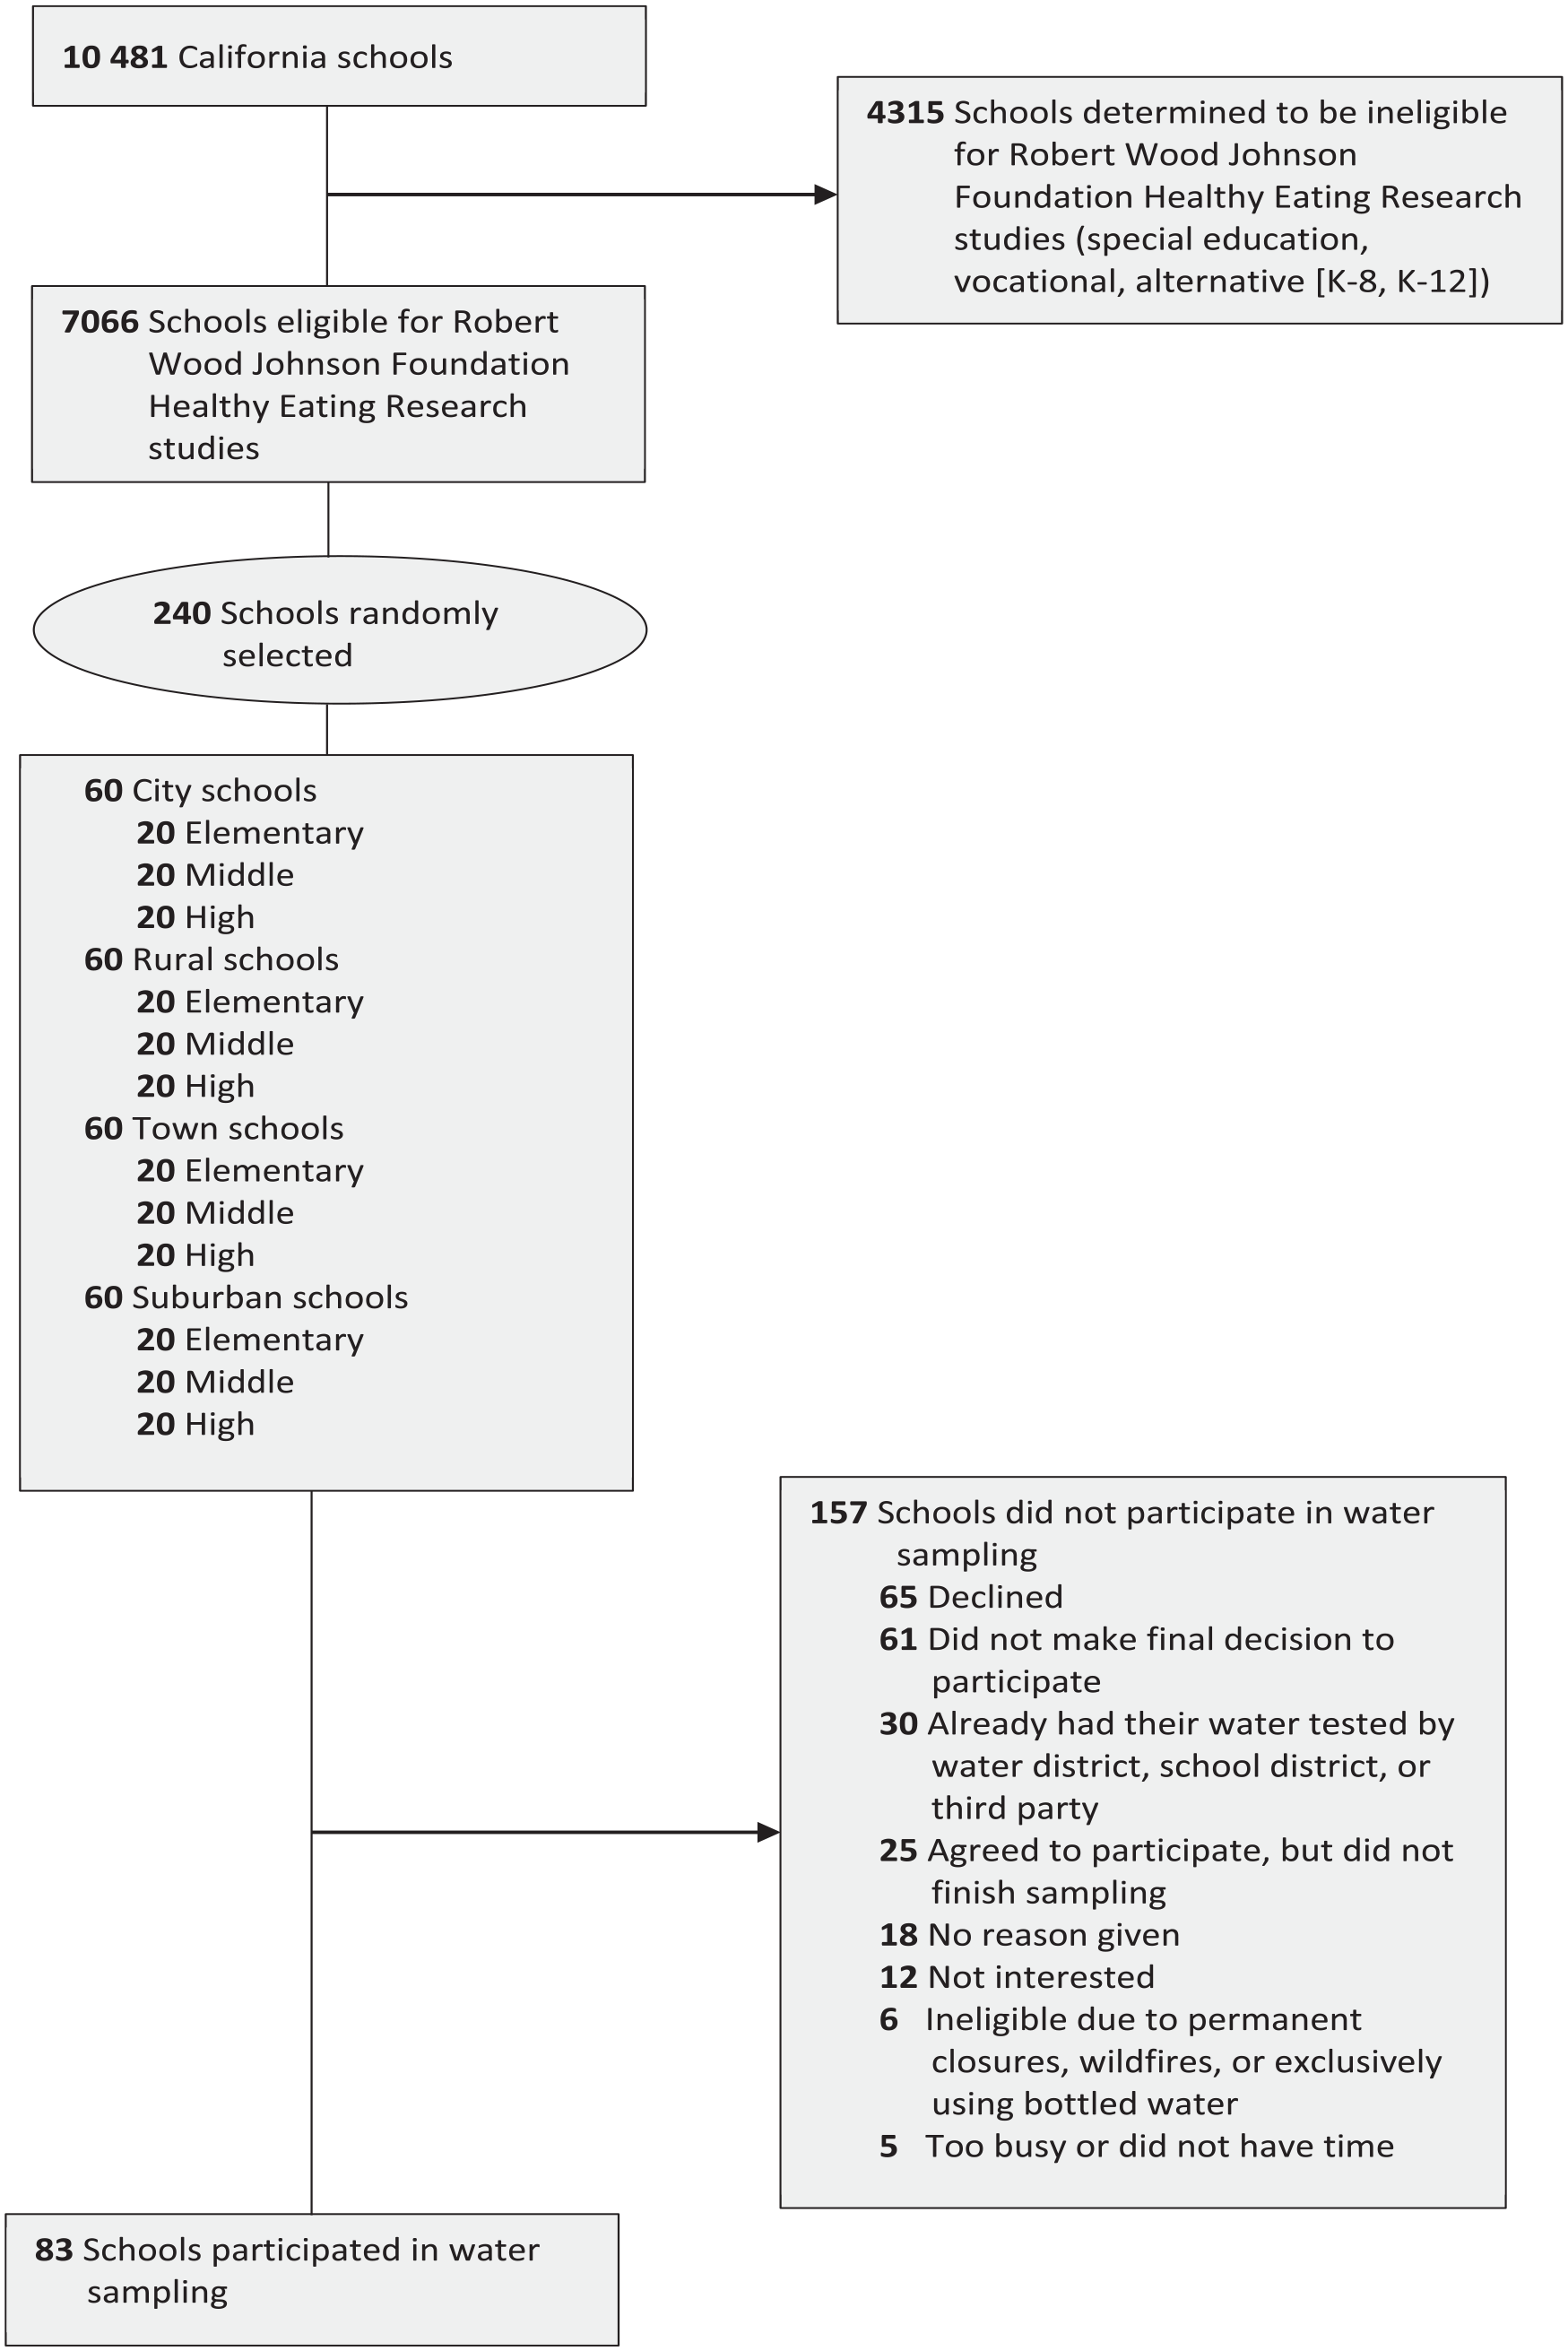
Sampling strategy in a study examining contaminants in drinking water in public schools in California, 2017-2022. Schools could indicate >1 reason for not participating.
Researchers at Stanford University contacted school administrators from the 240-school sample from February 2017 through March 2022. The recruitment and sampling process was disrupted by the onset of the COVID-19 pandemic in March 2020, which led to extended school closures. After obtaining consent from school administrators, researchers sent water-testing sampling kits from the Virginia Polytechnic Institute and State University (Virginia Tech) testing laboratory, along with an instructional video, developed by the testing team, for drawing samples. Each school collected a first-draw sample and second-draw sample from a minimum of 3 geographically unique drinking water sources (taps), which were directly labeled on the bottles. The most heavily used taps in and around FSAs and the most frequently used food preparation sink were prioritized given that federal and California laws require free potable drinking water in these areas. 32 If 3 FSA taps were unavailable, other high-traffic drinking water taps were sampled. Two draws were obtained to identify the origin of contaminant concentrations, whether from the tap itself or the larger plumbing system. Per EPA recommendations, the first-draw sample was taken after 6-8 hours of stagnation overnight, and the second-draw sample was taken after 45 seconds of opening the valves and letting the faucets run to remove standing water in the interior pipes and/or outlets. 33 A dedicated bottle with ammonium hydroxide preservative was used for the hexavalent chromium draw immediately after the second draw. 34 Researchers maintained communication with schools via telephone and email to ensure receipt of the sampling kit and provided technical support for sample collection and mailing. Participating study schools directly mailed the samples to Virginia Tech in preaddressed, prepaid boxes, where coauthors and their team at Virgina Tech analyzed samples by using EPA-approved protocols and methods. 35 Once the results were available, researchers notified the schools, marking the completion of their participation in the study.
Study Outcomes
The primary outcomes of the study were the levels of lead, copper, arsenic, nitrate, and hexavalent chromium in the tap water of each school, as determined from the first-draw and second-draw samples. The lowest detectable levels of contaminants by testing were as follows: lead <0.2 ppb, copper <1.0 ppb, arsenic <0.5 ppb, nitrate <0.05 mg/L, and hexavalent chromium <0.10 ppb. Researchers examined whether each sample’s contaminant level exceeded various water quality standards. For lead, the study team compared sample levels with the AAP recommendation of 1 ppb, 15 the FDA bottled water standard of 5 ppb, 36 and the EPA’s Lead and Copper Rule of 15 ppb. 37 For copper, arsenic, and nitrate, exceedance limits included the EPA and California action levels of 1300 ppb, 10 ppb, and 10 mg/L, 37 respectively. Hexavalent chromium exceedances included the current and proposed California action levels of 50 ppb and 10 ppb, respectively. 22
Covariates
The study team obtained school-level covariates from California Department of Education DataQuest 38 and the National Center for Education Statistics 39 for the year the school was sampled. Covariates included the percentage of students eligible for free or reduced-price meals (FRPM), a proxy for household income; the percentage of students from racial and ethnic minority groups (African American, Asian, American Indian, Filipino, Latino, Pacific Islander, or multiracial); the geographic setting of the school (city, suburb, rural, or town); and the number of students enrolled.
As a validity check, we compared public water system health-based violation reports and recent California state lead-testing results.20,40 We matched each school’s lead sampling data with the California State Water Resources Control Board Lead Sampling Results database 20 using the unique National Center for Education Statistics school identification number. To examine the correlation between public water system health-based violations and our study’s sampling results, we matched schools to their public water system identification number and compared their compliance data from the EPA’s Safe Drinking Water Information System’s Public Water Systems database. 40 In addition, comments from nonparticipating schools were qualitatively coded to understand barriers to sampling participation.
Our team cleaned and analyzed data using R version 4.2.1 (R Foundation). Descriptive analyses summarized school-level covariates based on drinking water contaminant levels, participation in sampling, and water system health-based violations. We conducted bivariate analyses using Wald χ2 tests and Fisher exact tests for categorical outcomes, and we performed t tests for continuous outcomes. We used multivariable logistic regression, accounting for clustering of water sources tested in schools, to examine school characteristics associated with drinking water quality exceedances. We considered a 2-sided P value of < .05 to be significant, and we calculated odds ratios (ORs) of schools exceeding AAP and FDA lead levels, along with 95% CIs.
We excluded schools with missing data entries from the respective analyses. Fewer than 3% of data were missing for all California school demographic characteristics, and all 240 schools had complete demographic data. While all participating schools had complete water sampling results, 5 tap locations were not specified. We cross-checked datasets before and after merging to ensure no duplicate schools. Data can be accessed through a Github repository. 41
Results
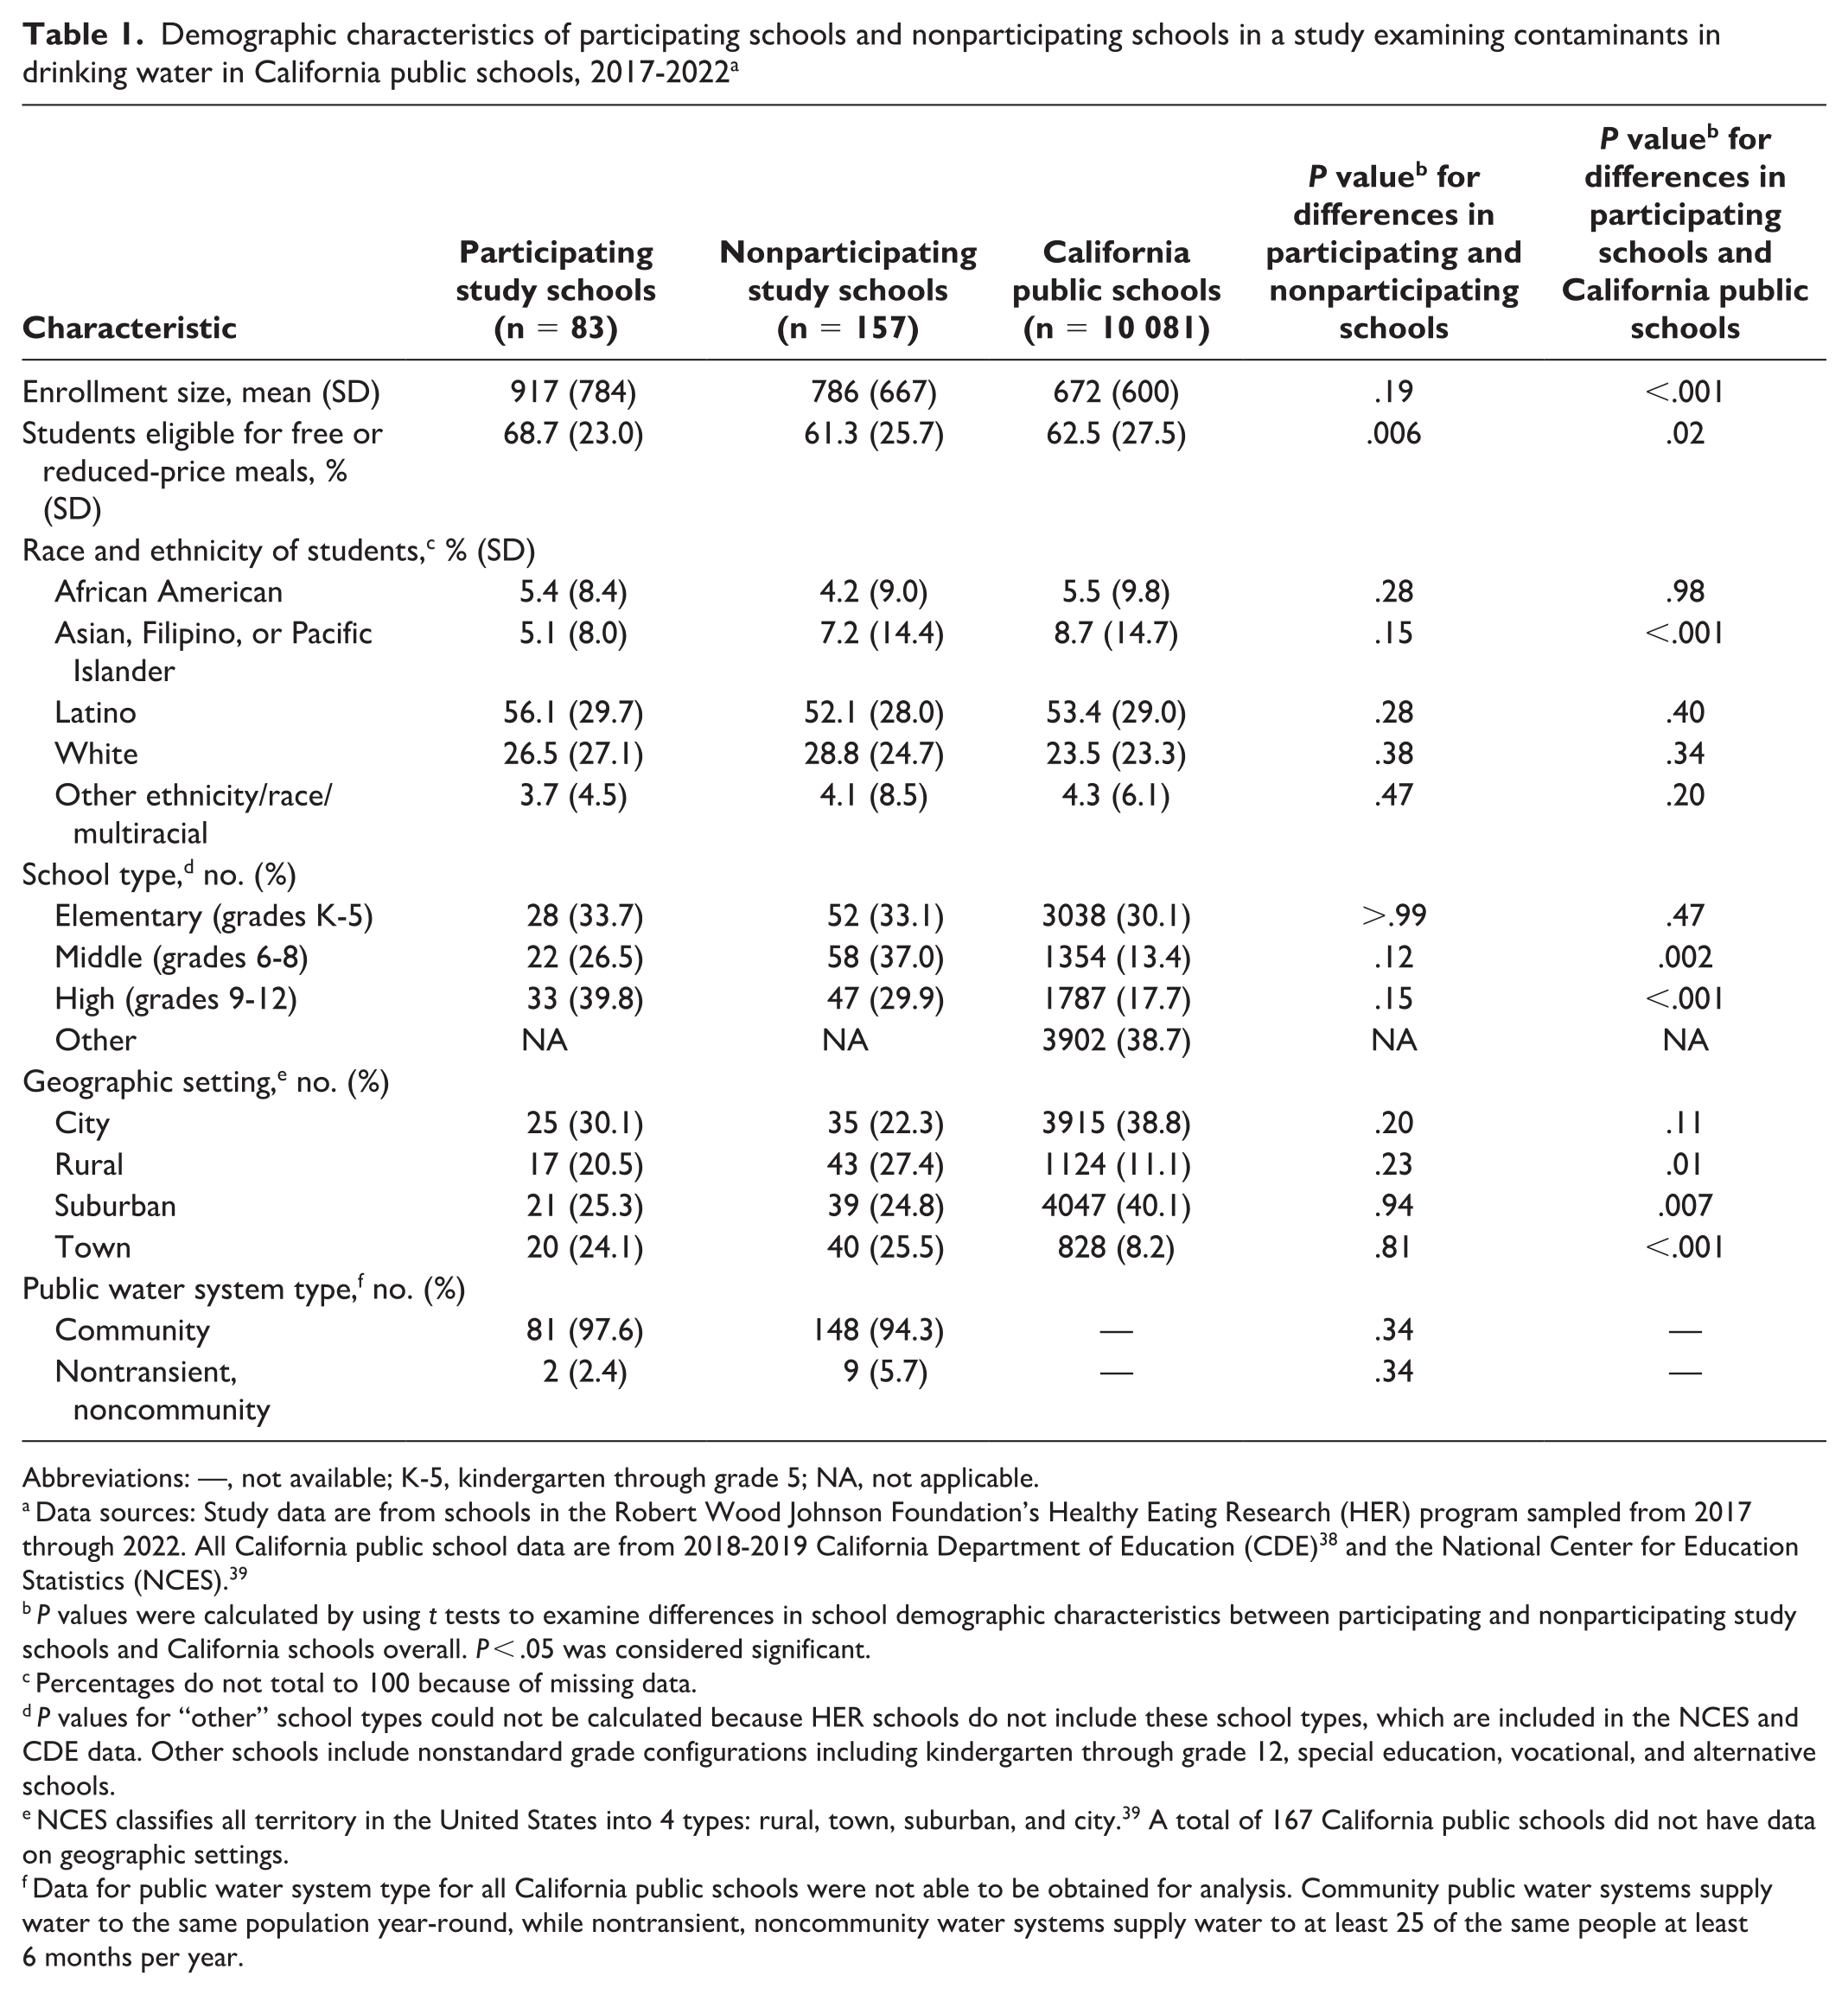
Compared with California public schools, participating schools had significantly greater mean (SD) enrollment (917 [784] vs 672 [600]; P < .001), percentage of students eligible for FRPM (68.7 [23.0] vs 62.5 [27.5]; P = 0.02), and a lower percentage of students from Asian, Filipino, or Pacific Islander backgrounds (5.1 [8.0] vs 8.7 [14.7]; P < .001) (Table 1).
Demographic characteristics of participating schools and nonparticipating schools in a study examining contaminants in drinking water in California public schools, 2017-2022 a
Abbreviations: —, not available; K-5, kindergarten through grade 5; NA, not applicable.
Data sources: Study data are from schools in the Robert Wood Johnson Foundation’s Healthy Eating Research (HER) program sampled from 2017 through 2022. All California public school data are from 2018-2019 California Department of Education (CDE) 38 and the National Center for Education Statistics (NCES). 39
P values were calculated by using t tests to examine differences in school demographic characteristics between participating and nonparticipating study schools and California schools overall. P < .05 was considered significant.
Percentages do not total to 100 because of missing data.
P values for “other” school types could not be calculated because HER schools do not include these school types, which are included in the NCES and CDE data. Other schools include nonstandard grade configurations including kindergarten through grade 12, special education, vocational, and alternative schools.
NCES classifies all territory in the United States into 4 types: rural, town, suburban, and city. 39 A total of 167 California public schools did not have data on geographic settings.
Data for public water system type for all California public schools were not able to be obtained for analysis. Community public water systems supply water to the same population year-round, while nontransient, noncommunity water systems supply water to at least 25 of the same people at least 6 months per year.
Participating schools served a significantly greater mean (SD) percentage of students eligible for FRPM than nonparticipating schools did (68.7 [23.0] vs 61.3 [25.7]; P = .006) (Table 1). Public water system type was similar across participating and nonparticipating schools. Participating schools had no public water system health-based violations for the contaminants we tested during the time of sampling. Only 2 participating schools had an EPA violation for lead from the recent state lead testing program.
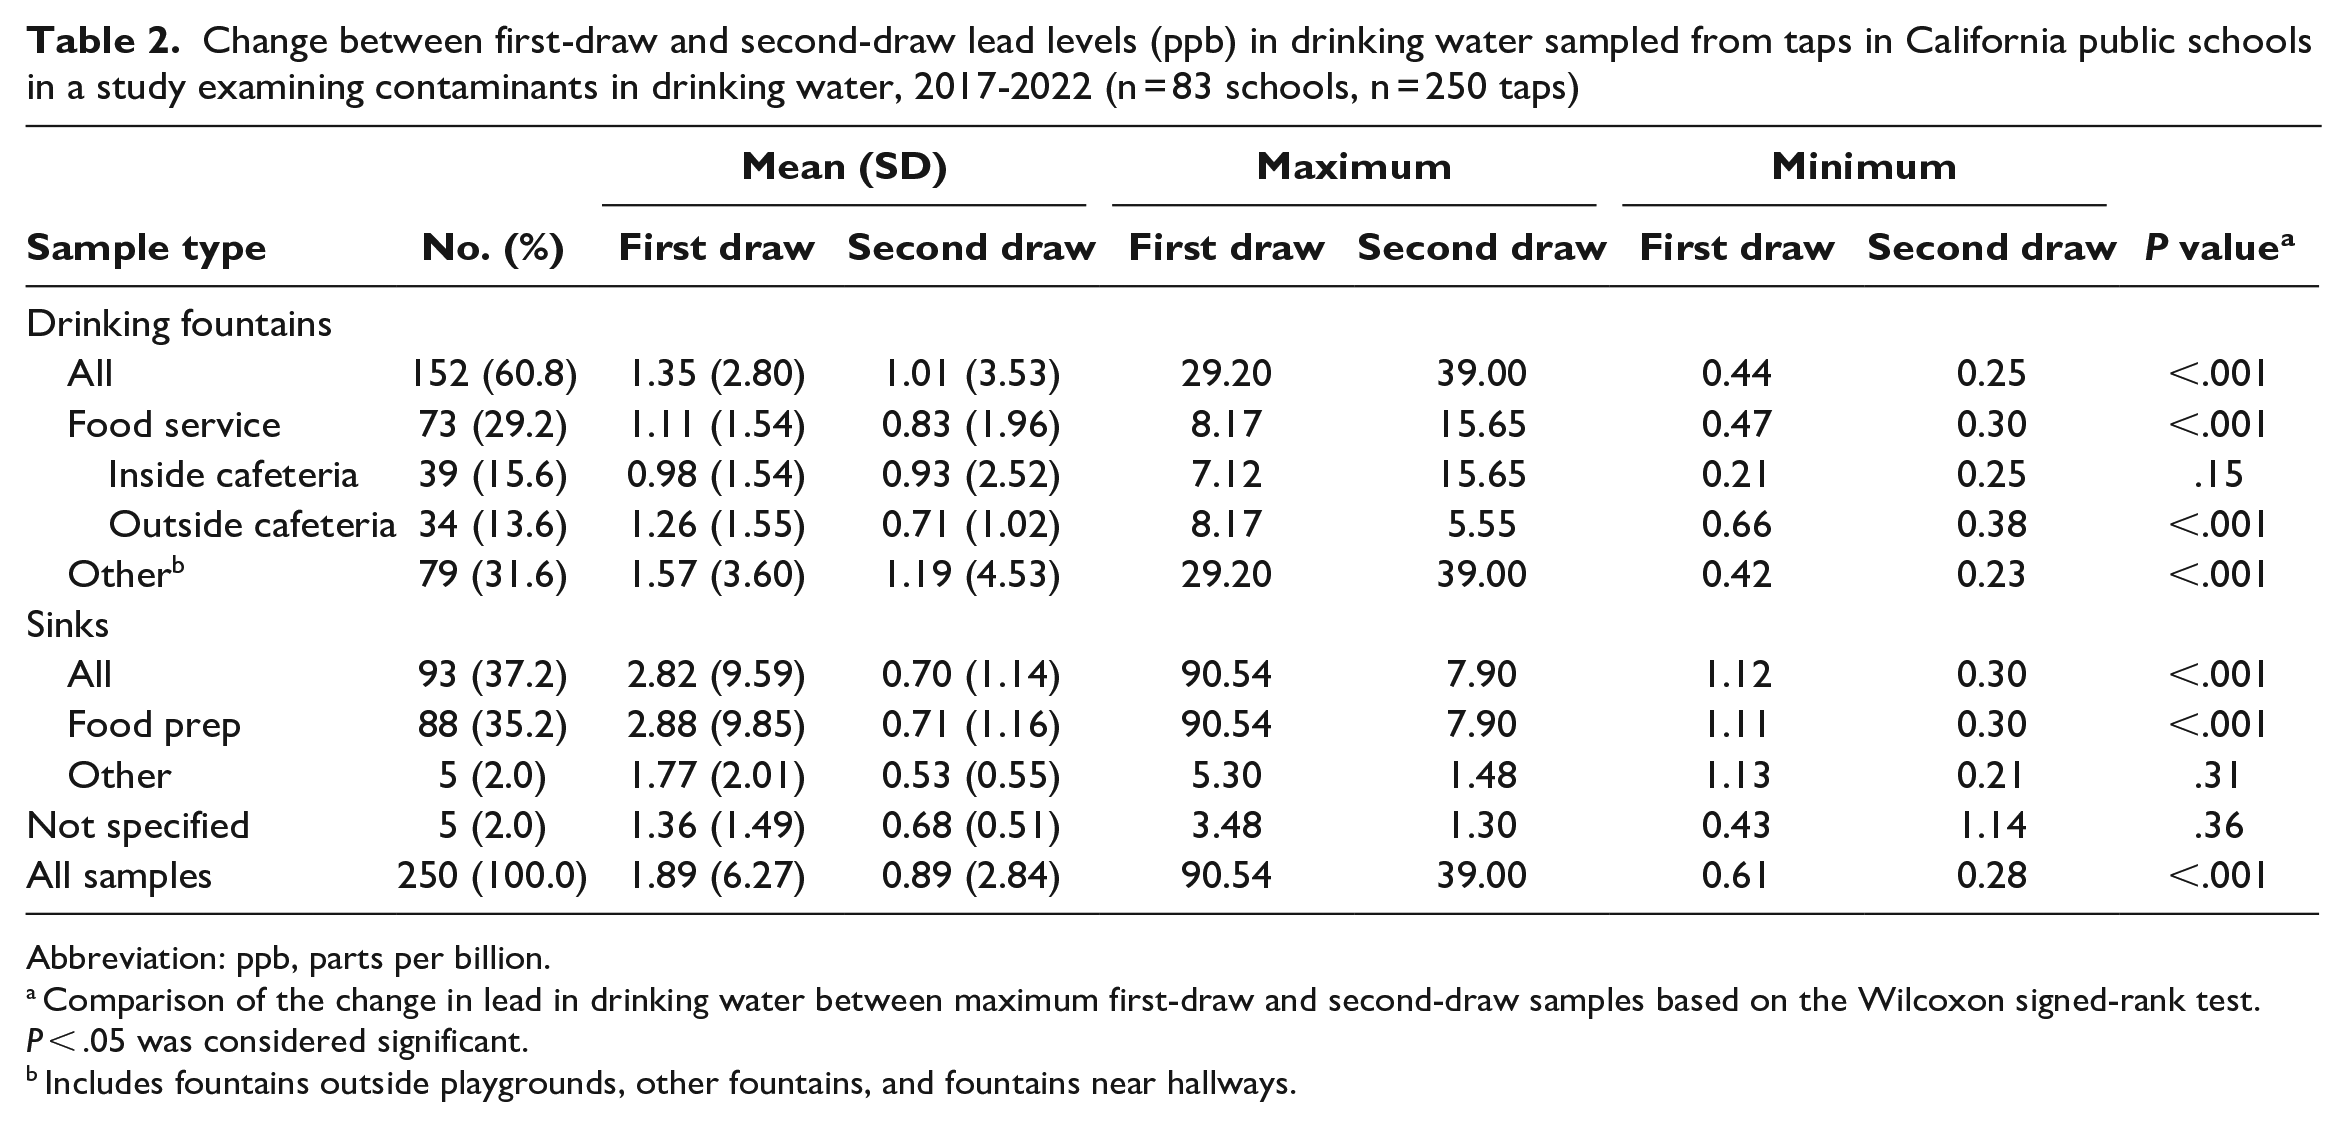
Of the 250 taps, 41% of first-draw samples and 15% of second-draw samples exceeded the AAP lead standard of 1 ppb. In comparison, 7% of first-draw samples and 4% of second-draw samples exceeded the FDA bottled water standard of 5 ppb. When the California action level of 15 ppb was applied, only 1% of first- and second-draw samples exceeded this level. Sinks had the highest proportion of first-draw samples that exceeded the AAP, FDA, and California levels. Thirty-four percent of all drinking fountain first-draw samples exceeded the AAP recommendation level, while 6% exceeded the FDA standard. Mean (SD) lead levels in most taps were significantly lower after flushing for 45 seconds (1.89 [6.27] ppb vs 0.89 [2.84] ppb; P < .001) (Table 2).
Change between first-draw and second-draw lead levels (ppb) in drinking water sampled from taps in California public schools in a study examining contaminants in drinking water, 2017-2022 (n = 83 schools, n = 250 taps)
Abbreviation: ppb, parts per billion.
Comparison of the change in lead in drinking water between maximum first-draw and second-draw samples based on the Wilcoxon signed-rank test. P < .05 was considered significant.
Includes fountains outside playgrounds, other fountains, and fountains near hallways.
Three schools (4%) had taps in which the first-draw samples exceeded the California action level of 15 ppb. When the 5 ppb FDA standard was applied, 18% (n = 15) of schools on the first draw and 10% (n = 8) of schools on the second draw had taps that exceeded this standard. Schools exceeding the FDA standard were more likely to be city schools (36%) than suburban (14%), rural (12%), or town (5%) schools, to serve >50% of students from racial and ethnic minority backgrounds (28%) than to serve ≤50% of students from racial and ethnic minority backgrounds (4%), and to serve >40% of students eligible for FRPM (25%) than to serve ≤40% of students eligible for FRPM (Figure 2). When the AAP standard of 1 ppb was applied, 75% (n = 62) of schools had ≥1 tap with a first-draw sample that exceeded the standard. We found a 56% reduction in schools exceeding the AAP standard on the second draw to 33% (n = 28). For both draws, most schools had only 1 tap that had a test result >1 ppb. We found no significant differences in demographic characteristics between schools with and without FDA or AAP exceedances (Table 3).
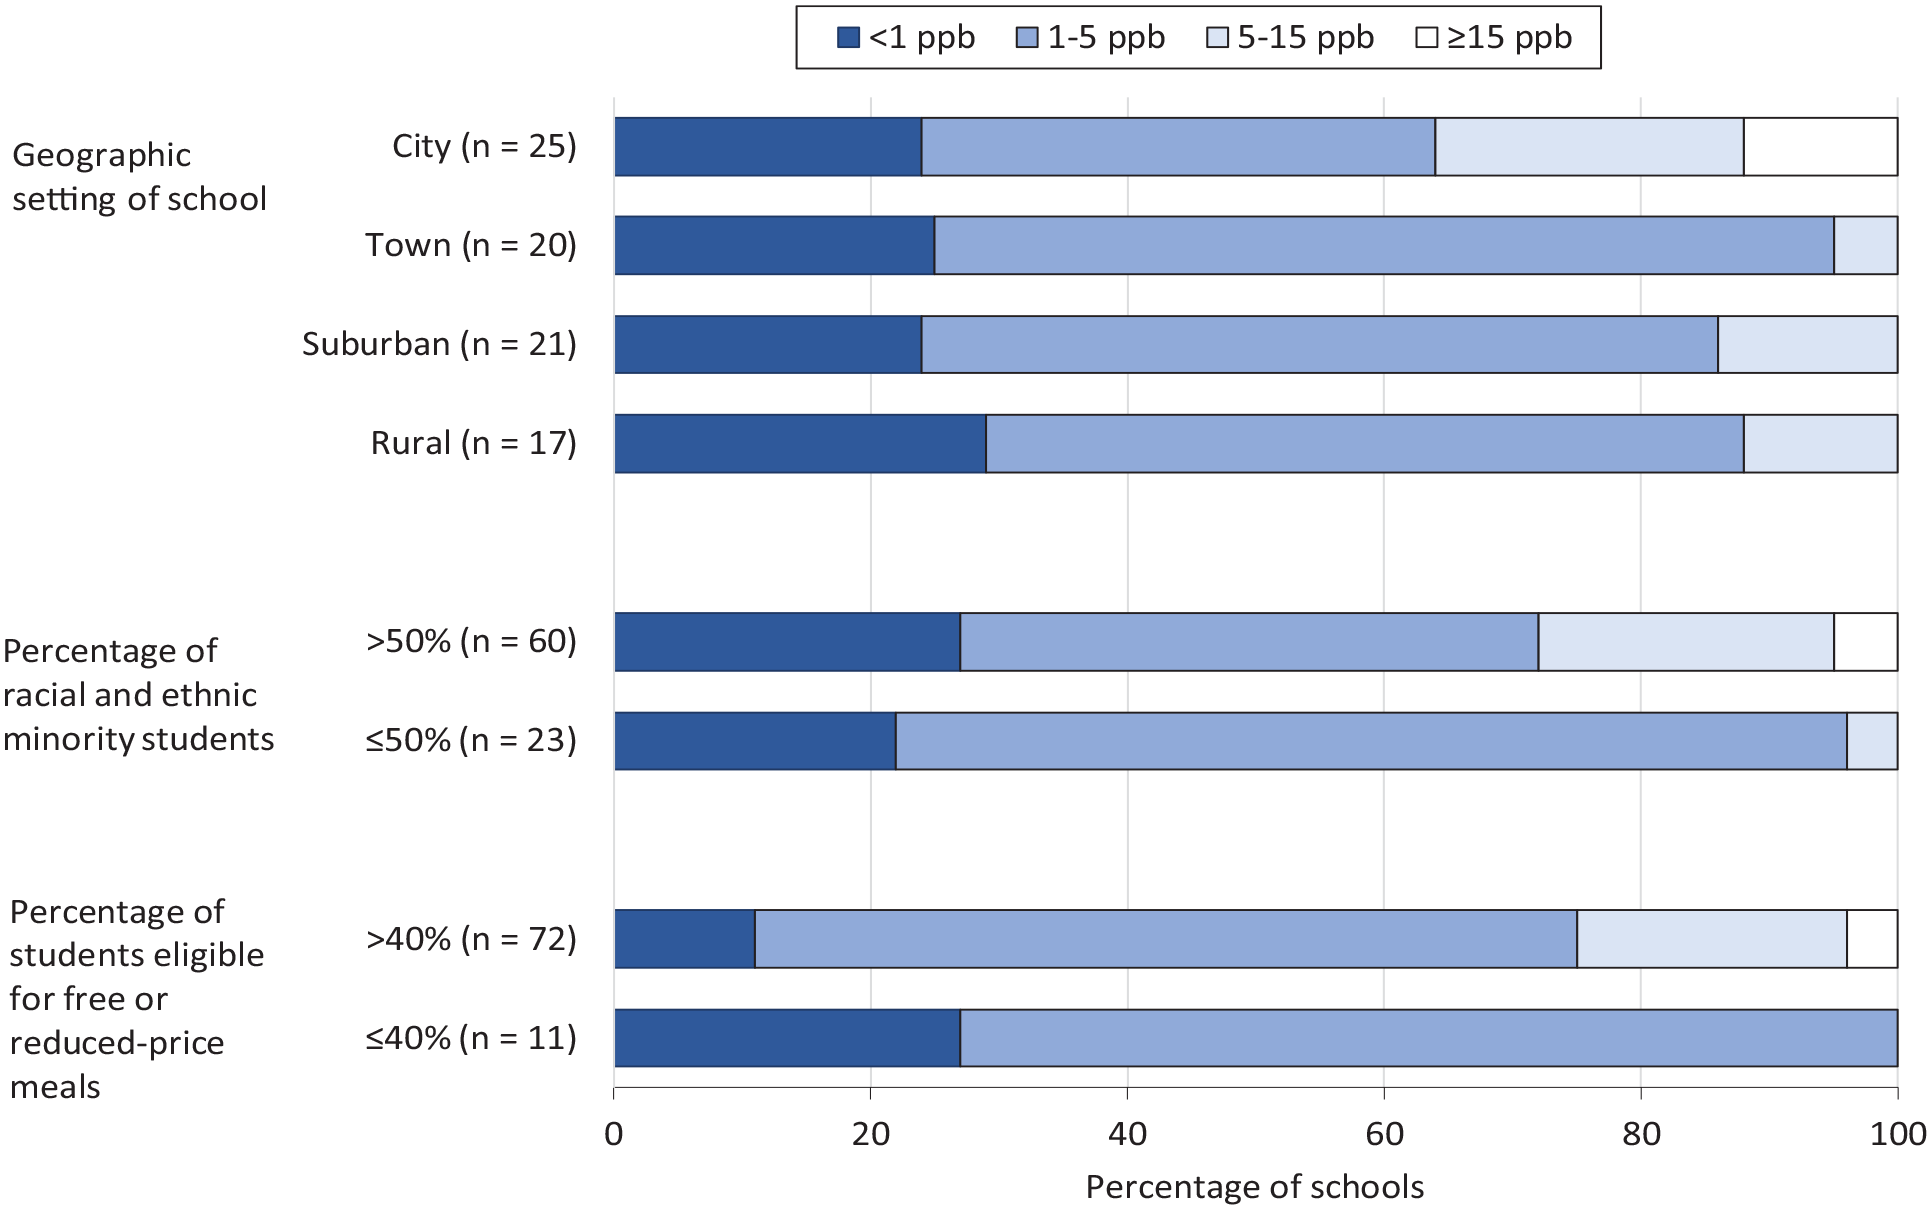
Lead level category of sampled California public schools, by school demographic characteristics, in a study examining contaminants in drinking water in public schools in California, 2017-2022 (n = 83). Abbreviation: ppb, parts per billion.
Comparison of characteristics of schools with and without exceedances of lead in first-draw water samples, in a study examining contaminants in drinking water in California public schools, 2017-2022 (n = 83) a
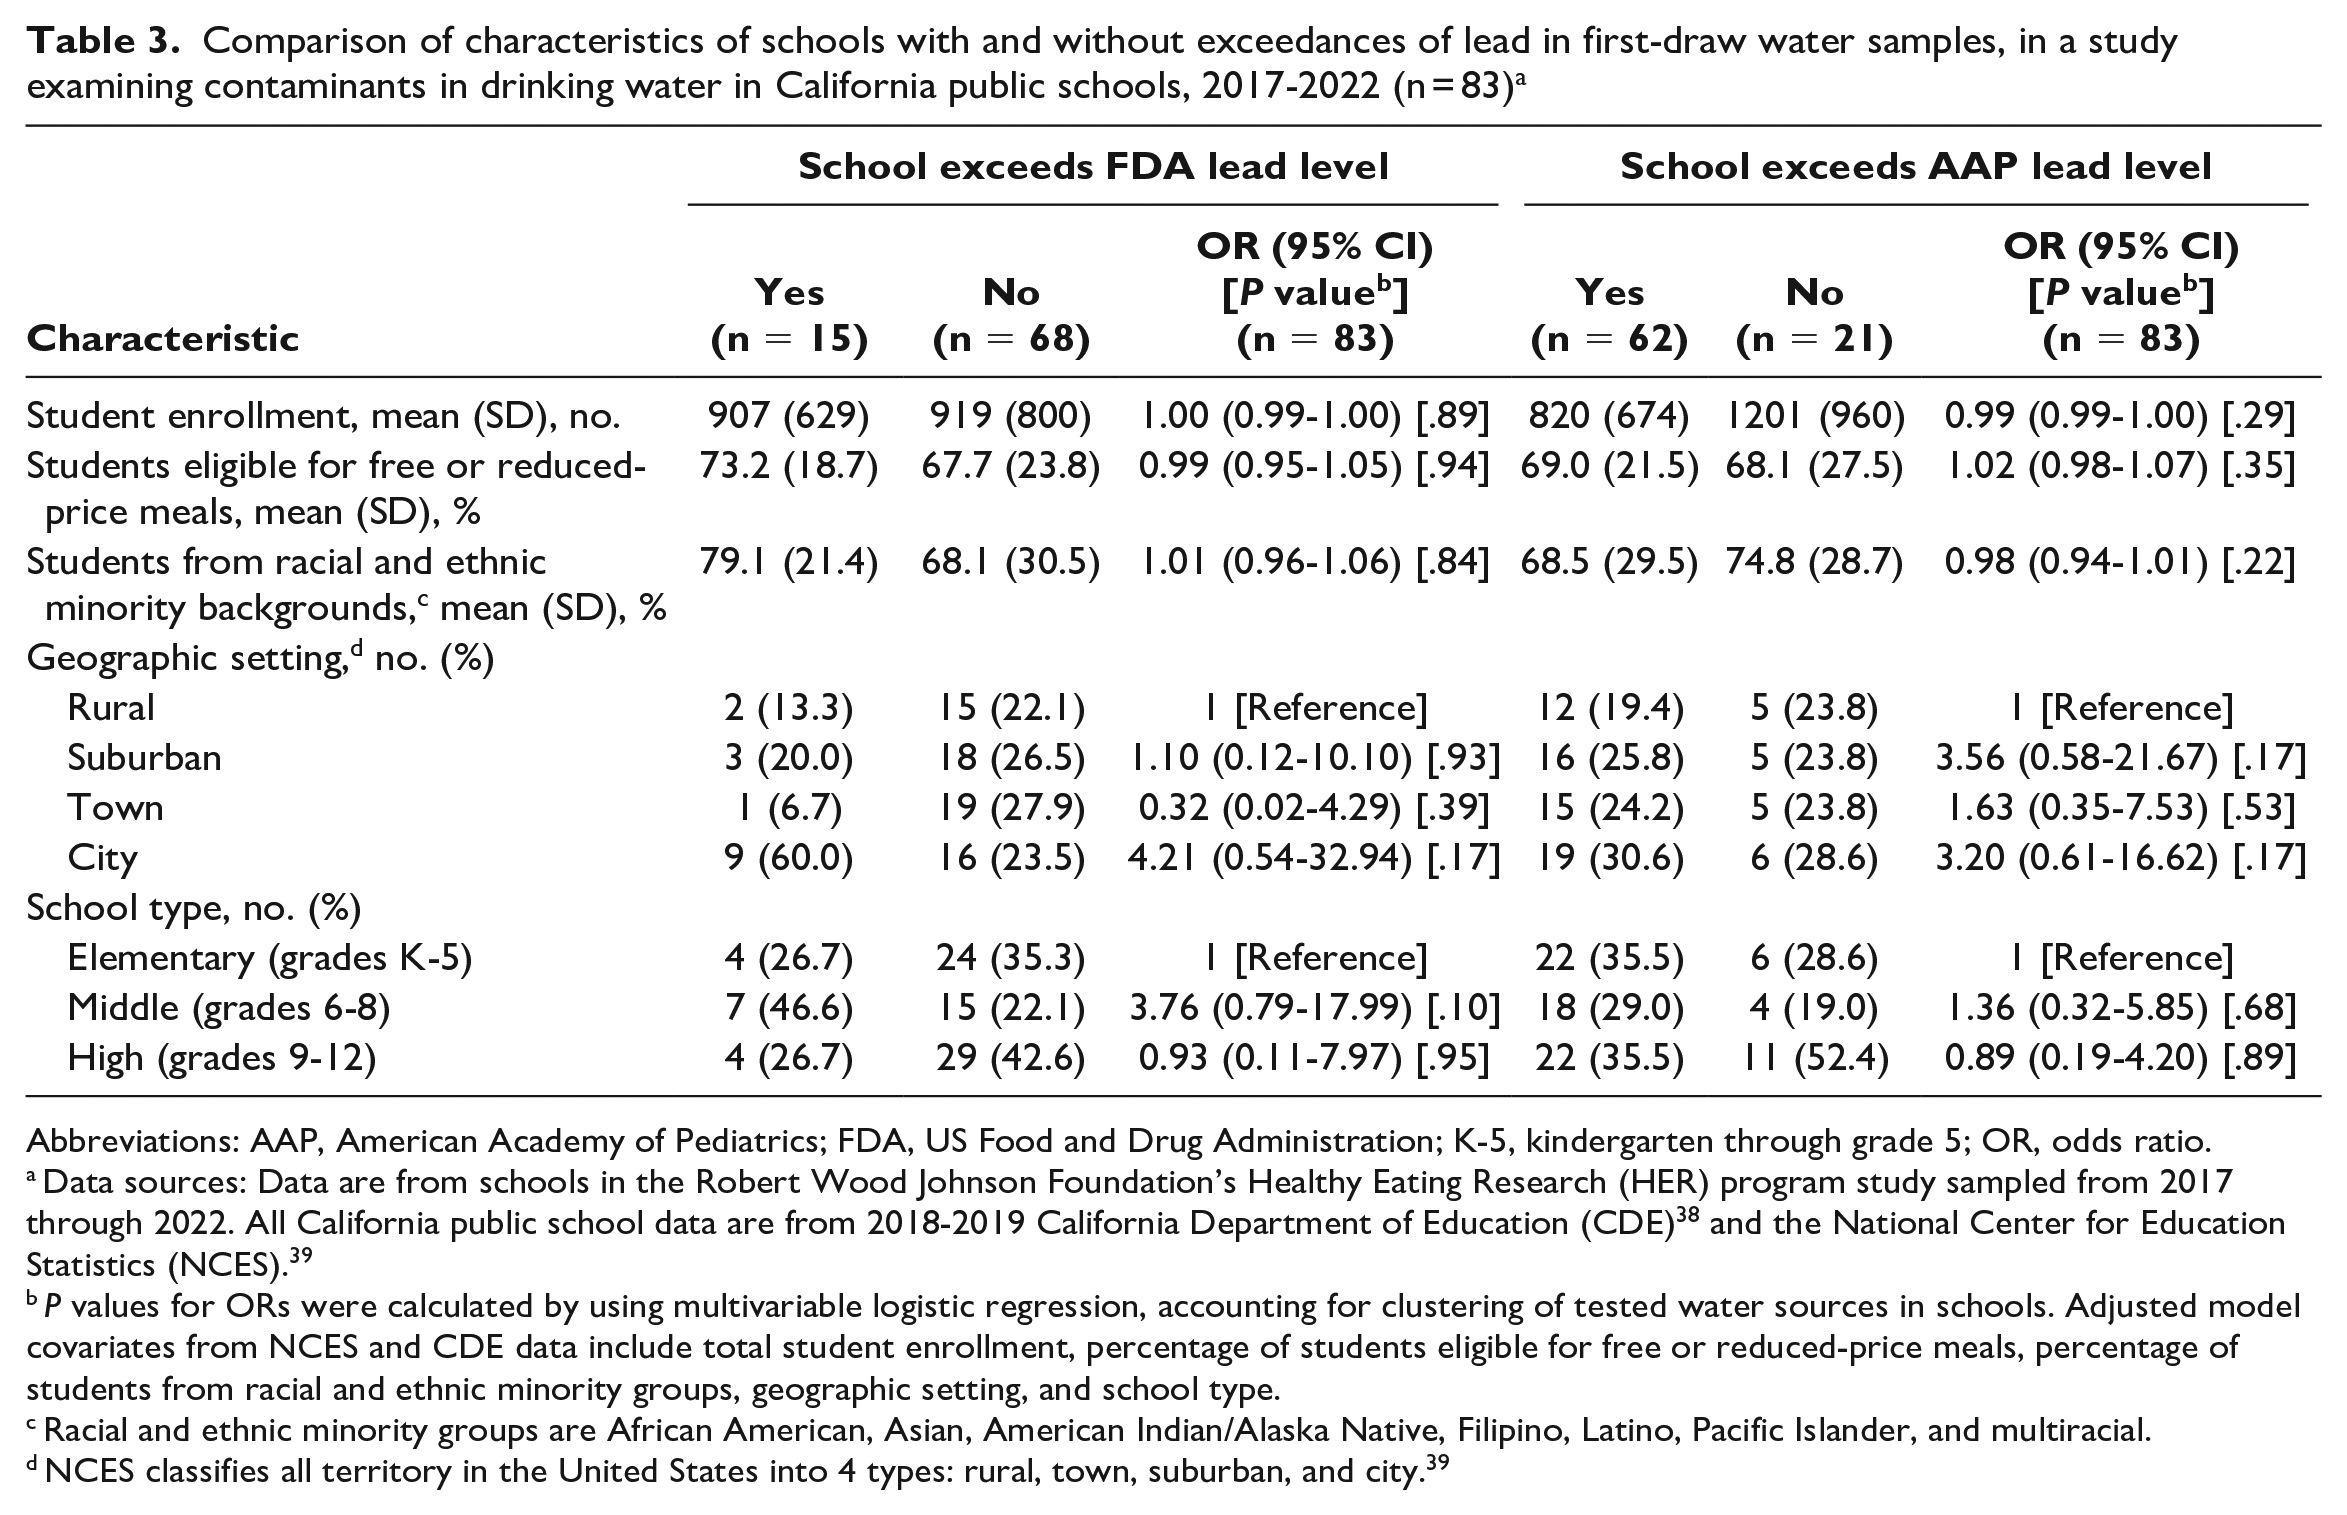
Abbreviations: AAP, American Academy of Pediatrics; FDA, US Food and Drug Administration; K-5, kindergarten through grade 5; OR, odds ratio.
Data sources: Data are from schools in the Robert Wood Johnson Foundation’s Healthy Eating Research (HER) program study sampled from 2017 through 2022. All California public school data are from 2018-2019 California Department of Education (CDE) 38 and the National Center for Education Statistics (NCES). 39
P values for ORs were calculated by using multivariable logistic regression, accounting for clustering of tested water sources in schools. Adjusted model covariates from NCES and CDE data include total student enrollment, percentage of students eligible for free or reduced-price meals, percentage of students from racial and ethnic minority groups, geographic setting, and school type.
Racial and ethnic minority groups are African American, Asian, American Indian/Alaska Native, Filipino, Latino, Pacific Islander, and multiracial.
NCES classifies all territory in the United States into 4 types: rural, town, suburban, and city. 39
On the first draw, 3 (4%) schools had FSA drinking fountains that exceeded the >1300 ppb EPA action level for copper (1302, 1479, and 2140 ppb). Compared with the average California public school, all 3 schools had a greater proportion of students eligible for FRPM. For copper, the mean of the total first-draw samples was 224 ppb, whereas the mean of the second-draw samples was 158 ppb.
We found no EPA violations of arsenic (>10 ppb) or nitrate (>10 mg/L) across the participating schools. Both first- and second-draw mean levels of arsenic were 1.4 ppb, while both first- and second-draw mean levels of nitrate were 1.2 mg/L. The highest level of arsenic and nitrate found in any school in both the first and second draws was roughly 8 ppb.
We found no violations of hexavalent chromium above the current 50 ppb California action level. However, when the proposed California action level of 10 ppb was applied, 3 (4%) schools had ≥1 tap in violation. These schools were large suburban schools in Southern California served by public community water systems with greater proportions of non-White students and students eligible for FRPM and a larger enrollment than the average California public school. The mean level of hexavalent chromium across all taps was 1.2 ppb.
Discussion
This study examined drinking water quality in California public schools, including lead at the AAP recommendation, 2 source water contaminants sometimes found in California public water systems, 42 and 1 contaminant currently unregulated at the federal level. Our analysis found that schools were generally providing safe tap water, which is critical to support students’ health and learning. However, the health-based drinking water violations found in our study and others2,3,5,6,24 demonstrate the importance of continued testing and tracking to ensure drinking water meets all relevant safety standards in all US schools.
Enforcing stricter school lead drinking water standards, particularly to <5 ppb on the first draw, could increase the number of schools facing water quality violations, causing substantial financial and resource implications. Our estimate of 18% of schools exceeding the 5 ppb standard is similar to the findings from a representative sample of California public schools (16%) 24 but lower than a recent nationwide study’s median estimate of 40% (13%-81%). 6 Although the sample size limited statistical power, city (OR = 4.21; 95% CI, 0.54-32.94; P = .17) and middle (OR = 3.76; 95% CI, 0.79-17.99; P = .10) schools had 3 to 4 times the odds of exceeding the FDA 5 ppb level than schools in other areas and of other types. Moreover, this study suggests that, if the AAP recommendation of 1 ppb were to be applied, roughly 75% of California schools would be required to take steps to remediate their drinking water lead levels.
In addition to examining lead levels, our sampling is the first, to our knowledge, to examine copper, arsenic, nitrate, and hexavalent chromium levels in California school drinking water taps. While our analyses detected no state action-level violations for arsenic or nitrate, 4% of schools exceeded either the proposed 10 ppb action level for hexavalent chromium or the 1300 ppb action level for copper.
Limitations
This study had several limitations centered on our sample size of 83 schools, which was not large enough to satisfy the parent study23,31 and power calculations of 240 study schools, therefore limiting our ability to examine differences in the demographic characteristics of schools with and without exceedances in drinking water contaminants via statistical modeling.
First, recruiting schools to participate in tap water sampling posed many challenges, contributing to selection bias in our limited sample size. Researchers called and emailed schools in the study sample up to 9 times during periods of months and years, with many unreturned calls and emails. Recruitment was further complicated by school closures starting in March 2020 due to the COVID-19 pandemic. Sampling could not be properly completed because school administrators and students were not allowed on campus or to use the drinking water taps. Once schools reopened, the pandemic’s impact on postal operations caused problems with the mailing and receiving of test kits. Delays in study participation often resulted from school staff referring researchers to contact the district office to first obtain their permission.
Second, we were not able to gather information from the sampled schools about the age of taps or school buildings or the usage patterns of taps that could predict drinking water quality. Certain locations that school administrators wrote on sample bottles were not as specific as they could have been, limiting our understanding of tap water availability for students.
Third, while we sampled schools with higher proportions of students eligible for FRPM and larger enrollment sizes, this subsample was not as representative of California schools in the proportion of students from Asian, Filipino, or Pacific Islander backgrounds. Participating schools and California schools were significantly different in school type and geographic setting given our study sought to have equal strata meeting these criteria.
Lastly, these results of California schools may not be generalizable to other states.
Conclusions
This study provides considerations for policies seeking to achieve safer school drinking water standards. First, our estimates of 75% of schools exceeding AAP standards and 18% exceeding FDA standards suggest that a substantial number of schools would require remediation to comply with stricter standards. Second, despite the high estimates of schools that would likely need remediation if they implemented stricter standards, we found that flushing was an effective remediation technique to lower lead and copper levels, with few exceptions.
As California and other states consider implementing stricter standards for lead in drinking water, a comprehensive cost study is needed to understand the extent of school funding needed to implement the wide range of remediation techniques to comply. Rather than being used to provide bottled water, funding should prioritize long-term cost-effective and sustainable techniques such as fixture replacement or water filtration for schools with reoccurring issues not resolved by flushing.43,44 While this study is the first to our knowledge to test lead in California schools at the AAP level, more studies with larger sample sizes are needed to confirm whether differences in the demographic characteristics of schools with and without drinking water violations were significant.
Although we found no compliance issues for the 2 sampled schools operating as their own water supplier (ie, nontransient, noncommunity water systems), future research should target schools on these nontransient, noncommunity water systems, in communities with high proportions of racial and ethnic minority people, and in areas that rely heavily on groundwater, to ensure children are not exposed to elevated levels of toxic source water contaminants that can be found in water supplies. Continued sampling, testing, and remediation efforts are necessary in the United States to ensure drinking water meets all relevant safety standards in all schools.
Footnotes
Acknowledgements
The authors thank the schools, administrators, and research staff who supported the project.
Declaration of Conflicting Interests
The authors declared no potential conflicts of interest with respect to the research, authorship, and/or publication of this article.
Funding
The authors disclosed receipt of the following financial support for the research, authorship, and/or publication of this article: This research was supported by the Robert Wood Johnson Foundation through its Healthy Eating Research program (grant no. 75034).