
Abstract
Objective:
Disparities in COVID-19 vaccine coverage among college students are not well studied. We analyzed the extent of COVID-19 vaccination among all students at public institutions of higher education in Arkansas in spring and fall 2021 and examined factors associated with vaccination rates.
Methods:
We matched student enrollment data for the spring and fall 2021 semesters separately with immunization registry data to determine the COVID-19 vaccination status of students in each semester. We used multivariable logistic regression to determine variables associated with being fully vaccinated.
Results:
Overall, by the end of the fall 2021 semester, 49.1% of students were fully vaccinated, compared with 52.3% of students at the end of the spring 2021 semester. However, we observed important differences between student groups. Students who were in rural areas (vs urban areas), freshman (vs all other class years), at a 2-year college (vs 4-year college), non-Hispanic Black (vs Hispanic or non-Hispanic White), or in a nonhealth major (vs health major) were less likely to be fully vaccinated.
Conclusion:
Given the disparities in COVID-19 vaccine coverage among college students, continued efforts are needed in this young, but important, population segment to address students’ confidence in vaccines and to make vaccines more available and accessible on and near campuses. Novel approaches for tailored messaging and interventions to facilitate vaccine uptake may be needed for groups such as non-Hispanic Black students and students in rural areas who are less likely, compared with their counterparts, to accept COVID-19 vaccines.
During the past 5 decades, the percentage of adults aged 18-24 years who are enrolled in higher education institutions in the United States has steadily increased, reaching approximately 40% in 2020. 1 In the United States, almost 16 million students in 2020 were enrolled as undergraduate students and more than 3 million as graduate students. 2 In that same year, in Arkansas, almost 150 000 students were enrolled in higher education institutions. 2 US adults aged 18-24 years enrolled in higher education institutions are mobile, social, and more likely than nonenrolled adults to engage in risky behaviors, contributing to disease outbreaks.3,4
As shown in a previous study conducted between April 29 and May 8, 2020, the prevalence of SARS-CoV-2 antibodies among students at higher education institutions was similar to community prevalence. 5 In a subsequent national study conducted during May 31 to September 5, 2020, during early summer the incidence of COVID-19 increased among all age groups, whereas in August, once schools started, the incidence rose among those aged 18-22 years at a time when it decreased among older adults. 6 In another study, increased COVID-19 incidence among people aged 60 years or older followed the increased incidence among younger adults (aged 20-39 y) within a few days. 7 Colleges and universities reported explosive outbreaks among students, likely due to close proximity and interactions among large groups of students. Some of these outbreaks spilled into the community. 4 In a study of large colleges and universities, counties with universities that had remote instruction experienced a 17.9% decline in mean COVID-19 incidence, whereas counties with universities that had in-person instruction experienced a 56.2% increase, 8 pointing out the important role that higher education institutions can play in community spread.
Although many higher education institutions implemented mandates for face masks on their campuses during the COVID-19 pandemic, face masks were a less than ideal public health option at the time, because they were not always of the appropriate type or worn correctly. 9 In December 2020 and in February 2021, the issuance by the US Food and Drug Administration of Emergency Use Authorizations for vaccines against the SARS-CoV-2 virus provided a more efficacious way of reducing the incidence of severe COVID-19 than face masks.10-12 However, the effectiveness of these vaccines depends solely on the proportion of the population who chooses to accept vaccines. Given mobility in the community, young adults in colleges and universities have a strong potential to contribute to the spread of COVID-19, making it critical to maximize vaccine coverage on campuses of higher education institutions.
Within campus communities, student characteristics can contribute to vaccine access, acceptance, and confidence. To date, we are not aware of any studies that have examined vaccination rates in an entire population of students in public institutions of higher learning in a single state. In this study, we analyzed COVID-19 vaccination among students enrolled in all public higher education institutions in Arkansas and examined factors associated with vaccination rates. Our findings can provide policy makers and administrators with information for future preparedness planning and for improving vaccination rates.
Methods
Study Sample
We obtained official census data of all students enrolled in accredited public higher education institutions in Arkansas from the Arkansas Department of Higher Education (ADHE), for both the spring (n = 107 987) and fall (n = 118 682) 2021 semesters, representing approximately 33 public higher education institutions. We excluded private higher education institutions because of missing information. We matched this list with the COVID-19 immunization registry from the Arkansas Department of Health (ADH) to determine the COVID-19 vaccination status of each student and created deidentified analytic files. The institutional review board of the University of Arkansas for Medical Sciences reviewed this study and determined that it was non–human subjects research (no. 262831).
Variable Definitions
We defined the primary outcome as being fully vaccinated against COVID-19 (ie, receiving both doses of the Pfizer-BioNTech or Moderna vaccines or 1 dose of the Janssen vaccine). We excluded partially vaccinated students (ie, receiving only 1 dose of the Pfizer-BioNTech or Moderna vaccine) from analyses.
We collected data on sex (male or female), race and ethnicity (non-Hispanic Black or African American, Hispanic, non-Hispanic White, or Other [American Indian or Alaska Native, Asian, Native Hawaiian or Other Pacific Islander]), location of school (rural or urban), field of study (health or nonhealth major), college type (4-year college or community college [2-year college]), and student class year (freshman, sophomore, junior, senior, master, doctoral, postbaccalaureate/unclassified graduate, and unclassified undergraduate/unknown). We designated students in 2-year colleges as freshman or sophomore students. We based student class year on the semester being analyzed (spring 2021 or fall 2021).
We determined rural or urban classification using the US Department of Agriculture’s rural–urban continuum codes, 13 which we based on the county in which the school was located. Per rural–urban continuum codes, we classi-fied counties with codes 1-3 as urban and counties with codes 4-9 as rural. We determined health majors and nonhealth majors according to the American College Testing’s 14 list of college majors and occupational choices. We classified students whose ADHE-designated disciplines were within the American College Testing categories of Health Administration and Assisting or Health Sciences and Technology as having health majors. We classified all other students as having nonhealth majors.
Statistical Analyses
We performed preliminary bivariate analyses to identify significant student characteristics associated with being fully vaccinated and included those characteristics in our multivariable logistic regressions. We used 95% CIs (at P < .05) of odds ratios (ORs) to compare differences between groups and between the spring 2021 and fall 2021 semesters.
Given the findings in our initial analyses and using log likelihood ratio tests for goodness of fit, we determined significant interactions between race and ethnicity and urban or rural school location, between race and ethnicity and major, and between college type and urban or rural school location. We included these interaction terms in our final model. We assumed significance at P < .05. We performed data linkages and statistical analyses using SAS version 9.4 (SAS Institute Inc).
Results
Student Demographic Characteristics
After we removed duplicates and students who were partially vaccinated, we included in our analysis 96 180 students in the spring 2021 group and 106 527 students in the fall 2021 group (Table 1). These numbers represent 89.1% (96 180/107 987) and 89.8% (106 527/118 682) of the total public student population in spring and fall 2021, respectively. During each semester, approximately 61% of the student population was female and 65% was non-Hispanic White. During each semester, non-Hispanic Black and Hispanic students accounted for about 15% and 8%, respectively, of the total student population. Undergraduates accounted for nearly 83% of the population in both semesters, with freshman students making up approximately 30% of the student population in the fall semester and 23% in the spring semester. During each semester, approximately 75% of the total student population attended 4-year universities and about 71% attended schools that were in urban counties. About 18% of students were in health-related programs in both the fall and spring 2021 semesters.
Demographic characteristics and vaccination status of students in public institutions of higher education in Arkansas, 2021 a
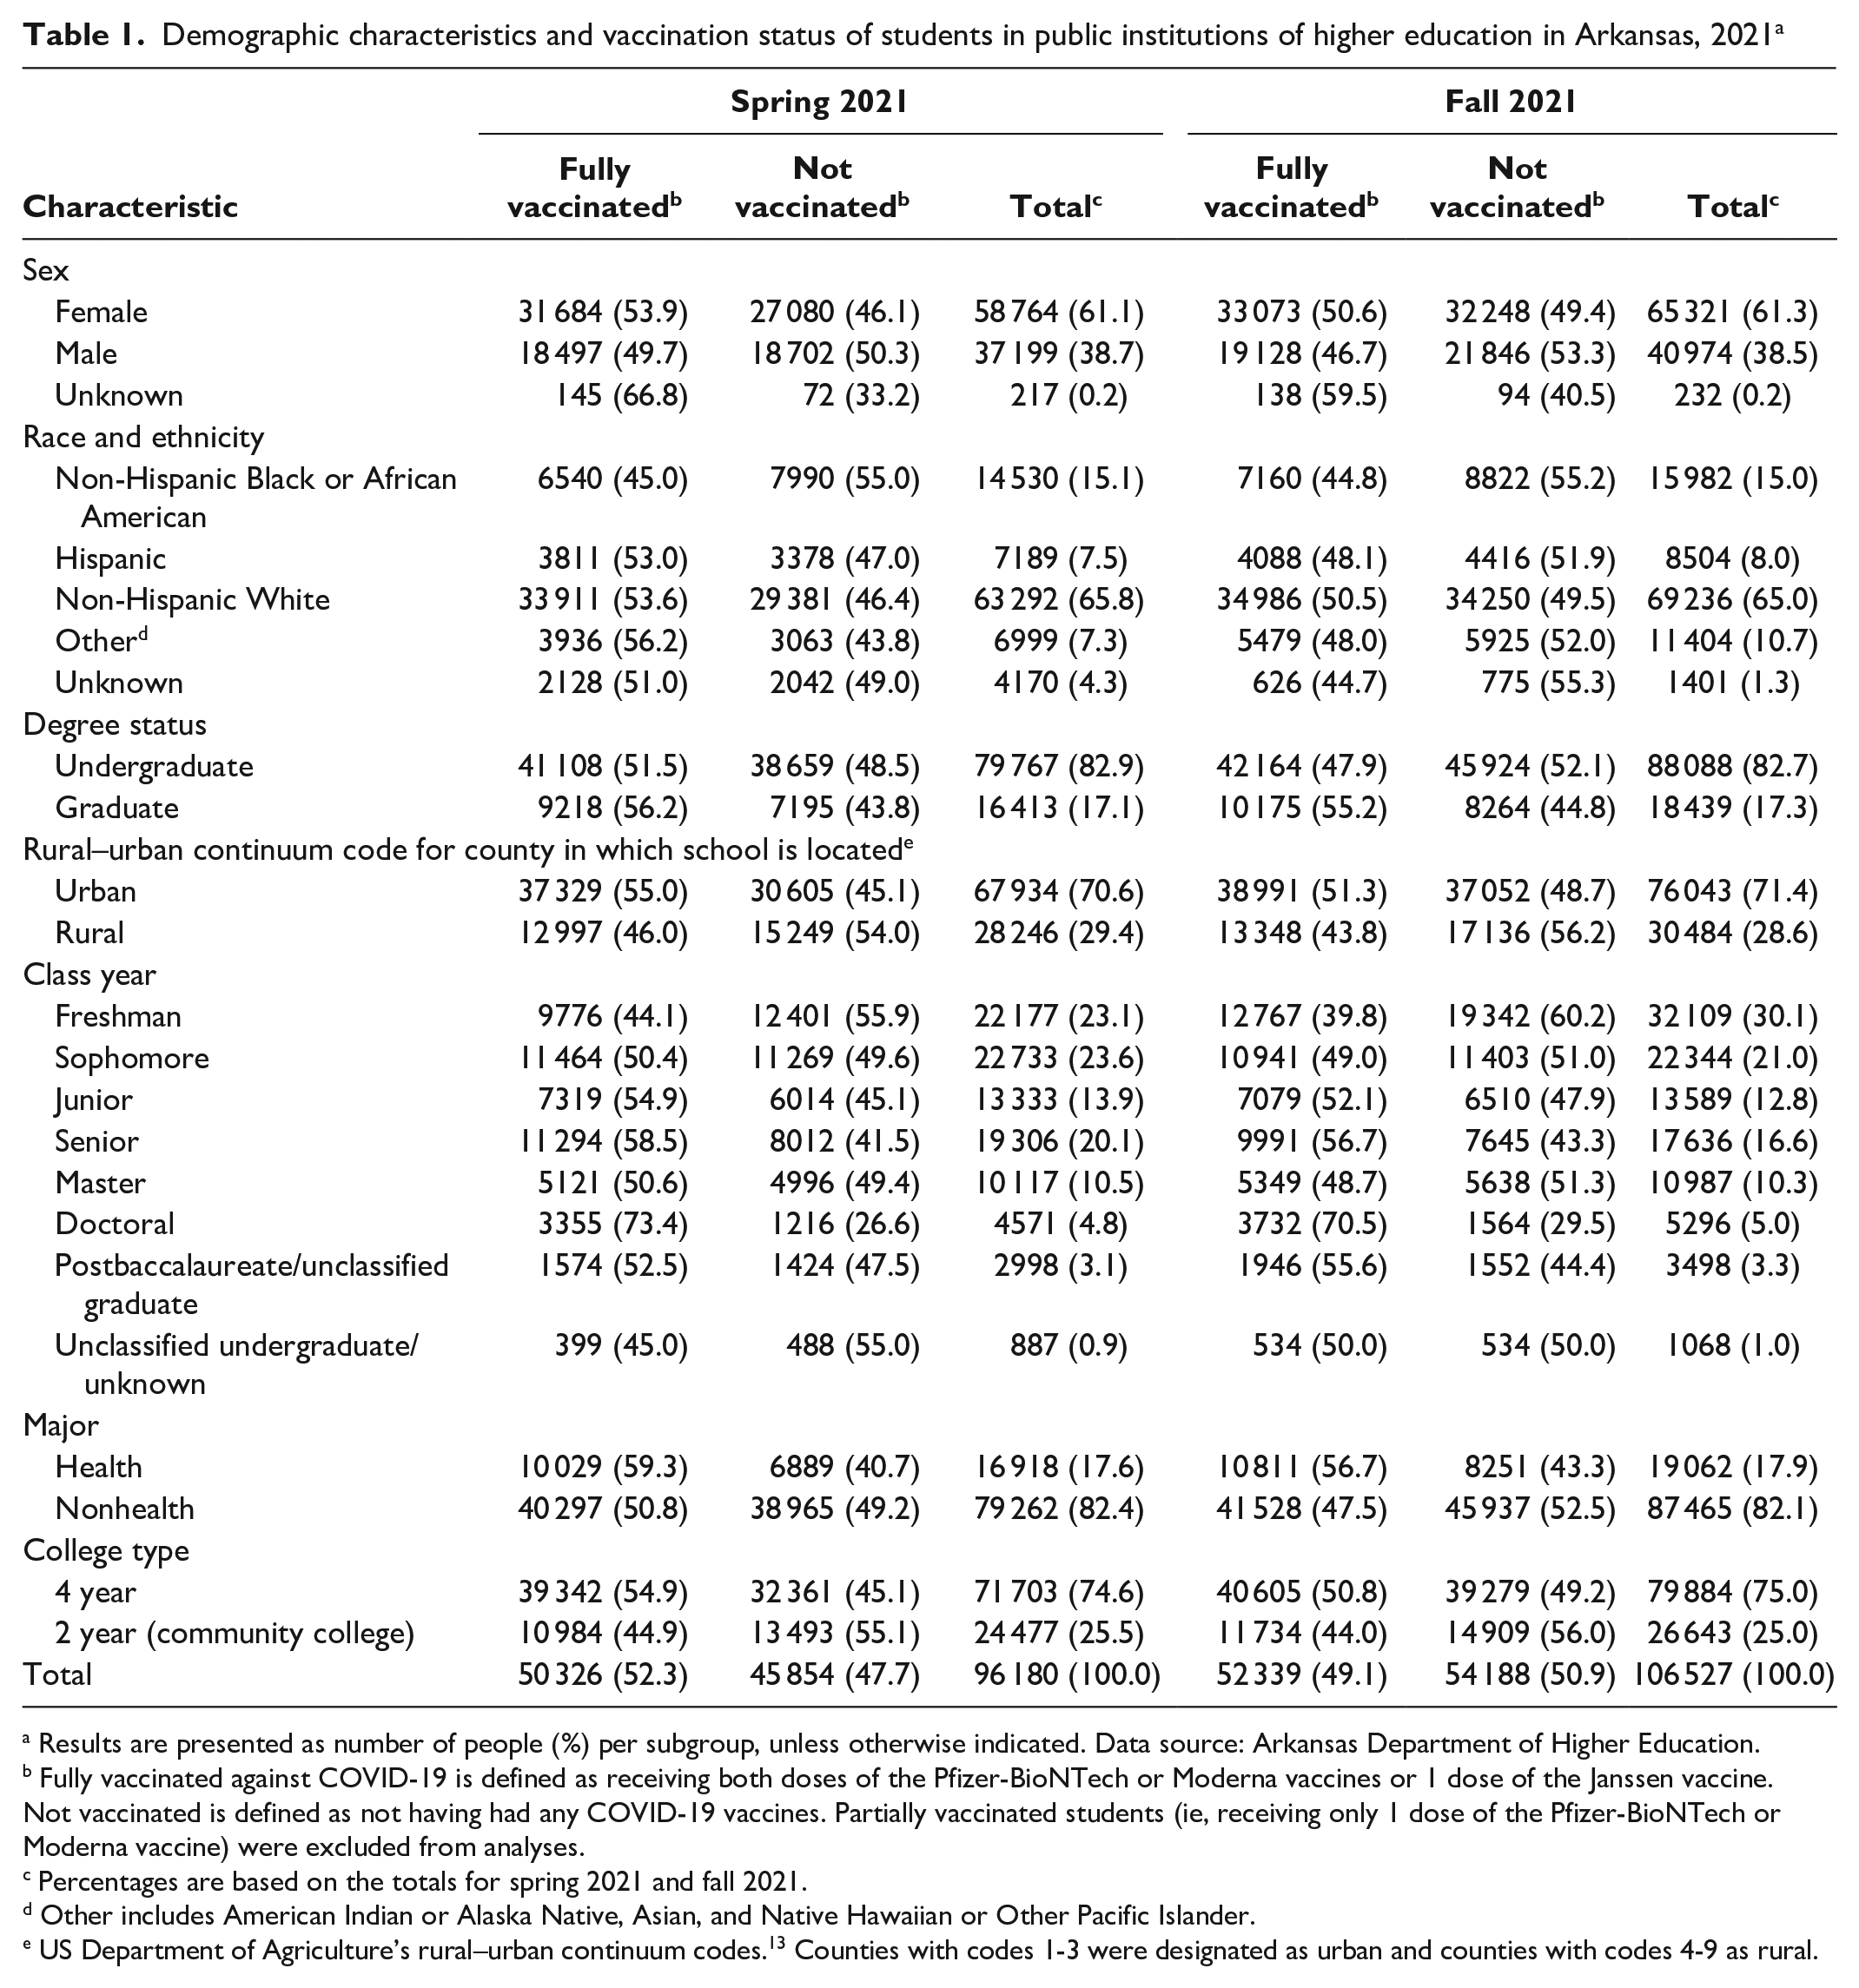
Results are presented as number of people (%) per subgroup, unless otherwise indicated. Data source: Arkansas Department of Higher Education.
Fully vaccinated against COVID-19 is defined as receiving both doses of the Pfizer-BioNTech or Moderna vaccines or 1 dose of the Janssen vaccine. Not vaccinated is defined as not having had any COVID-19 vaccines. Partially vaccinated students (ie, receiving only 1 dose of the Pfizer-BioNTech or Moderna vaccine) were excluded from analyses.
Percentages are based on the totals for spring 2021 and fall 2021.
Other includes American Indian or Alaska Native, Asian, and Native Hawaiian or Other Pacific Islander.
US Department of Agriculture’s rural–urban continuum codes. 13 Counties with codes 1-3 were designated as urban and counties with codes 4-9 as rural.
Immunization Status of Students
A little more than half (52.3%) of the student population in spring 2021 and 49.1% in fall 2021 were fully vaccinated (Table 1). During both semesters, more than half of the women but fewer than half of the men were fully vaccinated. In spring 2021 and fall 2021, respectively, 53.6% and 50.5% of non-Hispanic White students were fully vaccinated and 45.1% and 44.8% of non-Hispanic Black students were fully vaccinated. In spring 2021 and fall 2021, respectively, 56.2% and 55.2% of students enrolled in graduate degree programs were fully vaccinated and 51.5% and 47.9% of students enrolled in undergraduate programs were fully vaccinated. Only 46.0% and 43.8% of students who attended schools located in rural counties were fully vaccinated in spring and fall 2021, respectively. The proportion of vaccinated students increased in each successive class level for both semesters. Among freshman students enrolled in spring and fall 2021, 44.1% and 39.8% were fully vaccinated, respectively. Among senior students enrolled in spring and fall 2021, 58.5% and 56.7% were fully vaccinated, respectively. More than 70% of doctoral students were fully vaccinated during both semesters. More than half of the students with health majors were fully vaccinated in both semesters. Similarly, more than half of the students attending 4-year universities were fully vaccinated in both semesters.
Regression Analysis
In adjusted models, women had 16% (OR = 1.16; 95% CI, 1.13-1.20) and 12% (OR = 1.12; 95% CI, 1.09-1.15) higher odds of being fully vaccinated than men in the spring 2021 and fall 2021 semesters, respectively (Table 2). In each semester, the odds of being fully vaccinated increased for every year of class year (sophomore, junior, senior, master, and doctoral) compared with freshman students, with doctoral students having more than a 3-fold increase in the odds of being fully vaccinated in the fall semester (OR = 3.17; 95% CI, 2.97-3.39). When we compared semesters, compared with freshman students, the odds of being fully vaccinated for every class year (except doctoral) was significantly greater in the fall 2021 semester than in the spring 2021 semester.
Adjusted odds from logistic regression analyses for being fully vaccinated, among students in public institutions of higher education in Arkansas, 2021 a
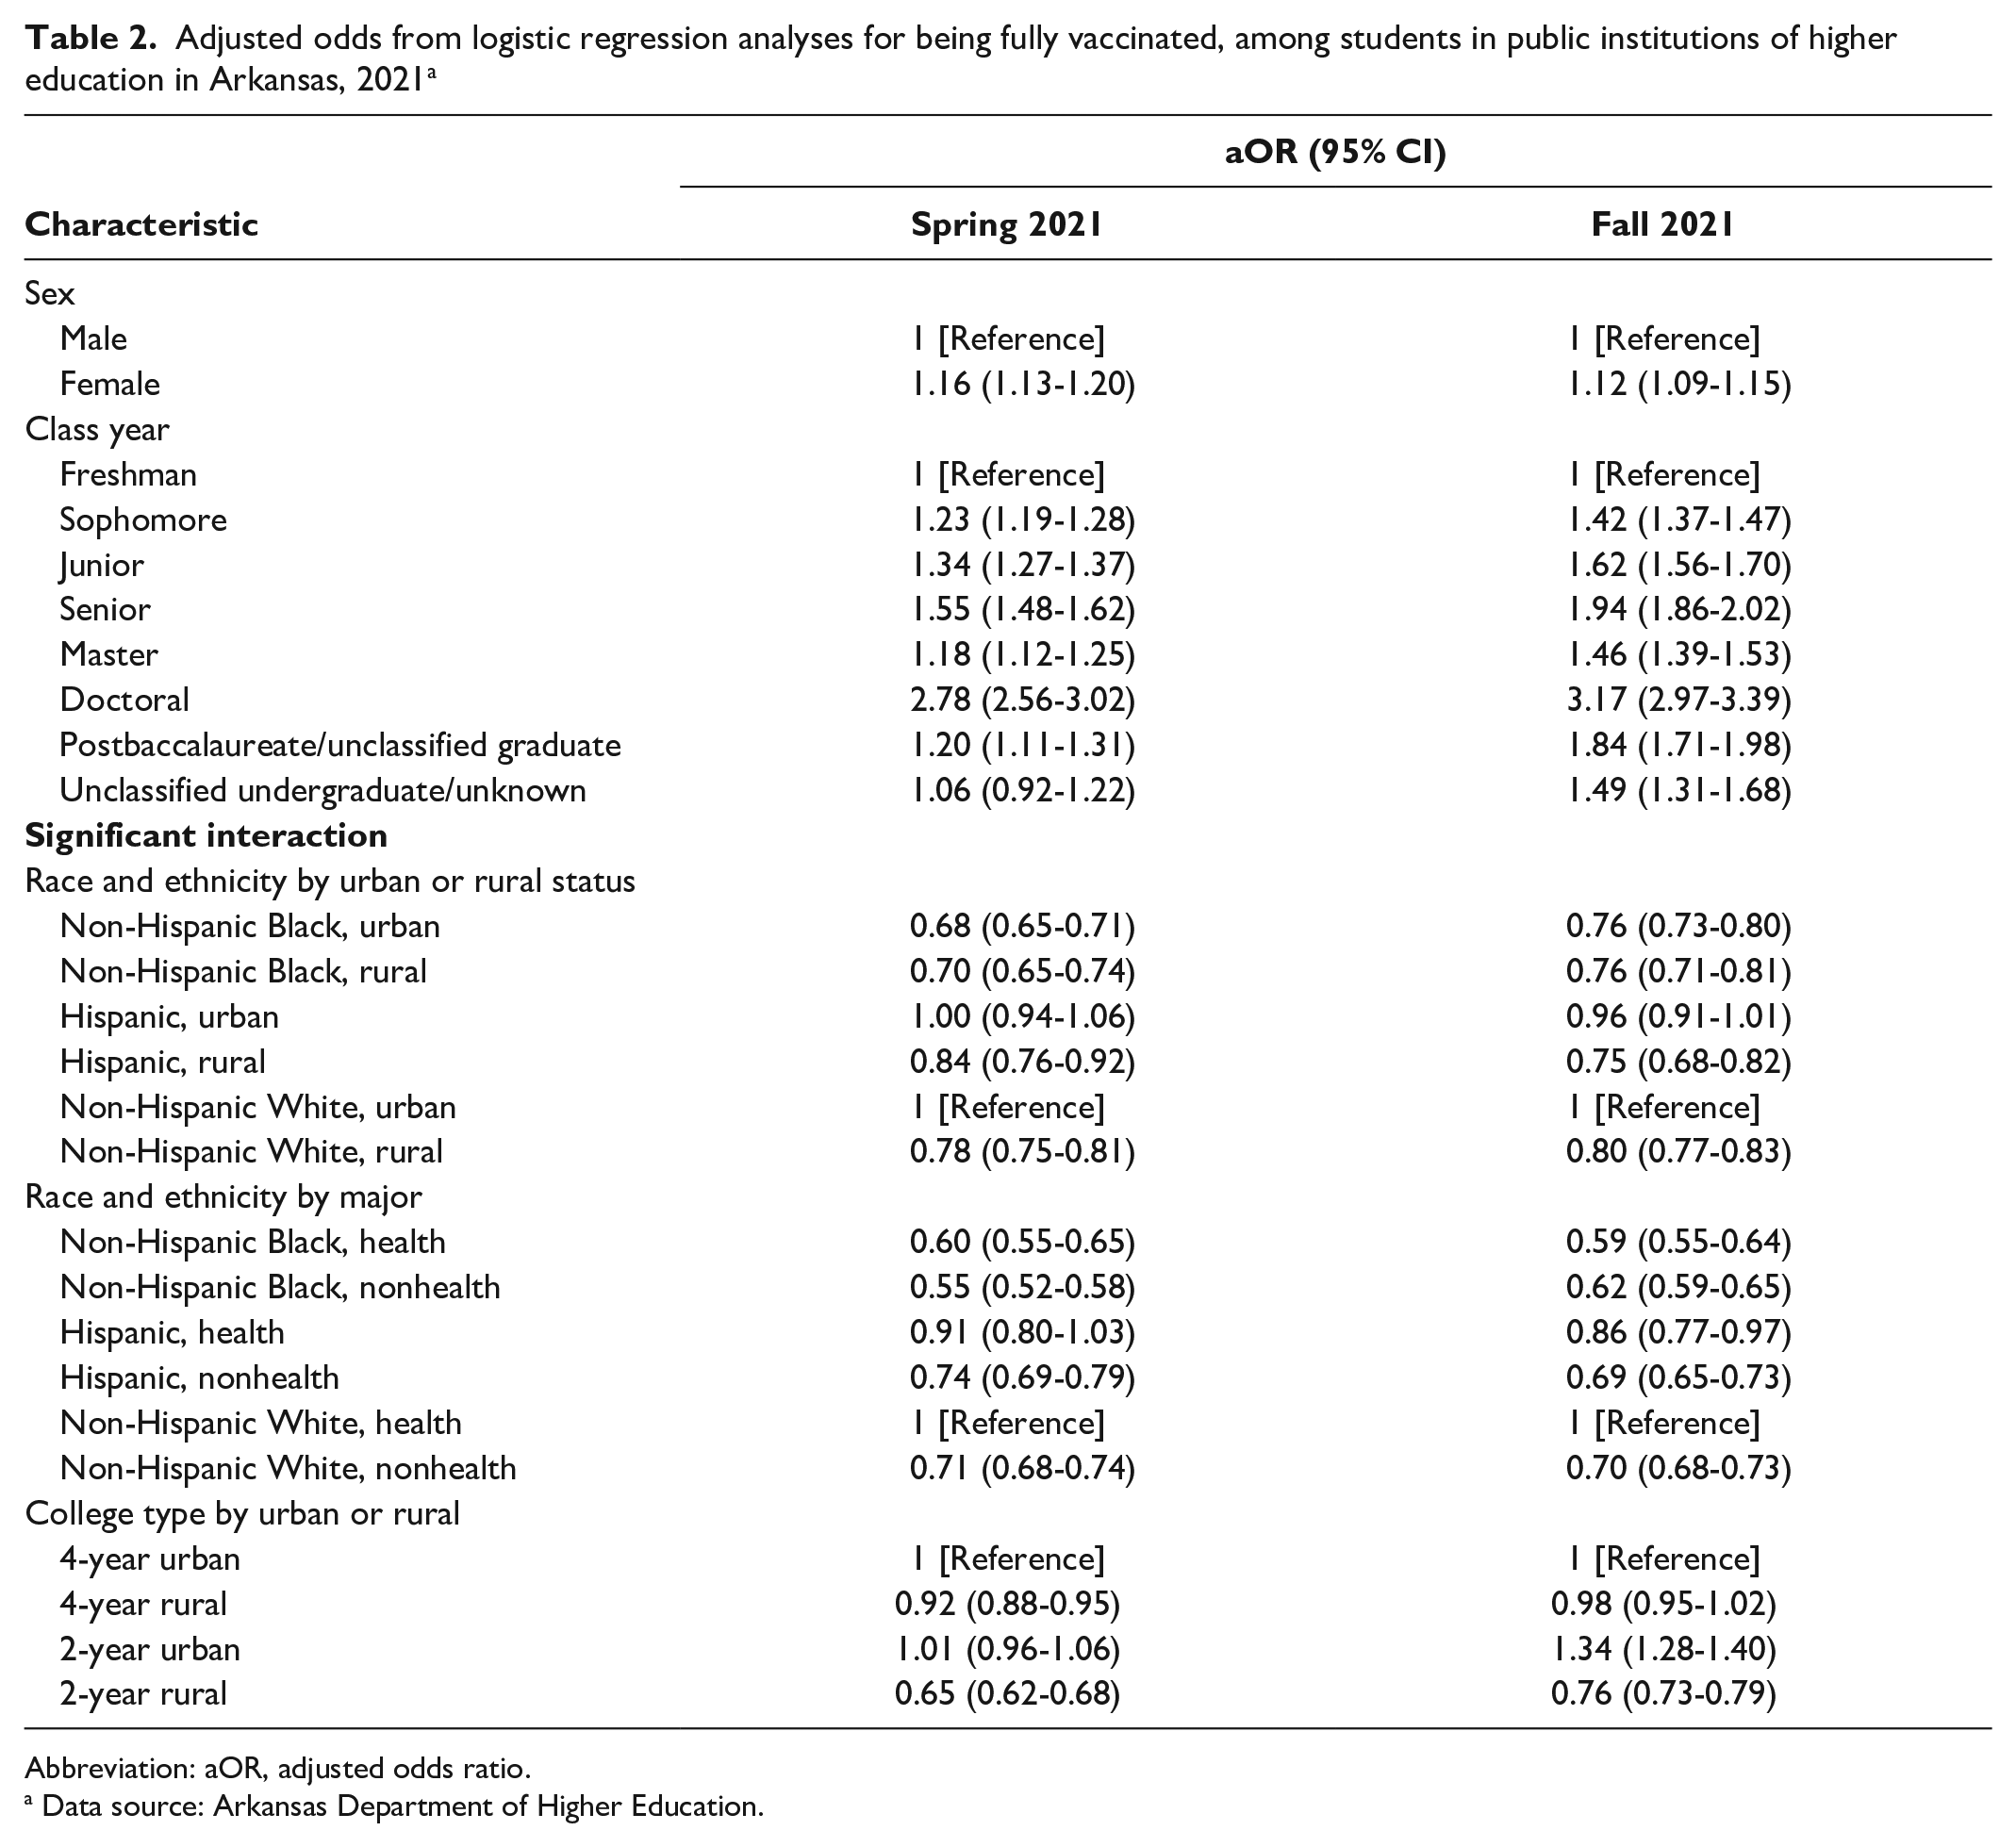
Abbreviation: aOR, adjusted odds ratio.
Data source: Arkansas Department of Higher Education.
When we examined interaction terms for race and school location for the spring semester, we found that non-Hispanic Black students in rural and urban counties had 32% (OR = 0.68; 95% CI, 0.65-0.91) and 30% (OR = 0.70; 95% CI, 0.65-0.74) lower odds, respectively, of being fully vaccinated than non-Hispanic White students in urban counties (Table 2). In the fall semester, non-Hispanic Black students in both rural (OR = 0.76; 95% CI, 0.71-0.81) and urban (OR = 0.76; 95% CI, 0.73-0.80) counties had 24% lower odds of being fully vaccinated than non-Hispanic White students in urban counties. Non-Hispanic White students in rural counties had 22% (OR = 0.78; 95% CI, 0.75-0.81) and 20% (OR = 0.80; 95% CI, 0.77-0.83) lower odds of being fully vaccinated in the spring and fall semesters, respectively, than non-Hispanic White students in urban counties.
Interaction terms for race and health-related major (Table 2) showed that, regardless of major, non-Hispanic Black and Hispanic students had lower odds of being fully vaccinated than non-Hispanic White students majoring in a health-related field. In both the spring and fall semesters, non-Hispanic Black students, whether majoring in a health-related field (OR = 0.60; 95% CI, 0.55-0.65; and OR = 0.59; 95% CI, 0.55-0.64, respectively) or not majoring in a health-related field (OR = 0.55; 95% CI, 0.52-0.58), had the lowest odds of vaccination compared with non-Hispanic White and Hispanic students. Non-Hispanic White students not majoring in a health-related field also had lower odds (OR = 0.71; 95% CI, 0.68-0.74; and OR = 0.70; 95% CI, 0.68-0.73, for spring and fall 2021, respectively) of being fully vaccinated than non-Hispanic White students majoring in a health-related field.
We noted a significant interaction (P < .001) between location of school and type of college (Table 2). During the spring semester, students who attended 4-year universities and community colleges in rural counties had lower odds of being fully vaccinated than students who attended 4-year universities in urban counties. For students enrolled in the fall 2021 semester, students who attended community colleges in urban counties had 34% (OR = 1.34; 95% CI, 1.28-1.40) higher odds, and those in rural counties had 24% (OR = 0.76; 95% CI, 0.73-0.79) lower odds, of being fully vaccinated than students who attended 4-year universities in urban counties.
Discussion
This study provides a statewide analysis of factors related to COVID-19 vaccination among college students, showing that students who attended public colleges or universities in rural areas, were freshman, attended a 2-year college, were non-Hispanic Black, or were majoring in nonhealth fields were less likely to be fully vaccinated than their counterparts.
In Arkansas, college students became eligible to receive COVID-19 vaccines on March 16, 2021, 15 and on March 30, 2021, 16 the governor declared all people aged 16 years and older in Arkansas eligible. Therefore, by the end of the spring 2021 semester, all students were eligible for full immunization. However, our results show that only 52.3% of students in public colleges and universities in Arkansas were fully vaccinated at that time. For students enrolled in the fall 2021 semester, about 7 months later, only 49.1% of students were fully vaccinated. However, these totals hide differences between student groups. For example, in the spring 2021 semester, 73.4% of doctoral students were fully vaccinated, compared with only 44.1% of freshman students; for students on urban and rural campuses, 55.0% and 46.0% of students, respectively, were fully vaccinated; and 45.1% of non-Hispanic Black students were fully vaccinated, compared with 53.6% of non-Hispanic White students and 53.0% of Hispanic students.
We examined factors associated with a higher likelihood of being fully vaccinated in this population, after covariate adjustment. In general, women were significantly more likely to be vaccinated than men (based on nonoverlapping 95% CIs). Although some studies have shown greater hesitancy in the intention to get vaccinated among women versus men in both the United States and other countries,17-20 our finding is consistent with COVID-19 vaccination data reported in the United States by the Centers for Disease Control and Prevention 21 and consistent with findings of higher influenza vaccine coverage among women than among men in the United States. 22 State data from ADH indicated that, for the 2019-2020 influenza season immediately before the start of the COVID-19 pandemic, more women (28.3%) than men (19.1%) in Arkansas had received an influenza vaccine—a pattern similar to the years before (2018-2019) and after (2020-2021) this period (H. Safi, MD, MPH, ADH, email communication, May 23, 2022).
Our study also showed a generally increasing likelihood of being vaccinated by class year among undergraduate students and master’s and doctoral students. Whether these data reflect an age effect or an education effect is not clear. However, the differences are significant and consistent across semesters, indicating the need for better communication and education among first-year and second-year students. We chose not to adjust for age for 3 reasons. First, age was highly correlated with class year; therefore, the latter serves as a proxy for age in this study. Second, the age range in this population of college and university students is relatively narrow and similar across school types (based on data received from ADHE, for 4-year colleges, 90% of students are aged 18-45 years, with a mean of 25 years and a median of 22 years; for 2-year colleges, 90% of students are aged 18-47 years, with a mean of 26 years and a median of 22 years). Also, we included class year instead of age because class year is more actionable than age for policy decisions and outreach initiatives.
Our results showed that race and ethnicity and urban or rural location are independent determinants of being fully vaccinated. Based on these results, several general statements can be made. First, non-Hispanic Black students, regardless of whether they attend an urban or rural campus, are less likely to be vaccinated than non-Hispanic White students on urban campuses. Second, students on rural campuses, regardless of race and ethnicity, are less likely to be vaccinated than non-Hispanic White students on urban campuses. Third, non-Hispanic Black students, regardless of health major, are less likely to be vaccinated than non-Hispanic White students in a health major. Fourth, for both urban and rural locations, as well as being in a health major or not, Hispanic students had higher odds of being vaccinated than non-Hispanic Black students, at a level close to that shown for non-Hispanic White students.
Low vaccine coverage among rural residents can be due to vaccine availability and/or issues of vaccine access. In Arkansas, vaccines were provided through a network of ADH local health units, clinical providers, and pharmacies in all 75 counties, coordinated through ADH. In addition, the ADH Office of Health Equity developed and implemented programs to provide vaccines for racial and ethnic minority groups. 23 Even with these efforts, vaccines may not have been easily available to all residents of certain rural areas. Even where vaccines were available, people in rural areas may have had barriers to vaccine access, possibly because of lack of transportation to vaccination sites; however, because Hispanic people living in rural areas had higher odds of being vaccinated than non-Hispanic Black people living in rural areas, some barriers may be specific to non-Hispanic Black rural residents. Our findings show race to be an independent determinant of being vaccinated, in both urban and rural areas. Previous studies have documented the general mistrust of the health care system, and specifically vaccines, in non-Hispanic Black communities.24,25 This finding is further supported by our results that showed lower odds of being vaccinated among non-Hispanic Black students compared with non-Hispanic White students, even in health majors, after controlling for other factors.
Another important finding is the effect of college type on the likelihood of being vaccinated in urban versus rural areas. The odds of being vaccinated were lower among students who attended rural community colleges than among students who attended urban community colleges, who had the same (in spring 2021) or higher (in fall 2021) odds of being vaccinated compared with students who attended urban 4-year colleges. Again, access to vaccines may be the likely explanation. The concentration of pharmacies and clinical providers is greater in urban areas than in rural areas and could contribute to this finding.
It is encouraging to see a slight increase, between the spring and fall 2021 semesters, in the likelihood of non-Hispanic Black students being vaccinated in both urban and rural areas relative to non-Hispanic White students in urban areas. However, even by the end of the fall semester, the racial disparity persisted. The improvement in disparity is consistent with a study that showed that, although the intention of non-Hispanic Black individuals to be vaccinated was initially comparable to that of non-Hispanic White individuals, that intention increased more rapidly among non-Hispanic Black individuals as the pandemic continued. 26
Increasing vaccination rates was a challenge even before the COVID-19 pandemic. Since 2021, efforts to improve COVID-19 vaccine uptake, particularly among racial and ethnic minority groups, have increased in the United States. In Arkansas, several projects were put in place to reduce disparities in COVID-19 vaccination.23,27 In addition, ADH, in collaboration with the Fay W. Boozman College of Public Health of the University of Arkansas for Medical Sciences, worked closely with all higher education institutions and ADHE, providing weekly information sessions to higher education institution points of contact as well as assistance with vaccination campaigns on campuses, specifically working with Historically Black Colleges and Universities. However, our results show that, although some improvement in vaccination rates occurred during the study period, continued efforts are needed among this young but important population segment. More work needs to be done, including the use of social media—which has been shown to have the potential as a platform for public health interventions to address vaccine hesitancy 28 —in addressing students’ fears and misconceptions about vaccines as well as making vaccines more available and accessible on and near campuses.
Limitations and Strengths
Our study had some limitations. First, this was a secondary data analysis, and we had access only to the variables collected by ADHE, thus limiting our ability to control for other potential covariates. Second, for the same reason, we could not divide students by residence (out-of-state students, students living at home, students in student housing on or off campus). Third, we did not have data on levels of face mask use on campuses and the effect that this use may have had on transmissions and, thus, the likelihood to seek vaccination in the face of that threat. Fourth, we had no data on individual vaccine exemptions. Fifth, some of the differences in vaccinations for health major students may have been due to some schools requiring students in health programs in clinical settings to be vaccinated, and we did not have data on this requirement; however, this factor would not explain racial differences among health major students. Finally, we had to limit our analyses to public higher education institutions because no data were available for some private higher education institutions.
Some of the limitations were mitigated by study strengths. First, to our knowledge, this is the only analysis of linked statewide datasets. Second, we obtained access to the full student enrollment roster for all public higher education institution campuses in the state, as well as to the statewide immunization registry; therefore, our analysis was based on a large dataset composed of the entire population of interest and not a sample. Third, these data were not self-reported, including the immunization information, which was legally required to be reported to ADH. Fourth, we excluded private higher education institutions, thus avoiding any potential bias due to religious affiliations in private higher education institutions. Finally, we were able to control for several potential confounders of the probability of vaccination, such as race and ethnicity, rurality, and other factors and their interactions. These strengths increase our confidence in the validity of the data and our findings and conclusions.
Conclusions
Much work is still needed to increase COVID-19 vaccine acceptance among students in public institutions of higher education. We suggest that novel approaches for tailored messaging and interventions to facilitate vaccine uptake may be needed for groups less likely to accept COVID-19 vaccine, such as non-Hispanic Black students and students in rural areas, compared with their counterparts.
Footnotes
Disclaimer
The views expressed in this article are those of the authors and not necessarily those of the Arkansas Department of Health.
Declaration of Conflicting Interests
The authors declared no potential conflicts of interest with respect to the research, authorship, and/or publication of this article.
Funding
The authors received no financial support for the research, authorship, and/or publication of this article.