
Abstract
Objective:
New York City’s automated mortality syndromic surveillance system monitors temporal and spatial patterns in mortality. To describe the use of the syndromic surveillance system, we used the system to find mortality patterns for the 15 leading causes of death and for deaths from rare and reportable diseases in New York City from February 2015 through June 2020. We used results to find aberrations that indicate threats to public health.
Methods:
We used unobserved components models to analyze time series of mortality counts for leading causes of death, historical limits methods for rare and reportable diseases, and SaTScan for temporal–spatial cluster analysis. We obtained data on the number of deaths from the electronic death registry system maintained by the city’s Bureau of Vital Statistics.
Results:
The mortality syndromic surveillance system detected an increase in the number of deaths from heart disease by April 1, 2020, when 75.0 deaths occurred on March 24, 2020, instead of an expected 45.8 deaths (95% upper prediction limit of 61.0) and an increase in the number of deaths from all causes on March 20, 2020, when 194.0 deaths were observed while 150.1 deaths were expected (95% upper prediction limit of 178.0). The number of deaths from all causes returned to normal the week beginning June 14, 2020, when 990.0 deaths were observed and 998.8 deaths were expected.
Practice Implications:
When compared with efforts from New York City to provide yearly vital statistics, the automated mortality syndromic surveillance system can provide timely mortality data with fewer resources and raise the capacity to detect anomalous increases in mortality.
After catastrophic events such as hurricanes Katrina and Sandy and with the increased fear of bioterrorism, pandemic influenza, and emerging infectious diseases, the awareness of threats to the overall health of the public has increased.1-4 Along with emergency department syndromic surveillance systems, an interest in near–real-time surveillance of mortality data has emerged to identify possible disease outbreaks or other public health events.
New York City publishes its vital statistics data yearly as aggregated summaries, with lags between occurrences and the published report. Historically, the lag reflected limitations in data acquisition because data on vital events were collected via paper-based registration. Since 2005, New York City’s Bureau of Vital Statistics, within the New York City Department of Health and Mental Hygiene (NYC DOHMH), has used an electronic death registry system (EDRS) to facilitate record keeping and analysis and to issue death certificates. During and after Hurricane Sandy in 2012, data from the EDRS were used to perform disaster-related mortality surveillance with 2 objectives: to determine the number of deaths directly related to the hurricane and to detect abnormal increases in counts of deaths from all causes of mortality in the days and weeks after the hurricane.5,6 Such surveillance was possible because of a mandate for timely acquisition of reported deaths, which resulted in rapid reporting of hurricane-related deaths and excesses in all causes of mortality. Although the surveillance was effective in rapidly identifying hurricane-related deaths, a substantial amount of time, effort, and coordination among multiple individuals was needed to extract data and perform statistical analyses.
With the noted limitations in identifying deaths after Hurricane Sandy, NYC DOHMH began developing an automated mortality syndromic surveillance system (MortalSS) to detect temporal and temporal–spatial anomalies in patterns of mortality in New York City. MortalSS has been in operation since February 2015. During the COVID-19 pandemic, MortalSS was run twice per day, first performing surveillance with all observed deaths and then removing COVID-19 deaths to assess abnormalities in other causes of death (CODs), such as heart disease or pneumonia and influenza. We present details of the system, along with statistical methodology, so that other jurisdictions can implement similar local mortality surveillance.
Methods
Death Registration
Data on deaths in MortalSS are from the EDRS; until 2020, New York City reported 95% of all known deaths electronically, with the remaining 5% being reported on paper certificates. In April 2020, 100% electronic reporting was mandated.7,8 Since 2010, New York City has mandated that death certification by a clinician or medical examiner occur within 24 hours of the death. 9 The mandate also stipulated that adding demographic and other personal information must be completed within 72 hours of death to enable registration by NYC DOHMH. COD is reported in 4 primary text fields and 1 secondary text field. An automated system, SuperMICAR, developed by the National Center for Health Statistics, processes the text from these fields and assigns International Classification of Diseases, 10th Revision (ICD-10) codes.10,11 If an ICD-10 code cannot be assigned by the automated system, a nosologist in the Bureau of Vital Statistics will manually code the certificate. The SuperMICAR system can successfully code approximately 80% to 85% of certificates.
Previously, the New York City reporting system did not allow death certificates to be transferred from the EDRS to MortalSS for analysis until ICD-10 codes were assigned. Early in the COVID-19 pandemic, novel COVID-19 was not a code included in SuperMICAR; therefore, data entry personnel had to manually code deaths from COVID-19, leading to delays in ICD-10 coding and, thus, inducing a lag in data used for surveillance. The delays in death identifications prompted procedural modifications on April 7, 2020, which authorized death certificates without ICD-10 coding to be transferred to MortalSS.
MortalSS automatically defines COD by using ICD-10 codes for underlying CODs and contributing CODs and by matching keywords in the free-text COD fields. MortalSS conducts mortality surveillance on the 15 leading CODs in New York City, as well as premature mortality (deaths among people aged <65 y), mortality from all causes, and deaths from acute myocardial infarction.
MortalSS also conducts surveillance on deaths caused by >90 rare and reportable diseases or syndromes (related diseases consolidated for analytic purposes). A new ICD-10 code, U071, is used for deaths related to COVID-19. Deaths are considered confirmed COVID-19 if they are linked to a laboratory-confirmed positive SARS-CoV-2 test result; they are considered probable if the death certificate lists COVID-19 or equivalent in any COD field but the death was not yet linked to a positive SARS-CoV-2 test result. Probable deaths could become confirmed if deaths were later linked to a positive SARS-CoV-2 test result.
For analysis of mortality due to pneumonia and influenza, MortalSS includes a near–real-time estimate of the severity level for any given influenza season (ie, mortality due to pneumonia and influenza in New York City typically increases in late December). The institutional review board of NYC DOHMH determined this activity as not human subjects research because it involved only data from decedents and, thus, waived review.
Statistical Analysis
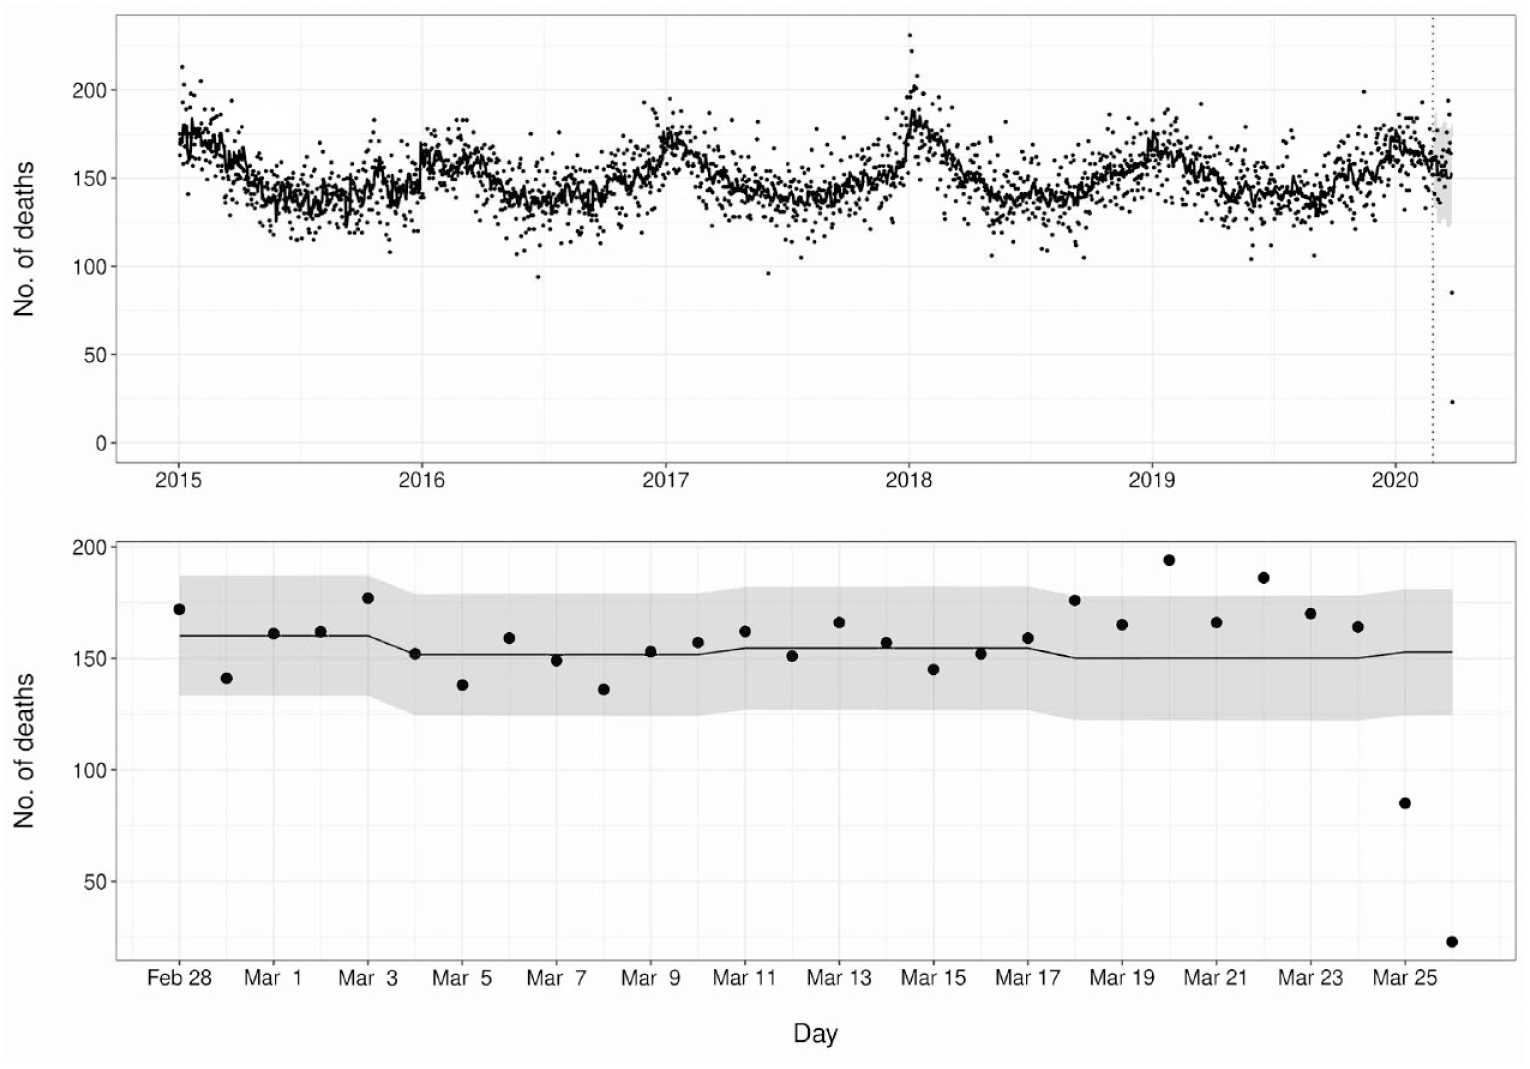
We performed temporal analysis for anomaly detection, defined as daily or weekly counts for a specific COD greater than the upper 95% prediction limit, among the leading CODs in New York City by using structural time-series models, which are also known as unobserved components models (UCMs). 12 With these additive models, we can decompose a unitary time series into the underlying processes of trend, seasonality, cycles, and irregular components by using the following equation:
where µ t is trend, γ t is a seasonal component, ψ t represents any cycles of different duration than 1 year, and ε t is the irregular (error) component that is normally and independently distributed with variance σε 2 . Components can be time constant or time varying. We can formulate UCMs from a family of models called Gaussian state space models through the use of 2 equations: (1) a measurement equation, which contains the component estimates and their variance at a specific time point (t) and relates the response at time t to the component vector, and (2) a transition equation, which provides a rule that updates the model from one time point to the next.13,14 We used the Kalman filter in an iterative process at each time point to obtain parameter estimates of the components and to perform the update procedure. From historical data, the Kalman filter can generate one-step-ahead forecasts, with prediction intervals based on SE estimates.14,15 We incorporated seasonality and trend directly in the additive model to allow it to be tested and visualized. We used the procedure UCM feature in SAS version 9.4 (SAS Institute Inc) to implement these methods. We performed Kalman filtering with the Kalman filtering and smoothing algorithm or the diffuse Kalman filtering and smoothing algorithm based on whether the initial component state vector was diffuse.13-15
For mortality surveillance, we used vital statistics data to aggregate cause-specific mortality counts at the daily and weekly levels. For weekly analysis, we included seasonality as trigonometric functions with a 52-week season; for daily analysis, we used 52-week blocks. All other components in the UCM can be time varying for maximum flexibility. The model for the weekly analyses includes 6 years of historical time-series data but excludes the most recent 8 weeks so that accrual lag will not affect model forecasts, thus forecasting an 8-week window from that point to the present week. We compared observed mortality counts from 2 weeks before the week of analysis with expected counts and the 95% upper limit of prediction. We selected this time point to avoid a lag in death reporting while keeping the analysis timely. We considered observed counts greater than the 95% upper limit of prediction as an anomaly. We analyzed the daily mortality counts during a 28-day forecasted window.
We used SaTScan version 9.4 (Martin Kulldorff and Information Management Services) for cluster analysis. MortalSS automatically performs prospective analysis using the space–time permutation scan statistic to identify temporal–spatial clustering of deaths from all leading CODs, deaths from acute myocardial infarction, deaths from all causes, and premature deaths. The algorithm constructs cylinders of varying base diameter and height based around a geographical centroid. In the construct, the cylinder base is the geographical area under consideration, and the height is proportional to time. We can then compare the observed mortality counts inside the cylinder with the expected mortality counts in the rest of the geographical units during the same time. We used SaTScan versions 9.4-9.7 to analyze a 45-day window using the zip code of the decedent’s residence as the geographical centroid, with P ≤ .05 considered significant. We mapped the results, with data for clustered cases automatically extracted and manually inspected for further commonalities, such as age or other CODs.
With the temporal analyses of time-series data of leading CODs to detect anomalies and the temporal–spatial analyses to detect any clustering at the zip code level from MortalSS, we graphed any resulting geographic clusters using choropleth maps. We performed all analyses and completed graphical outputs using the UCM procedure in SAS version 9.4 and the tidyverse and plotly packages in R version 3.3.2 (R Foundation for Statistical Computing).16,17 We used the Proc R macro to submit and execute R code from within SAS. 18
Communicating Data
MortalSS generates automated email reports to share analytic results with engaged community members. The report contains a web-based dashboard with separate tabs for (1) interactive time-series graphs for all leading CODs, (2) interactive choropleth maps generated as a result of clustering in disease-specific mortality, and (3) frequency tables of deaths from rare and reportable diseases and leading CODs. The interactive time-series graphs show data from the entire historical period and the forecast window with 95% prediction intervals; the graphs include radio buttons for different time divisions, allowing users to zoom to just the forecast window, year-to-date, or year-over-year time frames. Text shown when hovering displays observed deaths, forecasted deaths, and the upper 95% prediction interval for any given day. Interactive maps allow users to zoom in or out and move the map while including hover text that shows the zip code and the number of deaths in the cluster. NYC DOHMH created the dashboard in R using the flexdashboard package version 0.6.1 (RStudio) and the maps using the leaflet package version 2.0.1 (RStudio). This dashboard has been shared with other divisions within NYC DOHMH.
For our analyses, we included results from 2015 through June 2020, with selected surveillance findings presented during a pre–COVID-19 period, from February 15, 2015, through March 10, 2020, and during COVID-19, from March 11 through June 16, 2020.
Results
During the pre–COVID-19 period, there were 275 540 deaths in New York City, with a weekly mean (SD) of 1045.4 (79.7), a minimum weekly number of 888.0, and a maximum of 1351.0 deaths. During the COVID-19 period, the weekly mean (SD) number of deaths from all-cause mortality was 2894.4 (2265.4), with a minimum weekly number of 990.0 and a maximum of 7862.0 deaths.
Temporal Analysis Results Pre–COVID-19
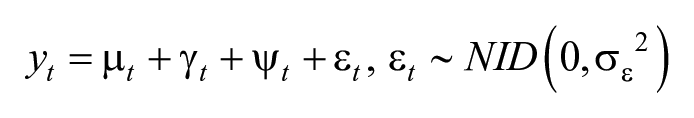
In the third week of January 2018, MortalSS detected elevated influenza mortality, with 85.0 deaths that week when only 51.9 deaths were expected, which exceeded the 95% upper prediction limit of 70.3 (Figure 1). This marked increase in mortality from pneumonia and influenza continued for the next 2 weeks until February 2018. During the 2019-2020 influenza season, the period immediately before COVID-19, mortality was not unusually elevated. By March 9, 2020, mortality from pneumonia and influenza was below predicted levels since February 12.
Number of deaths from pneumonia and influenza (top) and heart disease (bottom) in New York City, January 1, 2013, through February 9, 2018. Data points indicate the daily mortality counts. Dashed vertical line indicates the beginning of the prediction window, with the curve to the left indicating model training and the curve to the right indicating predicted values. Gray ribbons indicate 95% prediction limits.
Coinciding with the high mortality associated with the 2017-2018 influenza season, New York City also experienced an elevated number of deaths from heart disease in the beginning of 2018. An elevated number of deaths from heart disease occurred during each of the first 2 weeks of January 2018 as compared with measurements in the 6 years before 2020. The highest weekly total was 448.0 deaths, which exceeded the 95% upper prediction limit of 437.3, when only 384.9 deaths were expected (Figure 1).
Temporal Analysis Results During COVID-19
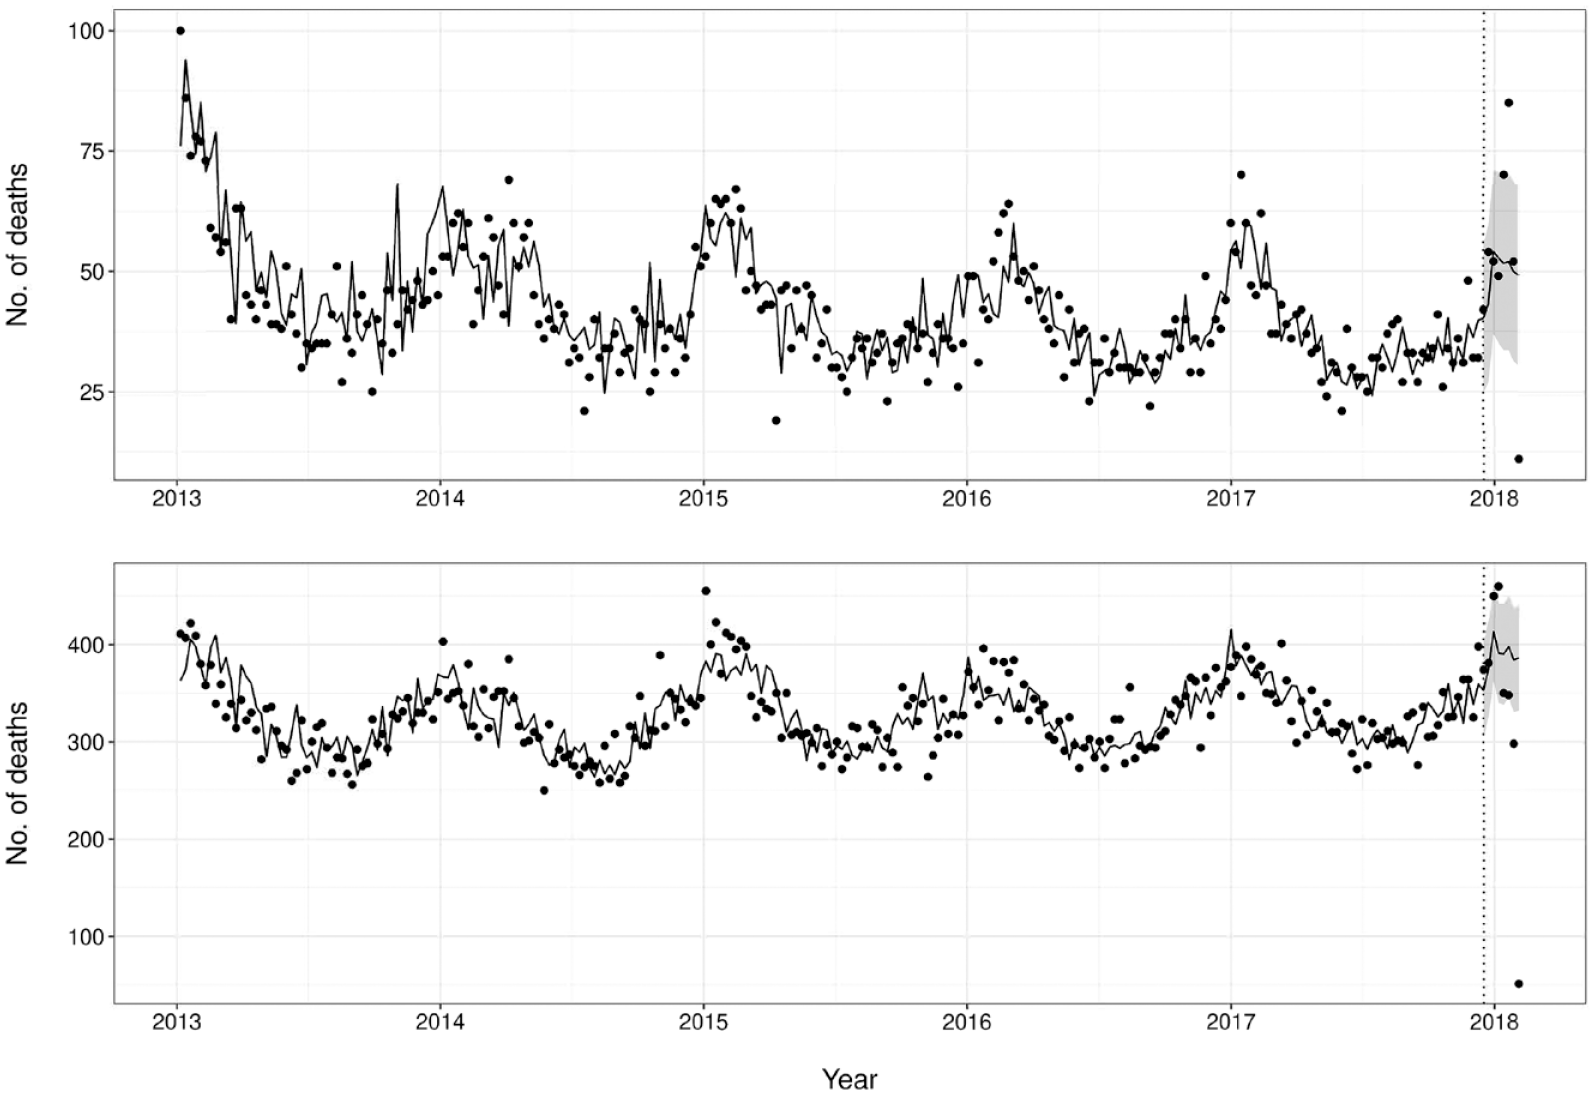
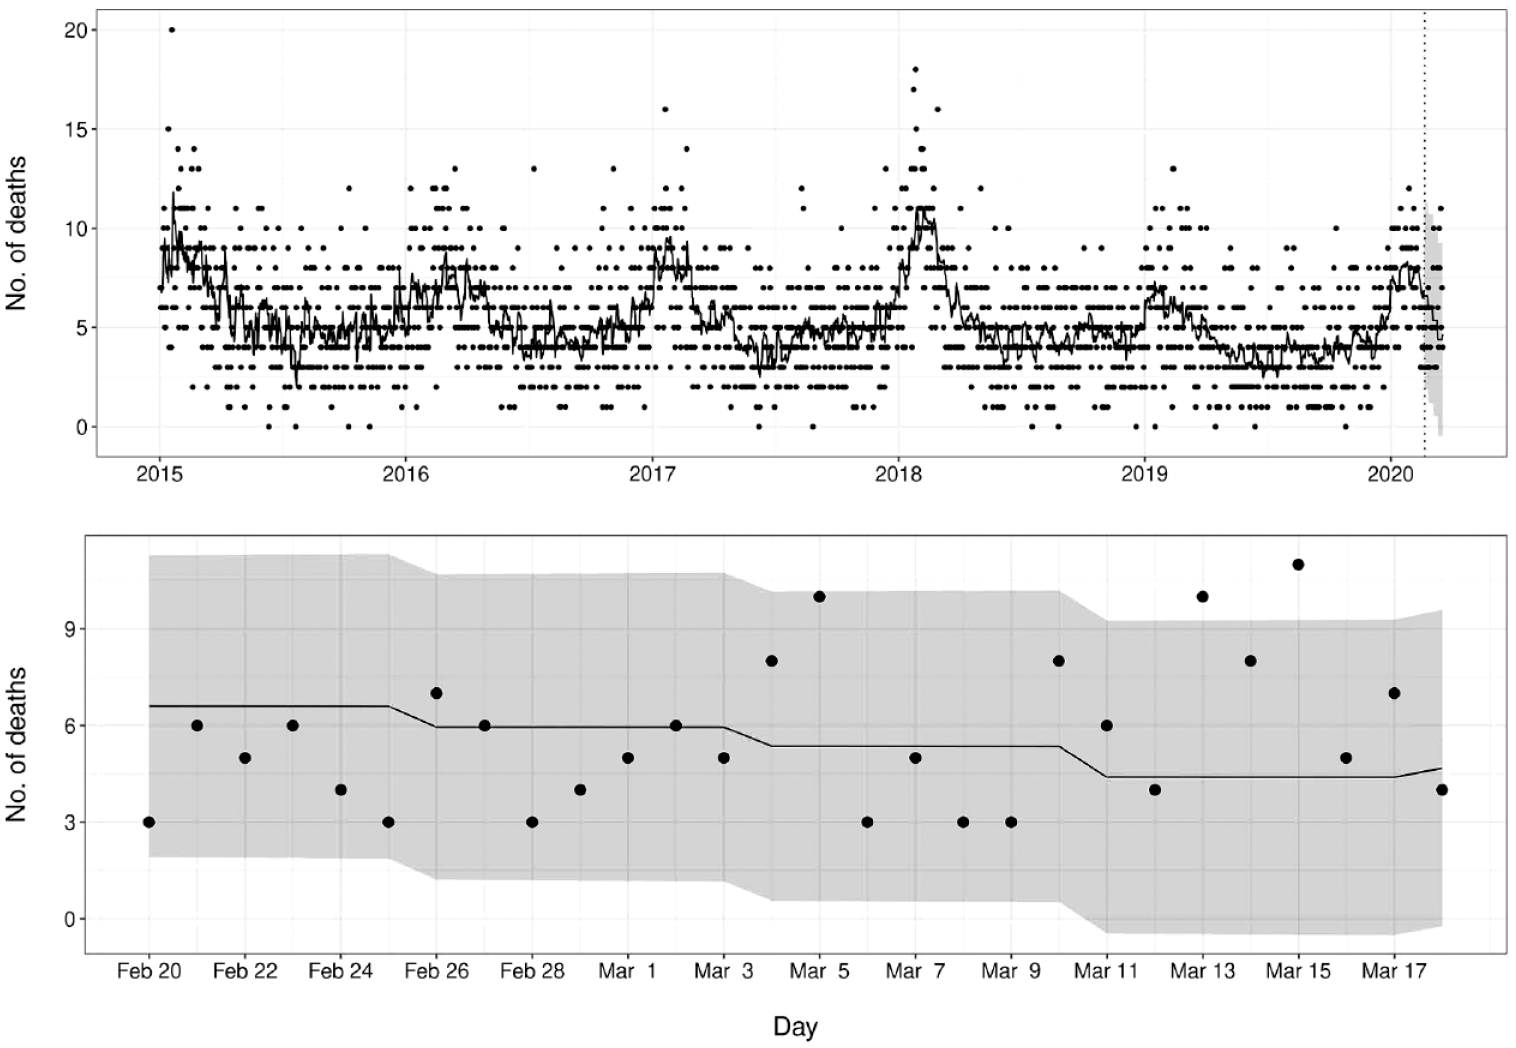
During the COVID-19 period, the first significant increase in cause-specific mortality was detected for pneumonia and influenza deaths. By March 23, 2020, the number of deaths from pneumonia and influenza for 7 of 9 days was above predicted values, with 2 days above the 95% upper prediction limit. On March 15, 2020, 11.0 deaths occurred when 4.4 deaths were expected (95% upper prediction limit of 9.3) (Figure 2). The first sustained increase in mortality from all causes during the pandemic became evident on March 28, 2020, with 8 successive days of number of deaths above predicted values and 2 days above the 95% upper prediction limit beginning on March 20, 2020. On March 20, 2020, 194.0 deaths were observed when 150.1 deaths were expected, exceeding the 95% upper prediction limit of 178.0 (Figure 3). After the procedural change to the EDRS on April 7, 2020, to include unregistered deaths without ICD-10 coding in the database, it became evident that increased mortality above the 95% upper prediction limit occurred as early as March 18, 2020.
Number of deaths from pneumonia and influenza in New York City, January 1, 2015, through March 23, 2020. Data points indicate the daily mortality counts. Dashed vertical line indicates the beginning of the prediction window, with the curve to the left indicating model training and the curve to the right indicating predicted values. Bottom panel shows enlargement of predicted values from top panel. The gray ribbon indicates 95% prediction limits.
Number of deaths from all causes of mortality in New York City, January 1, 2015, through March 28, 2020. Data points indicate the daily mortality counts. Dashed vertical line indicates the beginning of the prediction window, with the curve to the left indicating model training and the curve to the right indicating predicted values. Bottom panel shows enlargement of predicted values from top panel. The gray ribbon indicates 95% prediction limits.
At approximately the same time, an increase in mortality from heart disease was also detected. By April 1, 2020, there were 3 successive days with significantly increased heart disease mortality beginning on March 22, 2020. The highest mortality among these days was on March 24, 2020, with 75.0 observed deaths when 45.8 deaths were expected, which exceeded the 95% upper prediction limit of 61.0 (Figure 4).
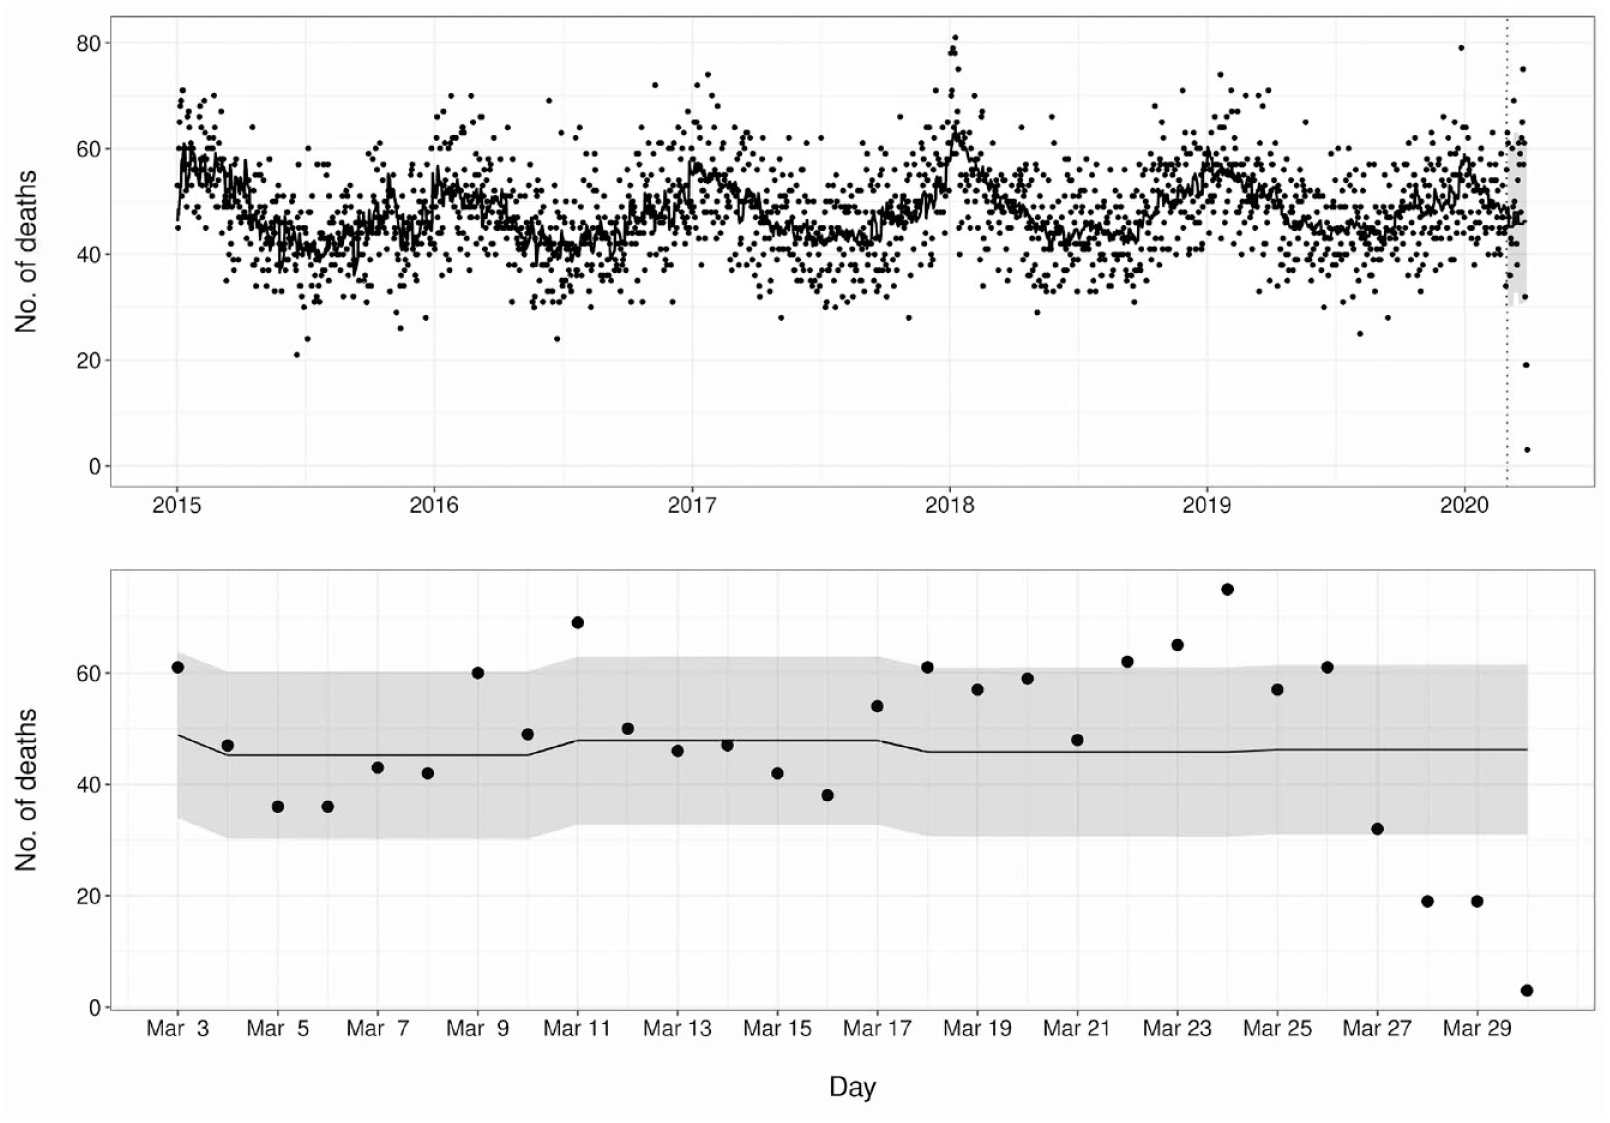
Number of deaths from heart disease in New York City, January 1, 2015, through April 1, 2020. Data points indicate the daily mortality counts. Dashed vertical line indicates the beginning of the prediction window, with the curve to the left indicating model training and the curve to the right indicating predicted values. Bottom panel shows enlargement of predicted values from top panel. The gray ribbon indicates 95% prediction limits.
Temporal–Spatial Clustering Results Pre–COVID-19
With temporal–spatial clustering analysis, we detected a cluster in March 2015 that comprised 8.0 accidental deaths identified in 3 contiguous zip codes during a 2-week period when only 2.5 deaths were expected, for a relative risk of 3.24 (P < .001). Investigation of this cluster revealed that a house fire in one of the zip codes had killed 7 members of a family in a single household.
We also discovered a cluster of 7.0 deaths from acute myocardial infarction in 2 zip codes on Staten Island during a 2-week period in April 2015. These 7.0 deaths exceeded the 1.6 expected deaths, resulting in a relative risk of 4.37 (P = .06), with 6.0 deaths occurring in a single zip code. Although this result was not statistically significant, we decided to investigate further. Inspection of these deaths revealed that they all occurred in a single institution, all with similarly completed certificates. The institution reported approximately 80% of its deaths with the underlying COD as heart disease, and acute myocardial infarction was listed as the underlying COD in 43% and 56% of deaths in 2014 and 2015, respectively.
Discussion
The yearly timescale that New York City uses to disseminate vital statistics data in an aggregated report of finalized data does not allow for the rapid identification of changes in mortality patterns or outbreaks that may indicate threats to public health or the need for swift intervention. To identify elevated mortality due to leading CODs such as influenza or outbreaks of rare and reportable diseases, timely data acquisition, near–real-time analysis, and timely dissemination of any actionable signals are needed, with the understanding that provisional surveillance data were used. The transition of death registration and reporting in New York City from paper certificates to an EDRS in 2005 made near–real-time mortality surveillance possible. Since its implementation, MortalSS has provided such surveillance for >100 CODs and temporal–spatial surveillance for selected CODs. MortalSS is fully automated, from direct acquisition of EDRS data through multiple analytic frameworks; it can disseminate results through graphs, reports, and emails; and it has greatly reduced the person-time that was previously necessary to perform mortality surveillance.
Through MortalSS, we were able to determine when all-cause mortality increased because of COVID-19 and to detect early increases in the number of deaths from pneumonia and influenza and heart disease during the pandemic. After the start of COVID-19, NYC DOHMH implemented a subtle yet important change in how the EDRS includes unregistered deaths (ie, before ICD-10 coding) in MortalSS. This change facilitated surveillance of all-cause mortality during the COVID-19 pandemic and will continue to do so.
We were also able to identify increased mortality from all causes and from heart disease that lasted several days during winter 2017-2018. During this same season, we were able to follow a peak in influenza mortality that coincided with data from emergency department surveillance. 19 We also found MortalSS useful in identifying issues related to data quality, thus allowing timely interventions of these issues to improve the quality of COD reporting, as it has been shown to have systematic errors.
Limitations
Our study had 4 limitations. First, even while using an EDRS and having mandatory reporting rules, we noted an approximate 2-week delay in full and accurate cause-specific mortality counts; after inclusion of unregistered deaths, however, the delay in counts of all-cause mortality was reduced to 2 to 3 days. This delay was slight compared with the yearly reporting of mortality statistics and can still be considered near–real-time surveillance. Second, mortality surveillance is generally limited by the accuracy of COD reporting on death certificates. The Bureau of Vital Statistics has made efforts to increase the accuracy of COD reporting in New York City; however, given the large number of entities that provide information on COD and disposition of the deceased, challenges remain.20,21
Third, although MortalSS generates an average of 1 or 2 emails per day, no system is in place within NYC DOHMH to systematically trace signals after data are disseminated to community members. Future enhancements could incorporate a systematic verification of alarms against independent data sources. Integration of the New York City emergency department syndromic surveillance system and MortalSS, for example, would allow for more systematic verification of signals in the future.
Fourth, a substantial impediment to creating a mortality surveillance system is the timely acquisition of accurate provisional data in an electronic format that allows for automation of data analysis. The groundwork for MortalSS began far before its conception with the development of the first EDRS at NYC DOHMH. Electronic systems allow for direct data extraction into analytic software in near–real time. The Bureau of Vital Statistics is working to improve MortalSS accuracy by educating physicians responsible for death certification on COD reporting. MortalSS developments have required the determination of analytic methods from a wide range of algorithms appropriate for near–real-time anomaly detection in mortality time series, as well as for temporal–spatial clustering. Once selected, developments were driven by generalizing analytic programs for automation; creating data flows from data acquisition from EDRS; conducting data analyses with multiple software packages; and, finally, disseminating results through data visualization, report generation, and email distribution. In New York City, developments were accelerated because of sharing of resources and experiences from the previous development of the New York City emergency department syndromic surveillance system created after the terrorist attacks on September 11, 2001.
Practice Implications
With full automation, the current implementation of MortalSS has greatly reduced the staffing resources needed to run and maintain the system. The system can perform aggregate analyses of >100 CODs in New York City in approximately 30 to 60 minutes; before MortalSS, such analyses would have taken much longer and covered far fewer CODs. In addition to mortality reporting and surveillance, the system can now perform temporal–spatial cluster analysis. MortalSS can perform weekly cluster analysis of mortality in New York City at the zip code level, thus providing more timely and geographically smaller results than the city’s yearly aggregate mortality reports. The ability to match keywords in the text of the COD fields has created a wide net to capture any mention of diseases that may not have proper ICD-10 codes as underlying causes after being assessed by SuperMICAR. The structure and framework of MortalSS have also allowed ease in adding surveillance for emergent diseases or CODs as needed. Finally, a major strength of the system comes from the dedicated work by staff to increase the quality of COD reporting, including efforts to increase the quality of death certificate data by outreach and education of those certifying deaths. While many jurisdictions do not have all of the necessary resources, we believe jurisdictions that have electronic registry systems could implement local mortality surveillance similar to MortalSS.
Footnotes
Acknowledgements
SaTScan is a trademark of Martin Kulldorff. SaTScan software was developed under the joint auspices of Martin Kulldorff, the National Cancer Institute, and Farzad Mostashari of the New York City Department of Health and Mental Hygiene.
Declaration of Conflicting Interests
The authors declared no potential conflicts of interest with respect to the research, authorship, and/or publication of this article.
Funding
The authors disclosed receipt of the following financial support for the research, authorship, and/or publication of this article: This work was supported in part by the Urban Areas Security Initiative.