
Abstract
Objective:
Spatial clustering of undervaccination leads to increased risk of vaccine-preventable diseases. We identified spatial clustering of undervaccination patterns among children aged <24 months in Montana.
Methods:
We used Montana’s immunization information system data to analyze deidentified vaccination records of children aged <24 months born from January 2015 through November 2017. We measured 3 outcomes that were not mutually exclusive: not completing the combined 7-vaccine series by age 24 months, having an undervaccination pattern indicative of parental hesitancy, and having an undervaccination pattern indicative of structural barriers to timely vaccination. Using geomasked residential addresses, we conducted separate Bernoulli spatial scans with a randomization P < .01 to identify spatial clusters consisting of ≥100 children for each outcome and calculated the relative risk of having the undervaccination pattern inside versus outside the cluster.
Results:
Of 31 201 children aged <24 months included in our study, 11 712 (37.5%) had not completed the combined 7-vaccine series by age 24 months, and we identified 5 spatial clusters of this outcome across Montana. We identified 4 clusters of undervaccination patterns indicative of parental vaccine hesitancy, all in western Montana. The cluster with the largest relative risk (2.3) had a radius of 23.7 kilometers (n = 762 children, P < .001). We also identified 4 clusters of undervaccination patterns indicative of structural barriers, with 3 of the largest clusters in eastern Montana.
Conclusion:
In Montana, different strategies to increase routine and timely childhood vaccination are needed in distinct areas of this large and predominantly rural state. Immunization information system data can pinpoint areas where interventions to increase vaccination uptake are needed.
In the United States, the present rate of national and state coverage for most childhood vaccinations is high relative to historical averages. 1 However, high vaccination rates at a state level can mask low vaccination rates in smaller geographic areas, such as counties or communities. Localized outbreaks of vaccine-preventable diseases, such as measles and pertussis, have occurred in communities with low vaccination coverage.2-4 Parental vaccine hesitancy is one contributor to undervaccination: an estimated 10% to 25% of US parents choose to get their children some vaccinations but not others (“selective” 5 vaccination) or to spread out vaccines across visits (“shot-limiting” 6 ).7-9 However, a lack of immunization providers or long travel distances are also barriers to timely vaccination, particularly in rural and medically underserved areas.
To address growing concerns about vaccine hesitancy and vaccine-preventable disease outbreaks, the Centers for Disease Control and Prevention (CDC) has called for small-area analyses to identify hot spots of undervaccination and to uncover barriers to vaccination. 10 In particular, CDC has advocated for the increased use of immunization information system (IIS) data to pinpoint geographic areas with low vaccination coverage. 10 IISs are centralized databases managed by state or large city public health jurisdictions. Records from across immunization providers are aggregated, allowing them to make point-of-care vaccination recommendations based on patients’ immunization histories. 11 IIS data are also used for population-based analyses to inform strategies for increasing vaccination, such as identifying population subgroups with low vaccine uptake. 12
Montana is the fourth-largest US state in geographic size and the eighth-smallest state in population size. 13 Similar to other predominantly rural states, Montana has childhood vaccination rates that are lower than the national average. 14 In this study, we conducted spatial scan analyses using geomasked residential address data and deidentified vaccination records from Montana’s IIS to identify spatial clusters of children aged <24 months with undervaccination patterns. Our primary outcome of interest was noncompletion of the combined 7-vaccine series by age 24 months. We also investigated whether patterns of undervaccination indicative of parental hesitancy or indicative of structural barriers to timely vaccination (eg, lack of medical providers, not knowing when to bring child in for vaccinations, transportation) were spatially clustered.
Methods
Data Source and Cohort
We analyzed data from Montana’s IIS, ImMTrax. 15 The Montana Department of Public Health and Human Services created the study dataset in December 2019. The dataset included deidentified ImMTrax records from January 2015 through November 2019 for children born from January 2015 through November 2017. The records included a unique study identification number for each child, the child’s birth year, and the child’s age in days at each vaccination. We identified vaccines by using standard codes in IIS for vaccination type and brand. We excluded children who had vaccinations recorded only before their first birthday. We applied this exclusion criterion because IISs do not routinely track children who move out of state; therefore, a child with vaccinations recorded only before their first birthday may have moved before being eligible to receive measles–mumps–rubella (MMR) and varicella vaccinations, which are recommended when children are aged 12-15 months. Had we not applied this exclusion criterion, we may have incorrectly classified some children with no visits after their first birthday as never having received MMR or varicella vaccinations. We also excluded children with only influenza vaccinations, data anomalies (eg, records of vaccines not approved for children), missing or out-of-state addresses, or military base addresses. We applied this latter criterion because of the concern of incomplete IIS histories for children residing at a military base.
To ensure anonymity and data privacy, study analysts were blinded from vaccination records while acquiring residential address data. Using a separate dataset with children’s addresses, we determined neighborhood deprivation index (NDI), rural–urban commuting area (RUCA) code, proximity to nearest immunization provider, and a county-level measure of primary care provider density. We calculated NDI as a census tract–level measure using 2014-2018 American Community Survey data 16 ; higher values indicate more socioeconomically deprived areas. 17 RUCA is a census tract–level measure of rurality calculated by population density and commuting data.18,19 To quantify accessibility to vaccination services, we acquired a list of all Montana pediatric and family medicine primary care providers in 2020 from the WIM (Wyoming Idaho Montana) Tracking Company. 20 We used Google’s distance matrix API (application programming interface) to calculate driving distances from children’s residences to the nearest primary care provider. Finally, we calculated a provider density variable as the number of primary care providers per 1000 children, using 2014-2018 American Community Survey data on the number of children aged 0-5 years per county. 16
The University of Montana Institutional Review Board approved this study (no. 8-19) under the exempt category of review in accordance with applicable federal law (CFR part 46, §104[d], category 4) pertaining to secondary research, for which consent is not required.
Geomasking
To ensure data confidentiality, we geocoded (latitude, longitude) and geomasked each address by using a random perturbation method so that each address was indistinguishable from the nearest 100 children. Specifically, we blurred addresses from their actual locations by using 2010 US Census Bureau census block–level population density estimates. 21 We thus allowed the tendency for urban locations to be moved shorter distances than rural locations to protect the identity of children in the dataset. We then linked the geomasked addresses with the vaccination dataset for analyses. We found that about 16% of addresses were post office boxes. We did not geomask these addresses, but we used them in our analyses. We conducted a sensitivity analysis with post office boxes excluded to determine whether identification of clusters changed.
Vaccination Outcome Measures
Our primary outcome was failure to complete the combined 7-vaccine series among Montana children by age 24 months. The combined 7-vaccine series is a standard metric for tracking coverage across multiple vaccinations: diphtheria–tetanus–acellular pertussis (4 doses), poliovirus (3 doses), MMR (1 dose), hepatitis B (3 doses), Haemophilus influenzae type b (3 or 4 doses, depending on brand), varicella (1 dose), and pneumococcal conjugate (4 doses). 14
We also studied 2 additional outcomes: whether the child had an undervaccination pattern indicative of (1) parental hesitancy and (2) structural barriers to timely vaccination. The immunization schedule established by the US Advisory Committee on Immunization Practices recommends that children receive multiple vaccinations at ages 2, 4, 6, 12-15, and 15-18 months. Children who do not receive recommended vaccinations in the recommended month or interval are considered late and accrue days undervaccinated until the vaccination is received.22-25 Prior surveys have validated that certain deviations from the schedule reflect parents’ choices to refuse, delay, or spread out vaccinations.26,27 Therefore, we defined the outcome of an undervaccination pattern indicative of parental hesitancy to include restrictive shot-limiting, where the child had at least 6 immunization visits with ≤3 vaccines per visit; episodic shot-limiting, where the child had 1 immunization visit with ≤2 vaccines before age 15 months and no more than 2 visits with ≥3 vaccines; or selective vaccination, where the child started some but not all 7 vaccinations in the combined 7-vaccine series.5,6,22
Structural barriers to vaccination also hinder adherence to the recommended immunization schedule. Such barriers include transportation, health care provider scarcity in some areas, and a lack of systems to remind parents to bring children in for vaccinations.28,29 We defined the outcome of an undervaccination pattern indicative of structural barriers to include (1) missing doses, meaning that the child had started all 7 vaccinations but was missing doses needed for completion of multidose series, and (2) receiving all doses, but some or all were late, meaning that the child had completed the combined 7-vaccine series by age 24 months but had fallen behind at some point (ie, had ≥1 day undervaccinated). 22
The 2 additional outcomes (patterns indicative of parental hesitancy and structural barriers) were mutually exclusive; however, each overlapped with the outcome measure of failure to complete the combined 7-vaccine series. In prior work, we described the prevalence of and overlap between these outcomes in Montana IIS data. 22 Briefly, for the outcome of an undervaccination pattern indicative of parental hesitancy, all children with selective vaccination did not complete the combined 7-vaccine series. In our prior work, we showed that 71% to 75% of children with a shot-limiting pattern also did not complete the combined 7-vaccine series by age 24 months. 22 For the outcome of an undervaccination pattern indicative of structural barriers, all children who were missing doses from multidose vaccine series did not complete the combined 7-vaccine series; however, children who received all doses, but some or all were late, did complete the combined 7-vaccine series by age 24 months. In this study, we extended our previous work by identifying spatial clustering of these undervaccination outcome measures.
Spatial Scan Analyses
Spatial scan analyses use likelihood-based techniques to identify clusters of people who differ significantly in some outcome measure from people outside the cluster. 30 The method first constructs a likelihood function for a circular window of locations for the outcome. The larger the likelihood value, the less likely the outcomes in that window are to have occurred by chance. This function is maximized over all window locations and sizes, where windows with higher likelihoods are more likely to be clustered according to the outcome. 31 To assess whether a window constitutes a cluster, we used Monte Carlo likelihood ratio tests in conjunction with the Gumbel extreme value distribution. For a candidate cluster, we randomized the outcome values 999 times under a null hypothesis of no clustering, always conditioning on the total number of locations, and we recomputed the maximum likelihood ratio for each randomized dataset. 32 We then compared the Monte Carlo likelihoods with the actual window likelihood to determine a spatial cluster’s P value, which we adjusted to account for the multiple windows considered.31,33
Using geomasked address data, we conducted separate analyses for the 3 outcomes. For these binary measures, we used a Bernoulli scan to calculate the number of children with and without the outcome inside and outside a given circular window and calculated the likelihood corresponding to that spatial window.30,34 We mapped clusters with P < .01 and ≥100 children. We reported the geographic size of clusters in miles, the observed and expected number and percentage of children with the outcomes of interest within the cluster, and the relative risk (RR), which represents the magnitude of the higher rate versus lower rate of the undervaccination outcome for children residing inside versus outside the cluster.
For statistical analyses, we used the R rsatscan package version 4.0.3 and the SaTScan User Guide version 10.0 in R software (R Foundation for Statistical Computing), a front-end to the free SaTScan software (M. Kulldorff, National Cancer Institute, and F. Mostashari, New York City Department of Health and Mental Hygiene). 32 We used the analysis type “Purely Spatial” with a coordinate system (latitude, longitude), and we specified a Bernoulli model. We imposed a medium noncompactness penalty on the cluster shapes and a maximum radius of 50 km for an individual cluster to limit the size and shape of clusters. Finally, to avoid overlapping clusters and to optimize the trade-off between many small clusters and 1 large cluster, we requested the reporting of Gini clusters, a set that optimizes the Gini index. 32
Spatial scan analyses can also be used to identify clusters after adjusting for covariates by running the scan on the model deviance residuals resulting from a logistic regression model of the outcome on potential covariates. 32 As a sensitivity analysis, we compared unadjusted spatial scan analyses with analyses adjusted for birth year, RUCA level, NDI, driving distance to nearest immunization provider, and county-level primary care provider density. We used normal models for scans on residuals of models, adjusting for the effects of covariates. 35
Results
Of 36 505 children aged <24 months identified in the Montana IIS, 32 656 (89.5%) had ≥1 vaccination recorded after their first birthday. After exclusion of children with only influenza vaccinations (n = 326), data anomalies (n = 908), erroneous or out-of-state addresses (n = 144), and military base addresses (n = 77), the study cohort consisted of 31 201 children (Table 1).
Characteristics of children aged <24 months born during 2015-2017 in Montana in an analysis of spatial clustering of undervaccination patterns identified with immunization information system data
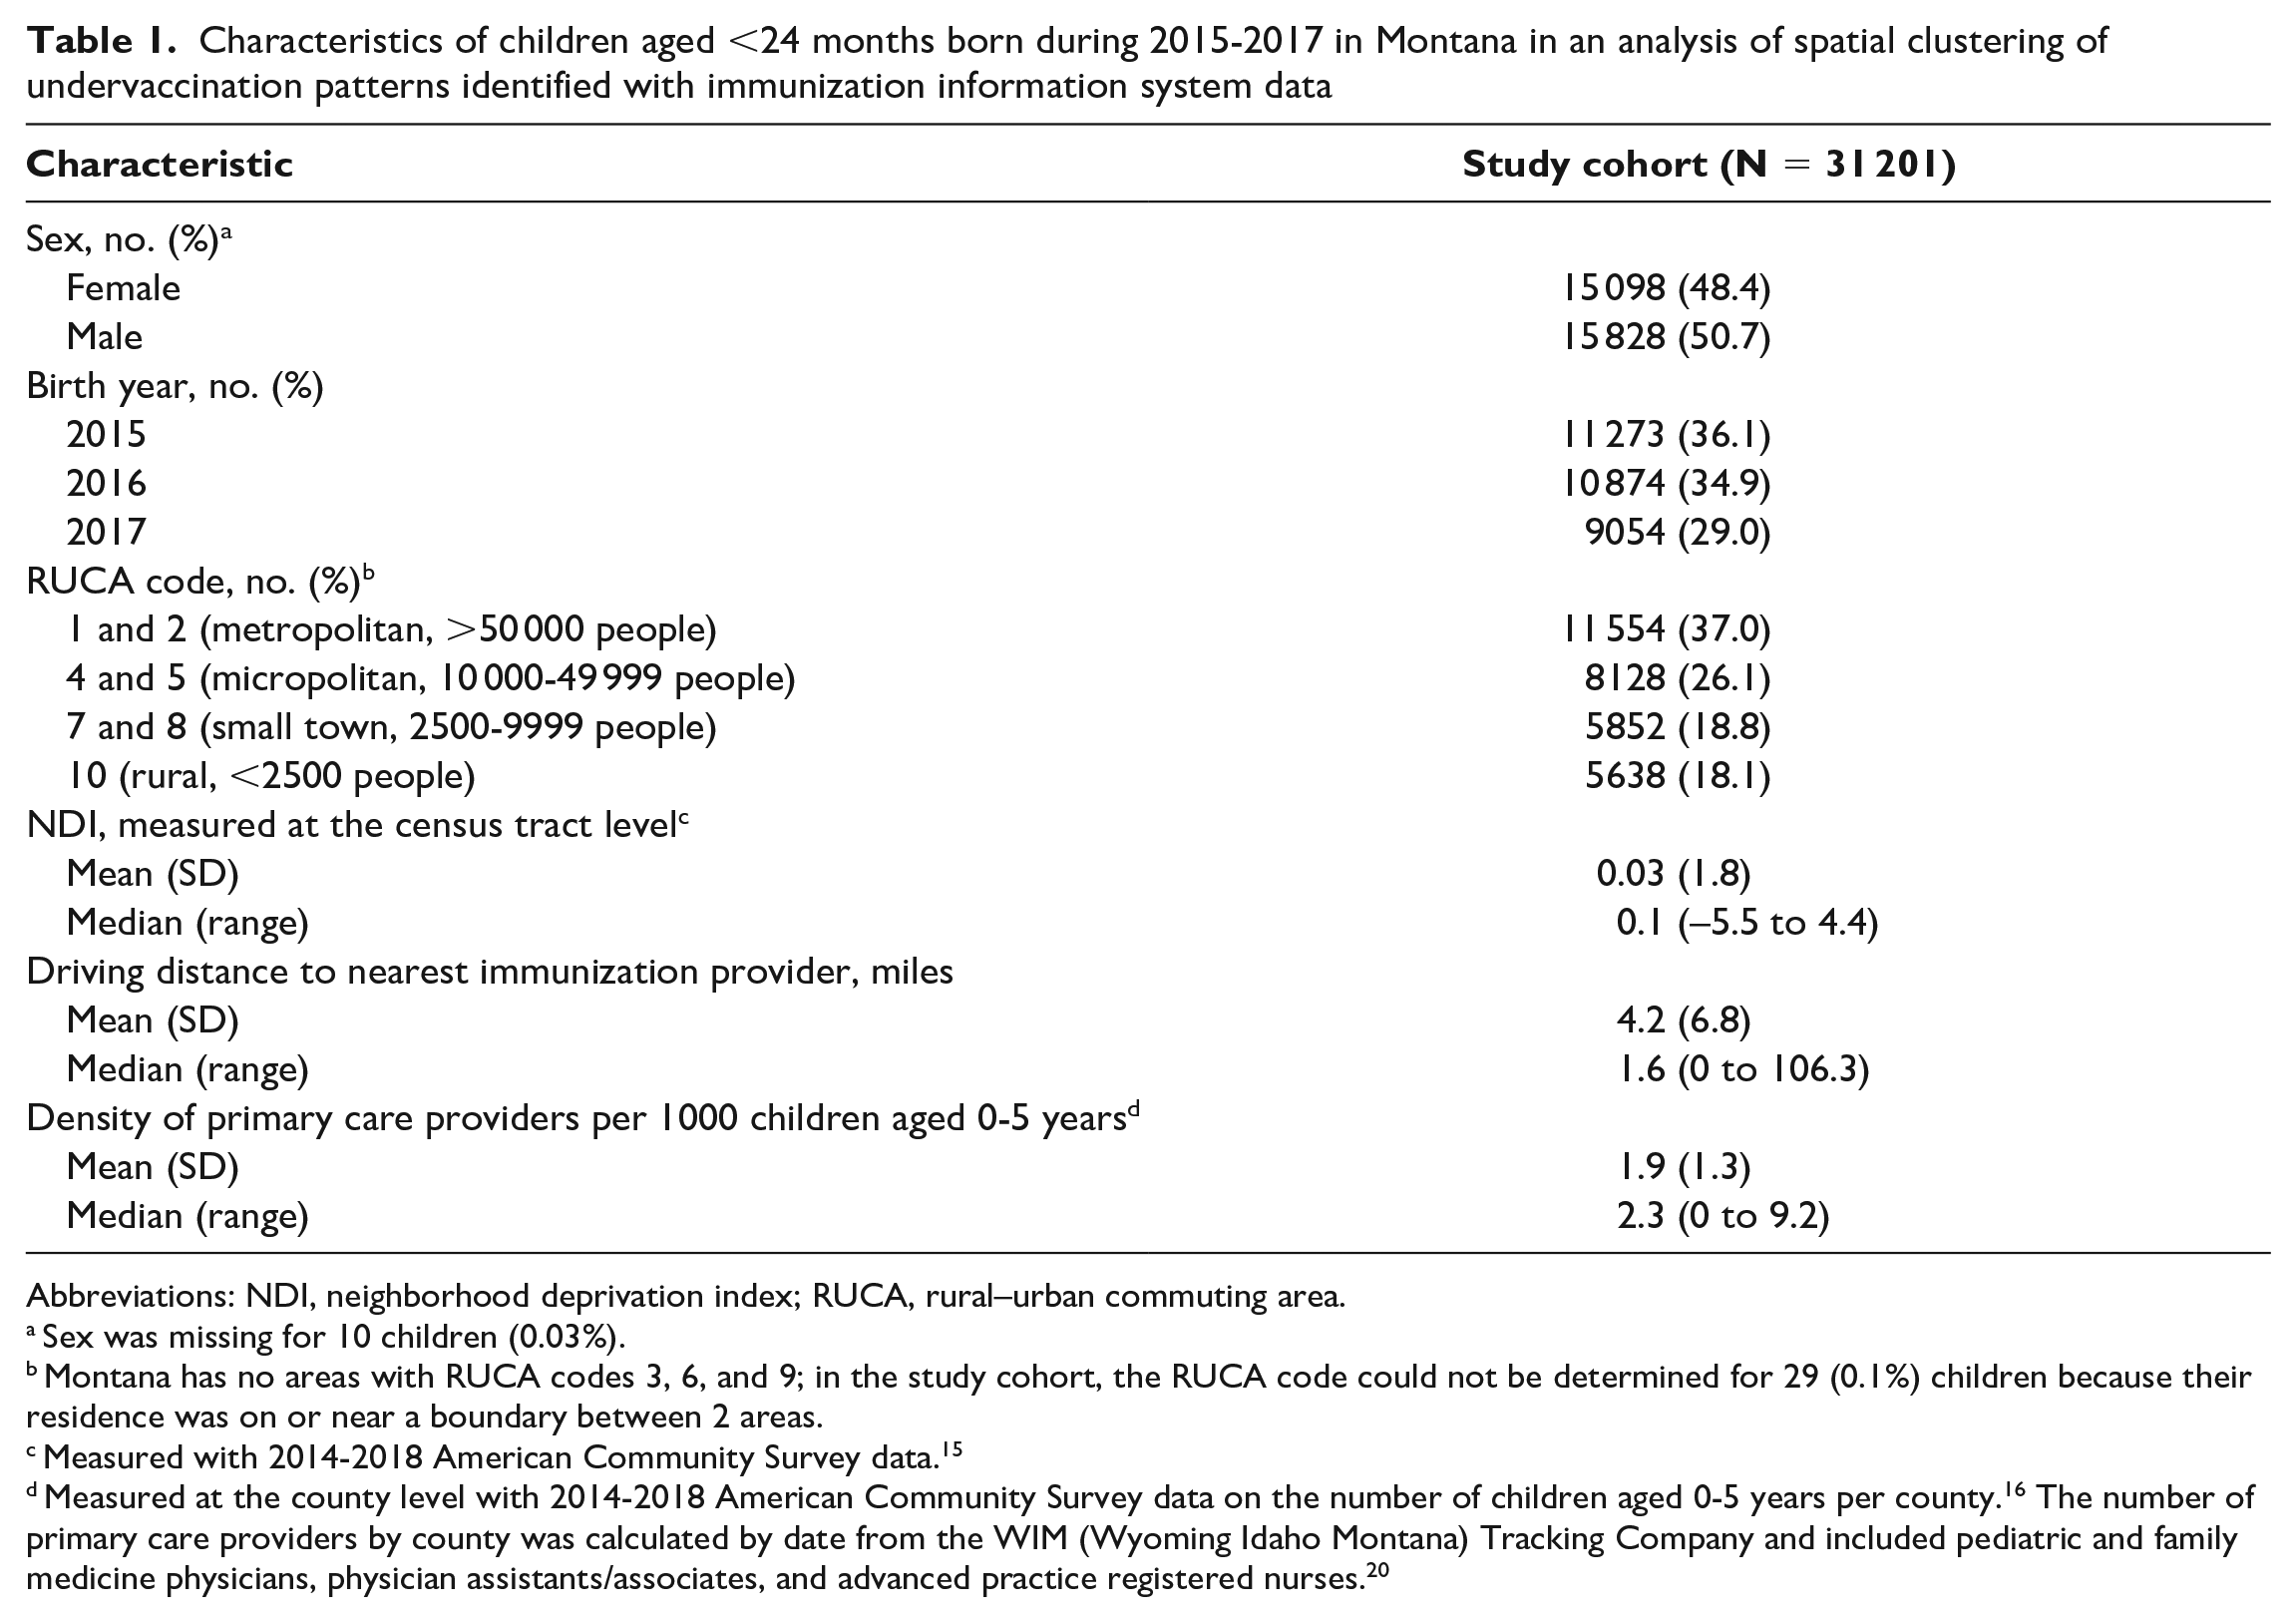
Abbreviations: NDI, neighborhood deprivation index; RUCA, rural–urban commuting area.
Sex was missing for 10 children (0.03%).
Montana has no areas with RUCA codes 3, 6, and 9; in the study cohort, the RUCA code could not be determined for 29 (0.1%) children because their residence was on or near a boundary between 2 areas.
Measured with 2014-2018 American Community Survey data. 15
Measured at the county level with 2014-2018 American Community Survey data on the number of children aged 0-5 years per county. 16 The number of primary care providers by county was calculated by date from the WIM (Wyoming Idaho Montana) Tracking Company and included pediatric and family medicine physicians, physician assistants/associates, and advanced practice registered nurses. 20
Of 31 201 children in the study cohort, 37.5% (n = 11 712) did not complete the combined 7-vaccine series by age 24 months. We identified 5 spatial clusters for this outcome (Figure 1, Table 2). Among children in the 5 clusters (n = 7498), 46.5% (n = 3483) did not complete the 7-vaccine series by age 24 months. For children not completing the combined 7-vaccine series inside versus outside a cluster, the RR ranged from 1.2 (cluster 5) to 1.6 (cluster 2). Of 11 712 Montana children with this outcome, 29.7% (n = 3483) resided in 1 of the 5 clusters.
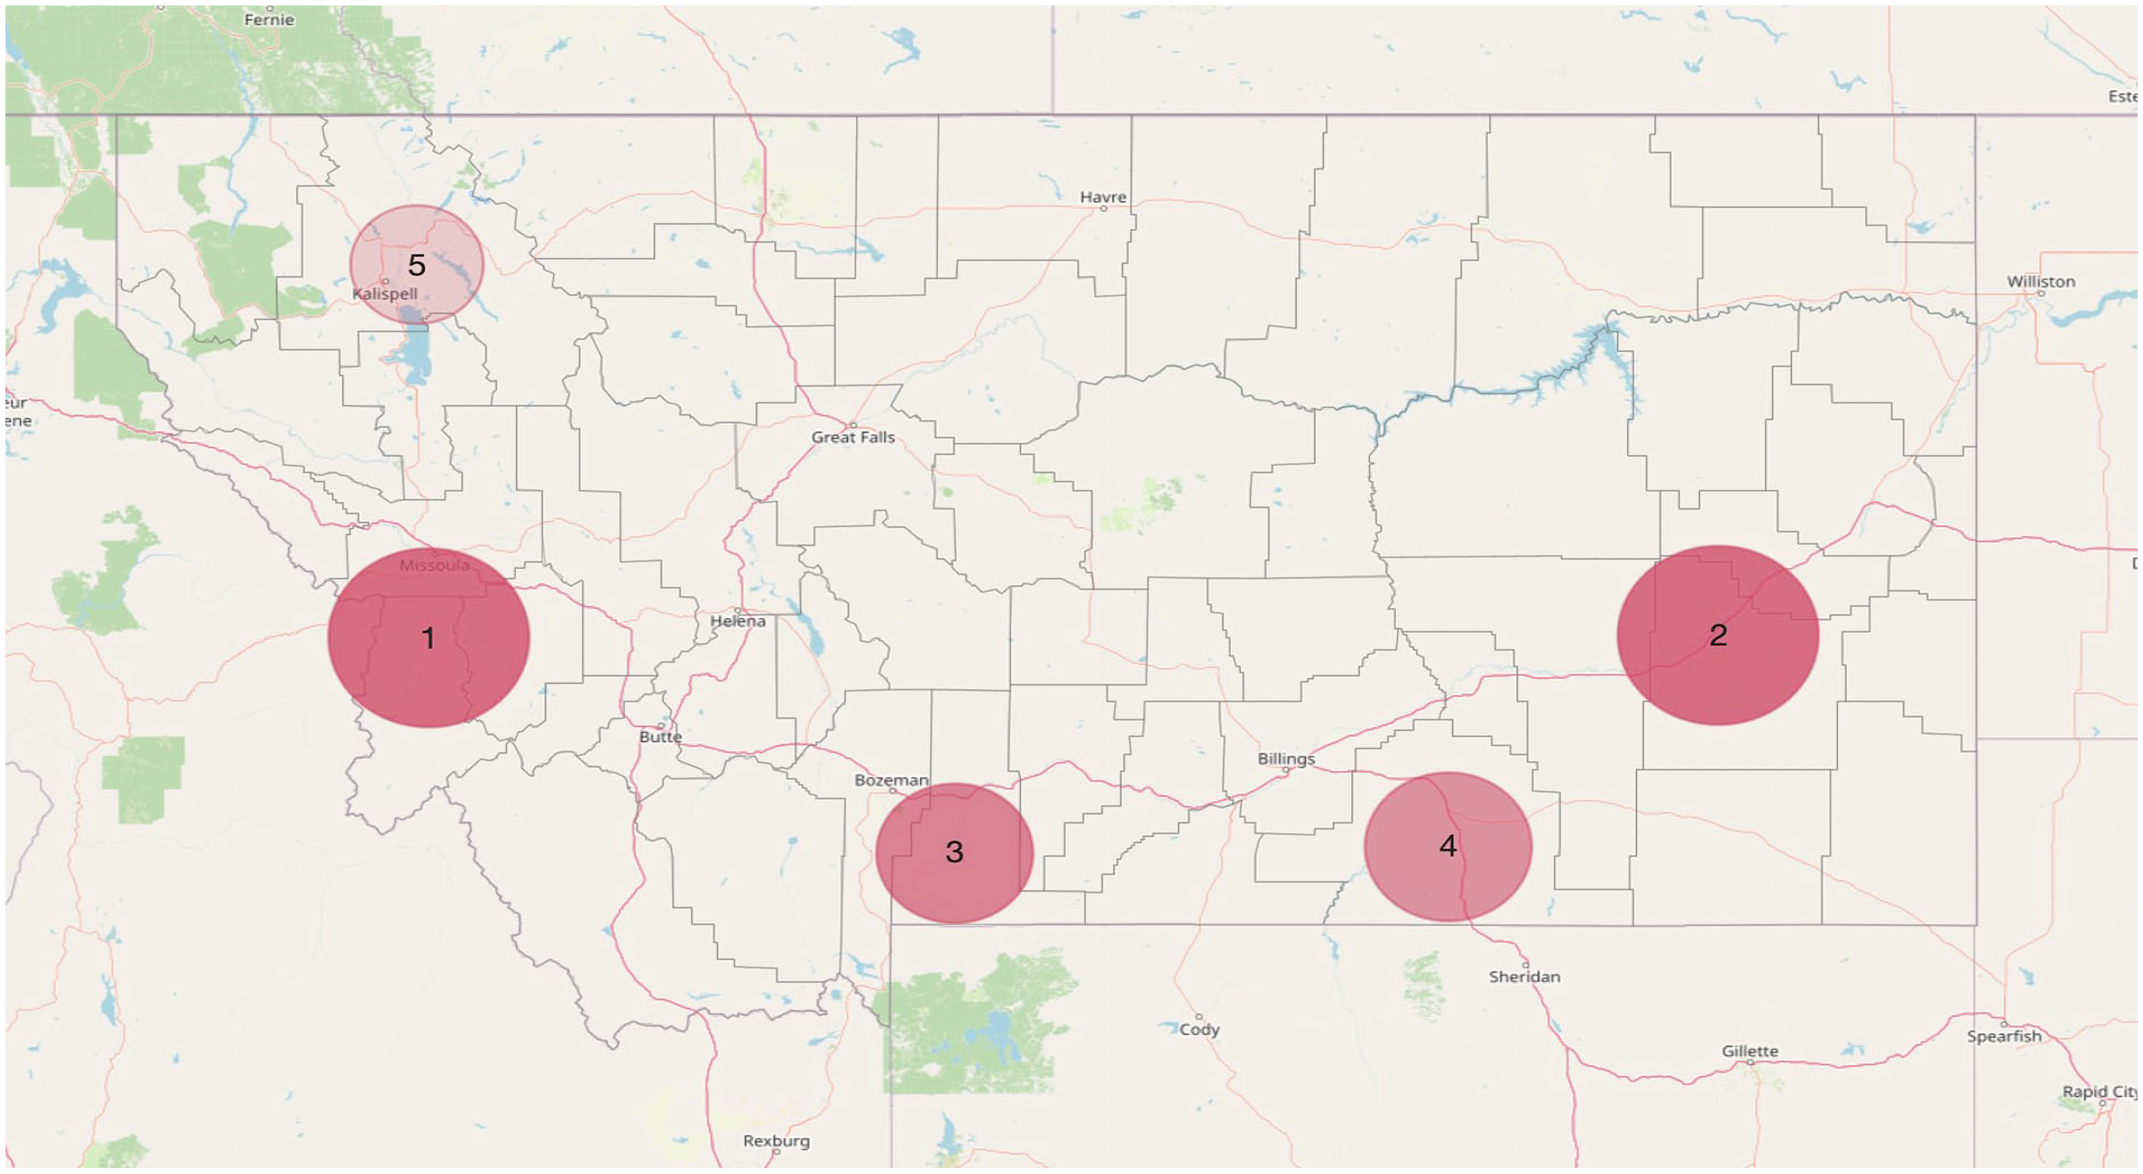
Spatial clusters of children born during 2015-2017 in Montana who did not complete the combined 7-vaccine series by age 24 months. Data were from Montana’s immunization information system for immunizations given from January 2015 through November 2019 for children born from January 2015 through November 2017. 15 Darker shading indicates higher levels of cluster significance (Bernoulli scan P values): cluster 1, P < 10−14; cluster 2, <10−13; cluster 3, <10−8; cluster 4, <10−7; cluster 5, .002.
Characteristics of spatial clusters identified through analysis of immunization information system data from children aged <24 months born during 2015-2017 in Montana
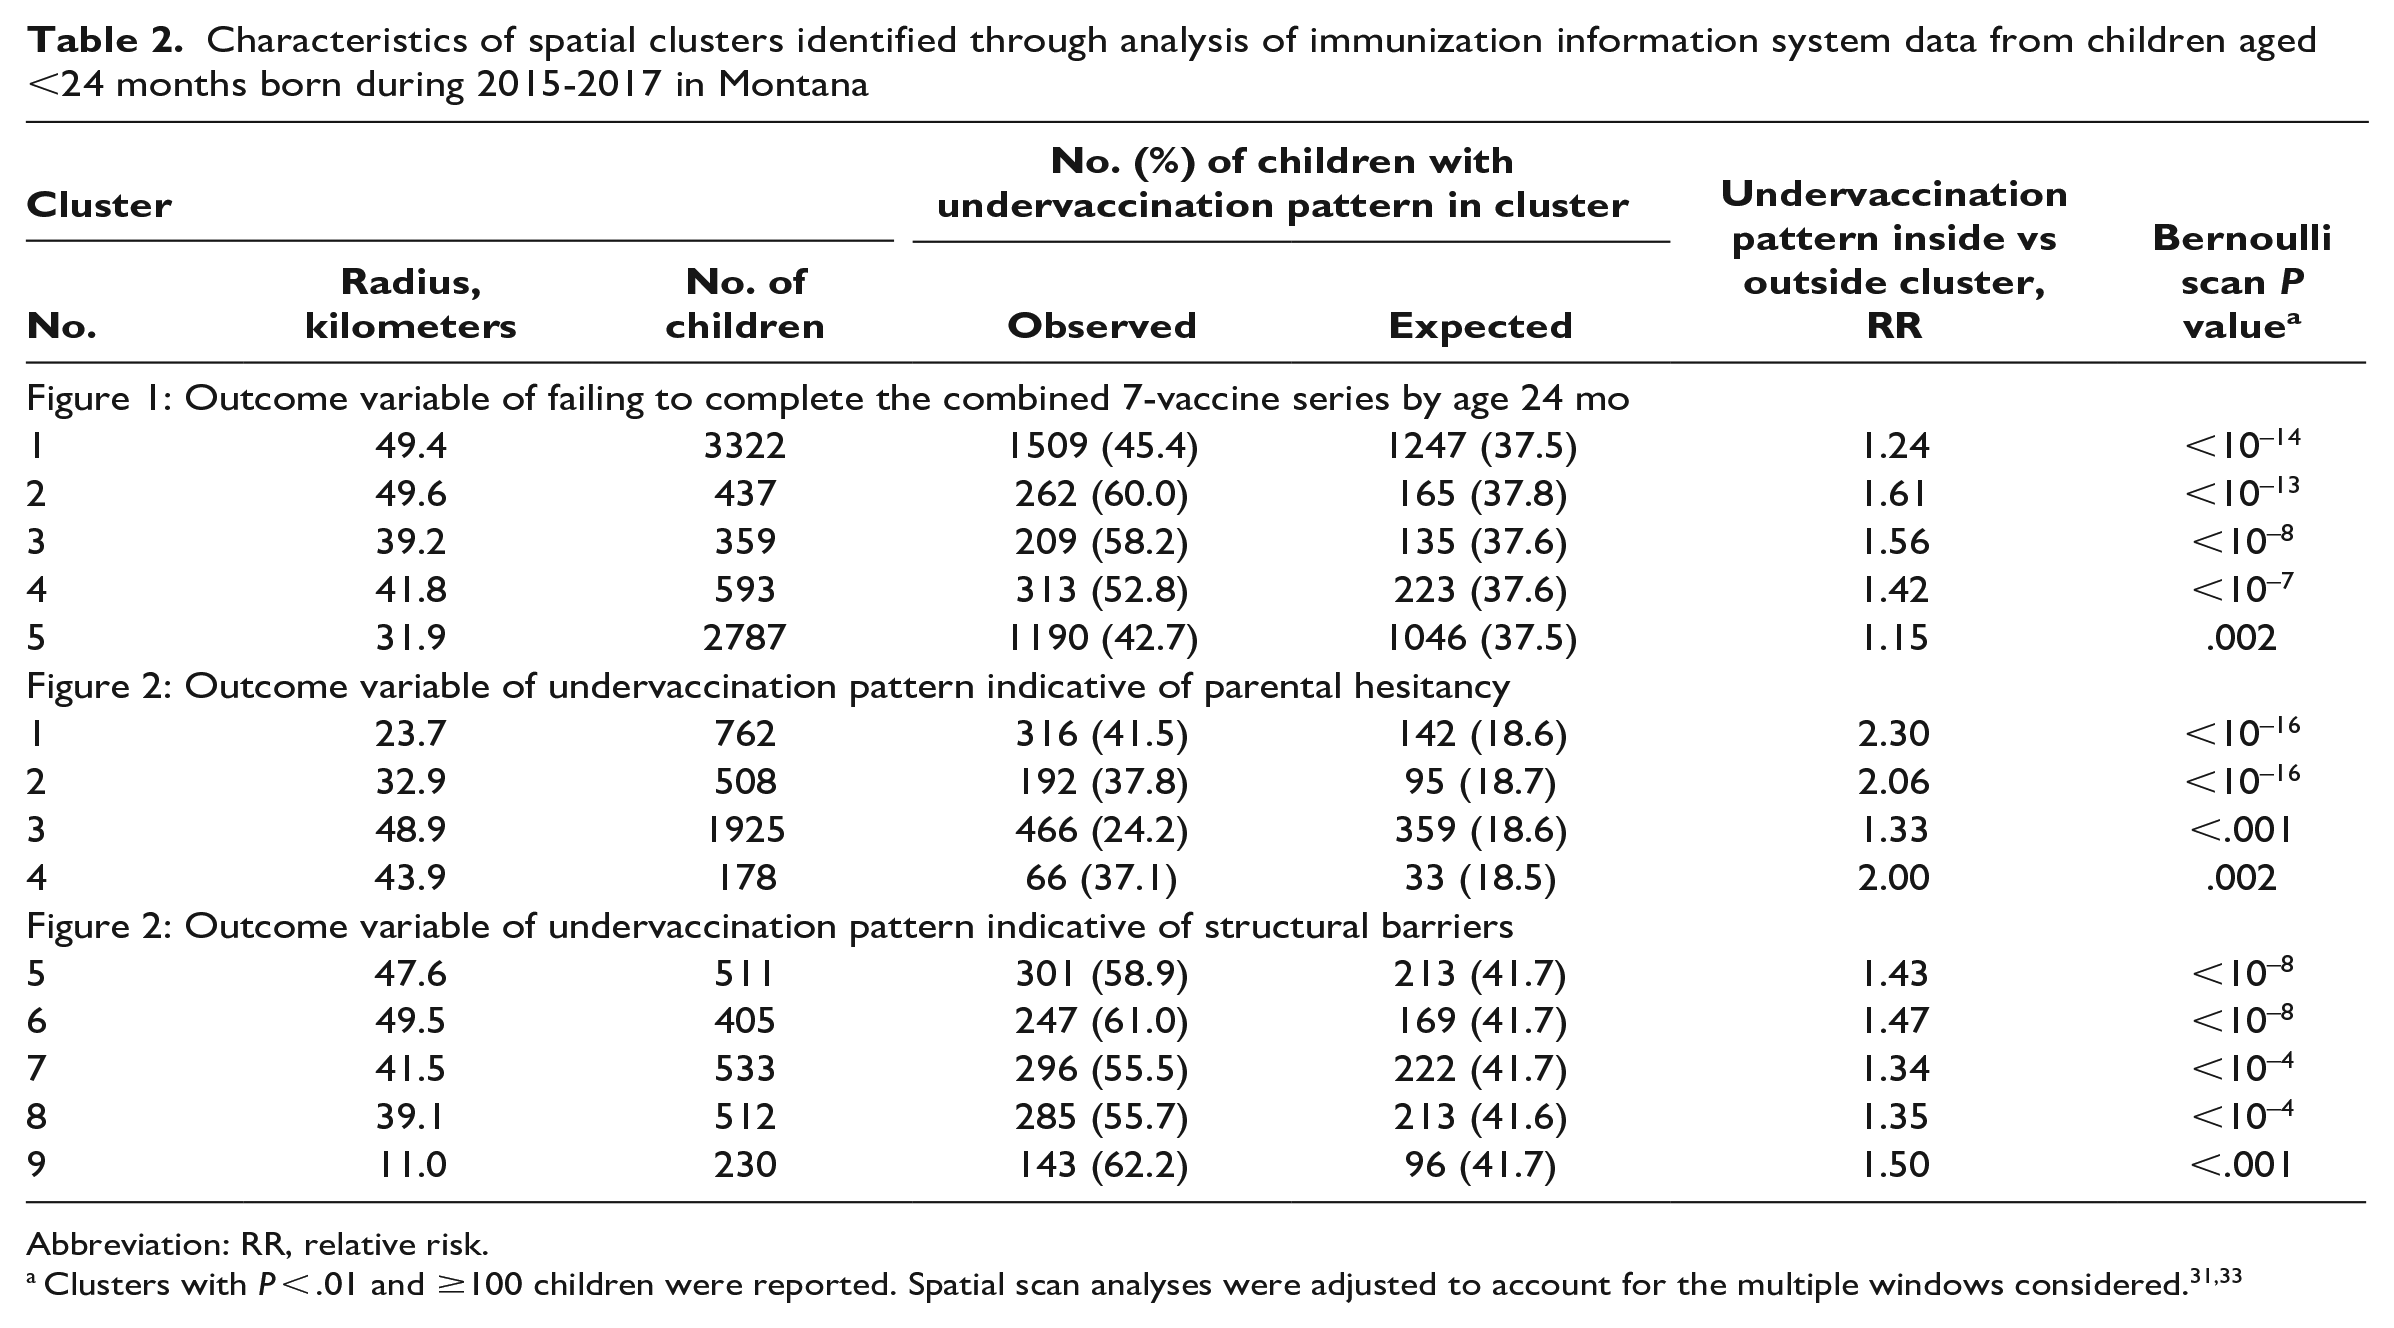
Abbreviation: RR, relative risk.
Of 31 201 children in the study cohort, 18.6% (n = 5813) had an undervaccination pattern indicative of parental hesitancy. We identified 4 spatial clusters, all in western Montana (Figure 2, Table 2). Of 3373 children who resided in the 4 clusters, 30.8% (n = 1040) had an undervaccination pattern indicative of parental hesitancy. For having an undervaccination pattern indicative of parental hesitancy inside versus outside a cluster, the RR ranged from 1.3 (cluster 3) to 2.3 (cluster 1). Of 5813 Montana children with this outcome, 17.9% (n = 1040) resided in 1 of the 4 clusters.
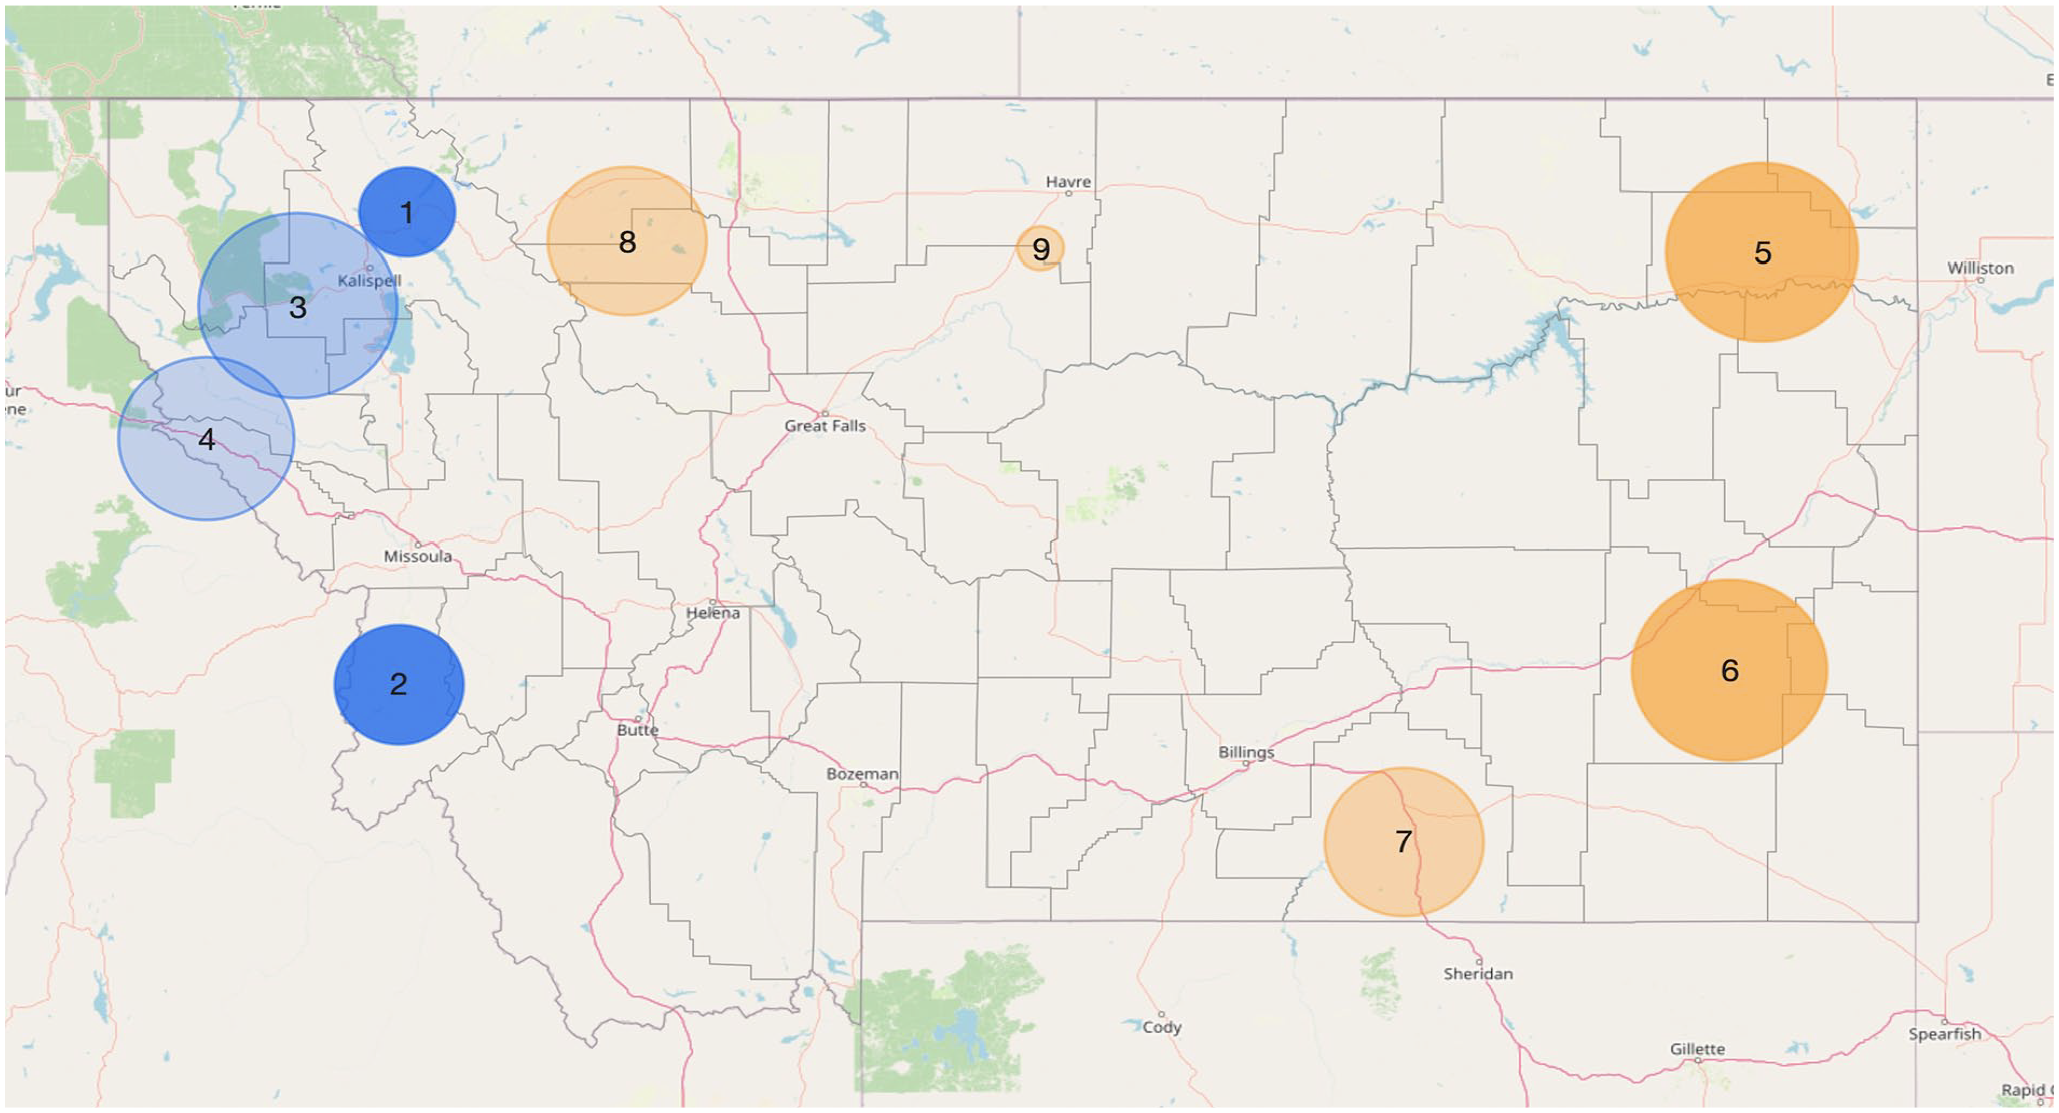
Spatial clusters of undervaccination patterns indicative of parental hesitancy (clusters 1-4; includes patterns of selective vaccination and shot-limiting) and structural barriers to vaccination (clusters 5-9; includes patterns of failing to complete multidose vaccine series and receiving ≥1 vaccine dose later than the ages recommended by the US Advisory Committee on Immunization Practices) among children born in Montana from January 2015 through November 2017. Darker shading indicates higher levels of cluster significance (Bernoulli scan P values): cluster 1, P < 10−16; cluster 2, <10−16; cluster 3, <.001; cluster 4, .002; cluster 5, <10−8; cluster 6, <10−8; cluster 7, <10−4; cluster 8, <10−4; cluster 9, <.001.
Of 31 201 children in the study cohort, 41.6% (n = 12 982) had an undervaccination pattern indicative of structural barriers to timely vaccination. We identified 5 spatial clusters; the 3 largest were in eastern Montana (Figure 2, Table 2). Of 2191 children who resided in the 5 clusters, 58.1% (n = 1272) had an undervaccination pattern indicative of structural barriers to timely vaccination. For having an undervaccination pattern indicative of structural barriers inside versus outside 1 of these clusters, the RR ranged from 1.3 (cluster 7) to 1.5 (cluster 9). Of 12 982 Montana children with this outcome, 9.8% (n = 1272) resided in 1 of the 5 clusters.
In the sensitivity analysis, when we adjusted for characteristics in Table 1, our results did not yield qualitatively different clusters from our unadjusted analyses. The sensitivity analyses with post office boxes removed also did not yield significant differences in spatial clusters.
Discussion
Most surveillance of US childhood vaccination coverage has been conducted at national, state, or county levels. However, infectious disease transmission is not limited to administrative boundaries, and clustering of undervaccinated people in small-scale geographic areas has contributed to past disease outbreaks.2-4 In this study, we demonstrated a novel application of spatial scan methodology with IIS data to identify geographic clusters with high rates of childhood undervaccination. Furthermore, our investigation of undervaccination patterns revealed opportunities for intervention to increase routine and timely childhood vaccination coverage in distinct geographic areas.
Interventions to address parental vaccine hesitancy fundamentally differ from interventions that address structural barriers to accessing immunization services.22,36 Interventions to address hesitancy involve building trust and addressing parents’ concerns and may include training immunization providers on effective vaccine communication strategies37-39 or implementing vaccine education initiatives 40 and social media tools. 41 In contrast, strategies to address structural barriers in the delivery of immunization services involve expanding access, such as offering after-hours and weekend immunization visits or establishing vaccination programs in nontraditional settings,42,43 and implementing prompts to caregivers to bring children in for vaccines, such as reminder–recall systems. 29 The spatial scan methodology that we used provides an initial indication of the most effective intervention needed to increase routine and on-time vaccination for a specific geographic area. Beyond these quantitative analyses, partnering with pediatric and family medicine providers and caregivers of young children in these areas could be beneficial for identifying, tailoring, and implementing interventions to increase routine and timely vaccination.
Our finding of clusters of undervaccination patterns indicative of parental hesitancy in western Montana is consistent with prior reports of counties in this region having the lowest childhood vaccination coverage 22 and the highest rates of exemptions for school vaccination requirements in the state. 44 In contrast, we found that the 3 largest clusters of undervaccination patterns indicative of structural barriers were in eastern Montana, which is more rural and remote than western Montana. Four of the 5 clusters of undervaccination patterns indicative of structural barriers were located in or overlapped with reservation lands of American Indian tribes. This finding aligns with a previous report from Montana of lower rates of on-time vaccination among American Indian children than among non-Hispanic White children. 45 Persistent underfunding of the Indian Health Service has resulted in many reservations being medically underserved, 46 which may have contributed to the spatial clustering that we identified.
Prior studies have used spatial scan techniques and electronic medical record data to identify undervaccination clusters among children and adults with commercial health insurance residing in metropolitan areas.31,47 However, rural areas in the United States have higher proportions of uninsured children and lower rates of vaccination coverage than urban areas.14,48 Along with applying spatial scan methods in a predominantly nonmetropolitan state, we expanded on previous work by distinguishing types of undervaccination patterns and demonstrating a novel application of IIS data. We took several steps to maintain confidentiality of IIS records, including geomasking addresses and limiting our spatial investigation to clusters of ≥100 children. Although some jurisdictions may have limited technical capacity to conduct similar analyses, the formation of academic–public health department partnerships is a promising avenue for continued growth in public health practice–based research using IIS data. 49
Limitations
Our study had several limitations. The first was the potential for missing records in a large electronic data source, such as an IIS. To evaluate IIS data quality, CDC recommends comparing IIS data on vaccination coverage with that estimated by the National Immunization Survey–Child. 50 We previously compared coverage for children aged <24 months in Montana’s IIS with coverage in data from Montana’s National Immunization Survey–Child and found similar estimates. 22 Second, children with no vaccinations are not routinely recorded in an IIS. Fewer than 2% of US children do not receive any vaccines by their second birthday. 14 Exclusion of completely unvaccinated children means that the prevalence of undervaccination may be underestimated in this study. Third, approximately 16% of addresses were post office boxes. Because post office boxes are more prevalent in rural areas than in metropolitan areas, excluding these children would have limited our ability to identify clusters among rural populations. However, including post office boxes means that some of our identified clusters were likely smaller in radius than the true cluster size because the distance from the post office box to a residential address varied in the geographic area surrounding that post office. Lastly, although we investigated clusters of ≥100 children, clusters with fewer children may exist and are important, particularly for disease transmission in community settings.
Conclusions
Like most public health interventions, initiatives to increase vaccination rates are most effective when designed for specific communities. In this study, we demonstrated an application of IIS data to identify spatial clusters of undervaccination patterns. Use of IIS data can facilitate the identification of appropriate interventions to increase routine and timely vaccination in small-scale geographic areas.
Footnotes
Disclaimer
The study sponsor did not have any role in the study design; collection, analysis, and interpretation of data; writing of the article; or the decision to submit the article for publication.
Declaration of Conflicting Interests
The authors declared no potential conflicts of interest with respect to the research, authorship, and/or publication of this article.
Funding
The authors disclosed receipt of the following financial support for the research, authorship, and/or publication of this article: This work was supported by a Center for Biomedical Research Excellence award (P20GM130418) from the National Institute of General Medical Sciences.