
Abstract
Objectives:
The incidence of hepatitis A declined in the United States following the introduction of hepatitis A vaccines, before increasing in the setting of recent widespread outbreaks associated with person-to-person transmission. We describe the hepatitis A epidemiology in the United States, identify susceptible populations over time, and demonstrate the need for improved hepatitis A vaccination coverage, especially among adults at increased risk for hepatitis A.
Methods:
We calculated the hepatitis A incidence rates for sociodemographic characteristics and percentages for risk factors and clinical outcomes for hepatitis A cases reported to the National Notifiable Diseases Surveillance System during 1990-2020. We generated nationally representative estimates and 95% CIs of hepatitis A seroprevalence during 1976–March 2020 and self-reported hepatitis A vaccination coverage during 1999–March 2020 for the noninstitutionalized civilian US population using data from the National Health and Nutrition Examination Survey.
Results:
Overall, the rate per 100 000 population of reported cases of hepatitis A virus infection in the United States declined 17.3-fold, from 10.4 during 1990-1998 to 0.6 during 2007-2015, and then increased to 2.8 during 2016-2020. The overall hepatitis A seroprevalence in the United States increased from 38.2% (95% CI, 36.2%-40.1%) during 1976-1980 to 47.3% (95% CI, 45.4%-49.2%) during 2015–March 2020. The prevalence of self-reported hepatitis A vaccination coverage in the United States increased more than 2.5-fold, from 16.3% (95% CI, 15.0%-17.7%) during 1999-2006 to 41.9% (95% CI, 40.2%-43.7%) during 2015–March 2020.
Conclusions:
Hepatitis A epidemiology in the United States changed substantially during 1976-2020. Improved vaccination coverage, especially among adults recommended for vaccination by the Advisory Committee on Immunization Practices, is vital to stop current hepatitis A outbreaks associated with person-to-person transmission in the United States and prevent similar future recurrences.
Keywords
Hepatitis A is a vaccine-preventable liver infection acquired through fecal–oral transmission, either from direct person-to-person contact or consumption of contaminated food or water. Hepatitis A virus (HAV) infection is typically mild and self-limited; however, symptomatic illness, jaundice, hospitalization, and death occur more frequently among adults who are susceptible to HAV infection than among children. 1
During the latter half of the 20th century, hepatitis A was common in the United States, with large epidemics occurring approximately every 10 to 15 years (Figure 1).2,3 Hepatitis A incidence rates per 100 000 population declined 96.7%, from 12.0 in 1995, when hepatitis A vaccines were first licensed in the United States, to 0.4 in 2015, when hepatitis A incidence rates reported to the National Notifiable Diseases Surveillance System (NNDSS) reached the nadir. 4 Since 1996, the Advisory Committee on Immunization Practices (ACIP) has incrementally expanded hepatitis A vaccine recommendations for children and for adults who are at risk for HAV infection or for severe disease from HAV; universal childhood vaccination was recommended in 2006.2,5-9
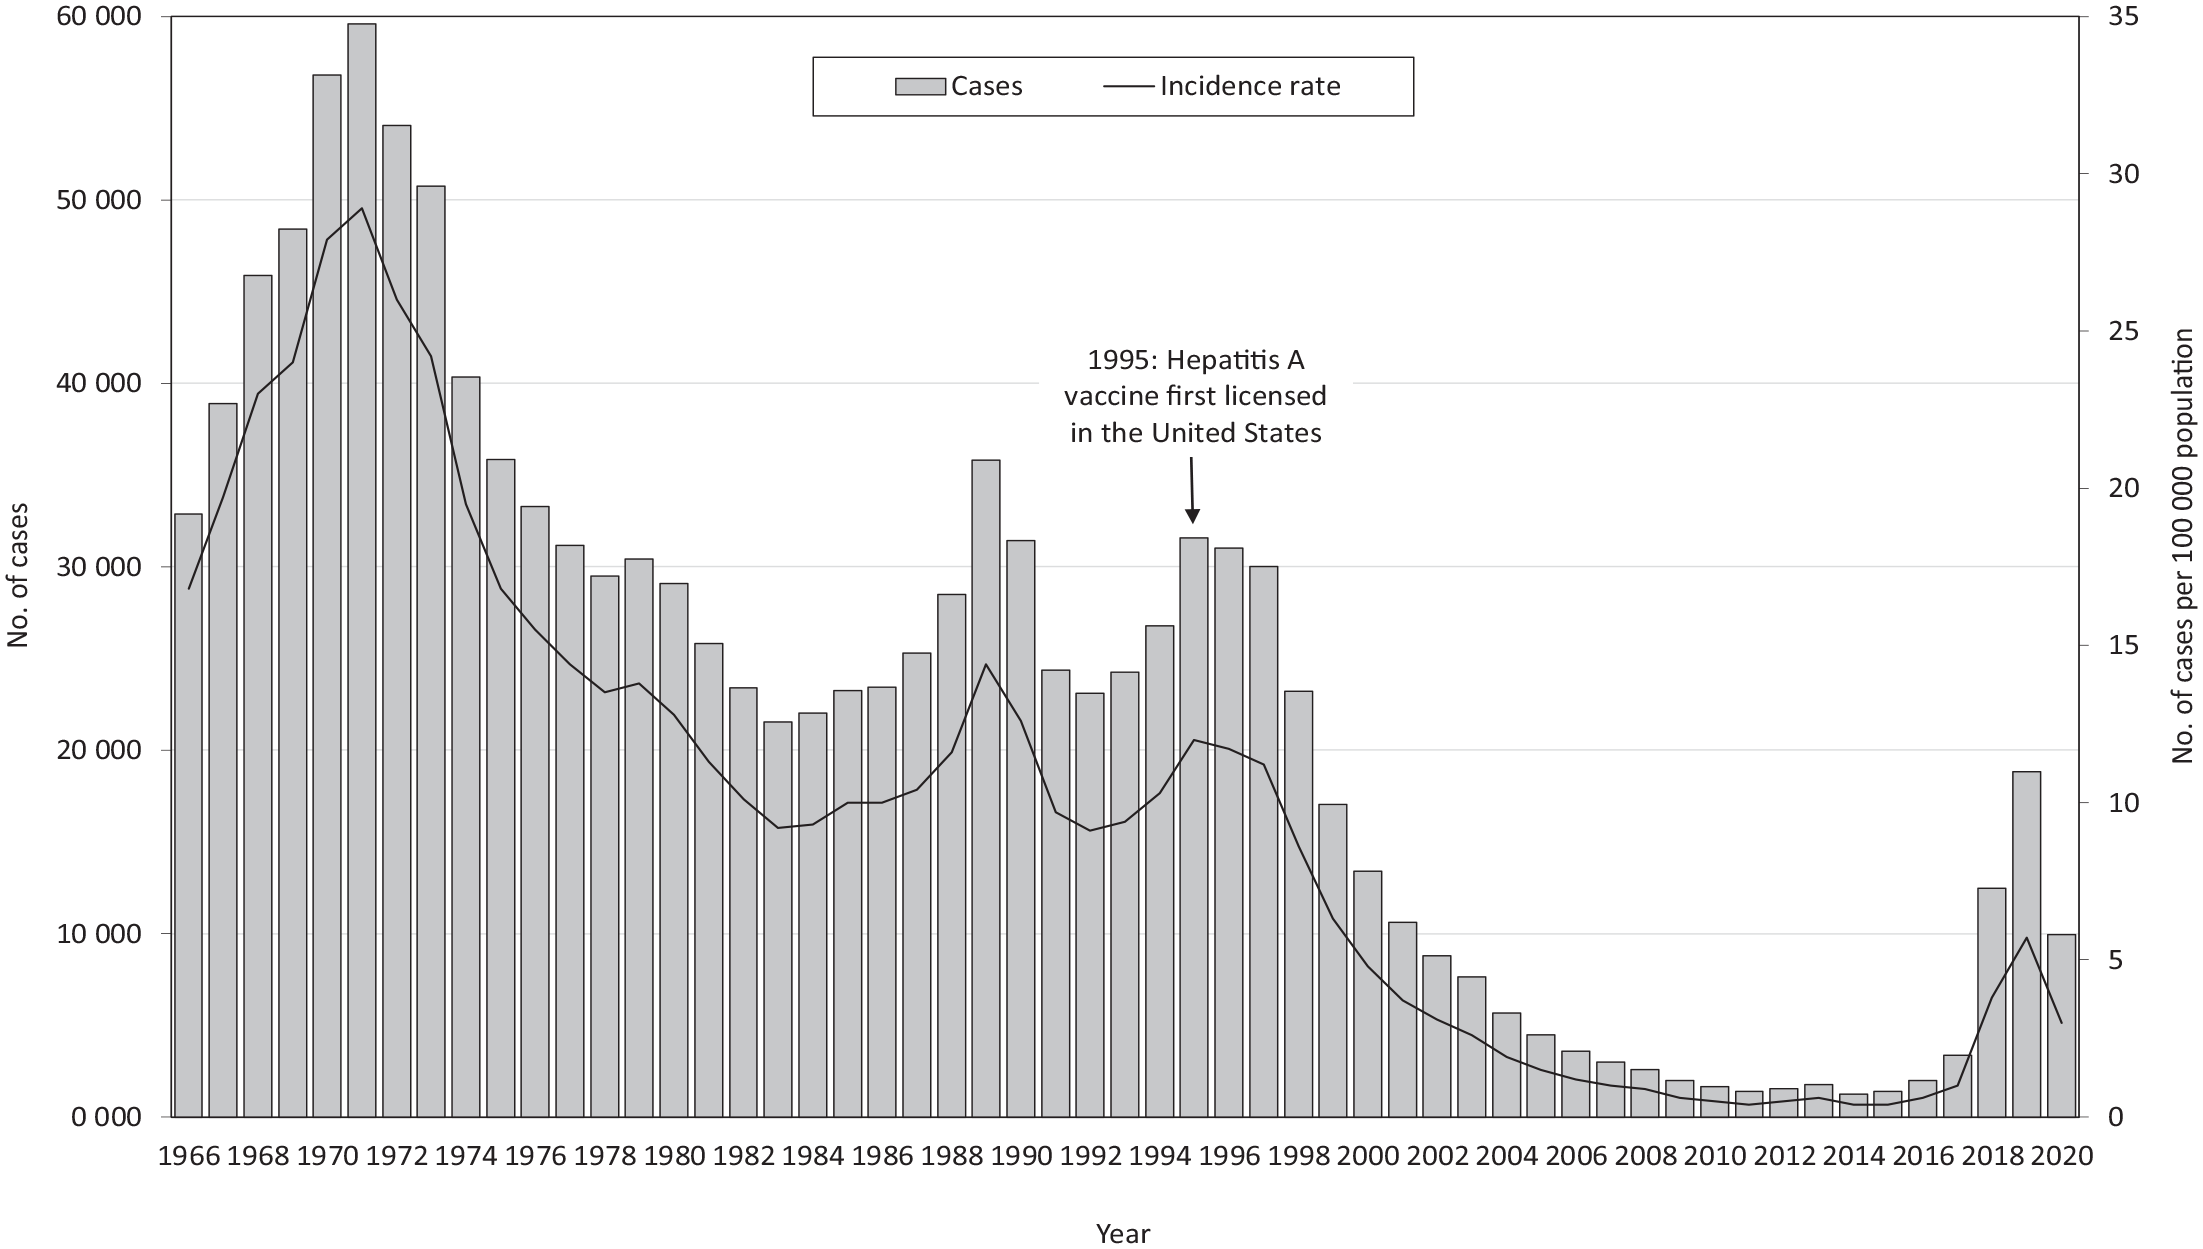
Number and rate of reported hepatitis A virus infections, United States, 1966-2020. Data source: National Notifiable Diseases Surveillance System. 10
We examined the totality of available data from NNDSS and the National Health and Nutrition Examination Survey (NHANES) to comprehensively describe the shifting hepatitis A epidemiology in the United States, identify susceptible populations over time, and demonstrate the need for improved surveillance and hepatitis A vaccination coverage, especially among adults at increased risk for HAV infection.
Methods
Data Sources
We obtained data analyzed in this article from NNDSS and NHANES. NNDSS is the national passive surveillance system through which health departments inform the Centers for Disease Control and Prevention (CDC) of nationally notifiable diseases and conditions. 10 Hepatitis A has been nationally notifiable since 1966. During the analysis period, the surveillance definition used for hepatitis A was consistent (eg, clinical evidence of acute hepatitis and a positive test for immunoglobulin M antibody to HAV or clinical evidence of acute hepatitis in a person who had close contact with a laboratory-confirmed hepatitis A case during their exposure period). 11 NHANES collects nationally representative data on the health and nutritional status of the noninstitutionalized civilian US population. NHANES uses a stratified, multistage probability sampling design and collects information using standardized household interviews, physical examinations, and testing of biological specimens. 12 The analysis period was 1990-2020 for the NNDSS dataset and 1976–March 2020 for the NHANES dataset. We used deidentified NNDSS and publicly available NHANES datasets for this article, which do not require CDC institutional review board approval.
Serologic Testing
Eligibility of NHANES participants for hepatitis A serological testing varied across surveys: during NHANES II (1976-1980), people aged 6 months to 74 years were eligible; during NHANES III (1988-1994), people aged ≥6 years were eligible; and during 1999–March 2020, people aged ≥2 years were eligible. Serum specimens were tested for total HAV antibody (anti-HAV) using solid-phase competitive enzyme immunoassay (HAVAB-EIA solid-phase EIA Assay [Abbott Diagnostics]) for samples collected during 1976-1980, 1988-1994, and 1999-2006 and using a competitive immunoassay technique (Anti-HAV Total, VITROS Immunodiagnostic System [Ortho-Clinical Diagnostics, Inc]) for samples collected during 2007–March 2020. Tests initially considered indeterminate were repeated in duplicate for confirmation. 13 For this study, we classified indeterminate results (88 of 113 917 total anti-HAV results) as negative. The serological assays used cannot differentiate between infection and vaccination; anti-HAV positivity reflects either immunity from prior infection or vaccination. We excluded people with missing anti-HAV results from the seroprevalence analysis.
Definitions
NNDSS
We assessed sociodemographic characteristics, risk factors, and clinical outcomes of hepatitis A cases reported to NNDSS: age, sex, race and ethnicity, urbanicity, and US Department of Health and Human Services (HHS) region. We defined urbanicity in accordance with the National Center for Health Statistics (NCHS) urban–rural classification scheme for counties; for 1990-2005, we applied the 1990 NCHS scheme; for 2006-2012, we applied the 2006 NCHS scheme; and for 2013-2020, we applied the 2013 NCHS scheme. 14 We categorized HHS regions according to the grouping of states assigned under each of the 10 HHS regional offices. 15 We assessed risk factors for acquiring hepatitis A based on their presence or absence during a patient’s exposure period (ie, the 15-50 days before symptom onset).
NHANES
We defined hepatitis A seroprevalence as the prevalence of positive total anti-HAV serology results. We considered survey participants vaccinated against hepatitis A if they self-reported receiving at least 1 dose of hepatitis A vaccine in response to the question, “Have you ever received hepatitis A vaccine?” We assessed sociodemographic characteristics: age, sex, race and ethnicity, country of birth, federal poverty level, and health insurance coverage. During NHANES II, ethnicity information was not collected; race options from NHANES II were recategorized for the analysis (“Black” was recategorized as non-Hispanic Black and “White” was recategorized as non-Hispanic White).
We categorized participants as having hepatitis B or hepatitis C if they were aged ≥2 years and tested positive for hepatitis B surface antigen (HBsAg), hepatitis C RNA, or both. We assessed men who have sex with men (MSM) status during 1999-2016 among male NHANES participants aged 20-59 years. We categorized males who met any of the following 3 scenarios as MSM for the purposes of the analysis: (1) provided a nonzero answer to, “In your lifetime, with how many men have you had sex?” or “In your lifetime, with how many males have you had anal or oral sex?”; (2) responded to sexual orientation/identity questions with “homosexual or gay,” “bisexual,” or “gay”; and (3) responded yes to the question, “Have you ever had any kind of sex with a man, including oral or anal?” We assessed drug use history during 1999-2018 among adult NHANES participants aged 20-59 years. We defined any drug use as participants responding yes to any of the following questions: “Have you ever used cocaine, including crack or freebase, or other street drugs? Do not include marijuana,” “Have you ever used a needle to take street drugs?,” “Have you ever, even once, used marijuana or hashish?,” “Have you ever used cocaine, crack cocaine, heroin, or methamphetamine?,” or “Have you ever, even once, used a needle to inject a drug not prescribed by a doctor?” We categorized a yes response to “Have you ever used a needle to take street drugs?” or “Have you ever, even once, used a needle to inject a drug not prescribed by a doctor?” as injection drug use. We categorized non–injection drug use according to 3 scenarios: (1) responded yes to “Have you ever used cocaine, including crack or freebase, or other street drugs? Do not include marijuana” and responded no to “Have you ever used a needle to take street drugs?”; (2) responded yes to “Have you ever, even once, used marijuana or hashish?”; and (3) responded yes to “Have you ever used cocaine, crack cocaine, heroin, or methamphetamine?” and responded no to “Have you ever, even once, used a needle to inject a drug not prescribed by a doctor?”
Statistical Analysis
For the NNDSS analysis, we calculated hepatitis A incidence rates by dividing the number of hepatitis A case reports annually during 1990-2020 by the US Census population for each year. 16 We restricted percentage calculations for risk factors and clinical outcomes to those with available information. For the NHANES analyses, we used the NHANES survey sampling design and weighting variables to calculate nationally representative estimates and corresponding 95% CIs of the noninstitutionalized civilian US population; for these analyses, we used Stata version 14 (StataCorp LLC). We adhered to NCHS data presentation standards. 17
Results
NNDSS
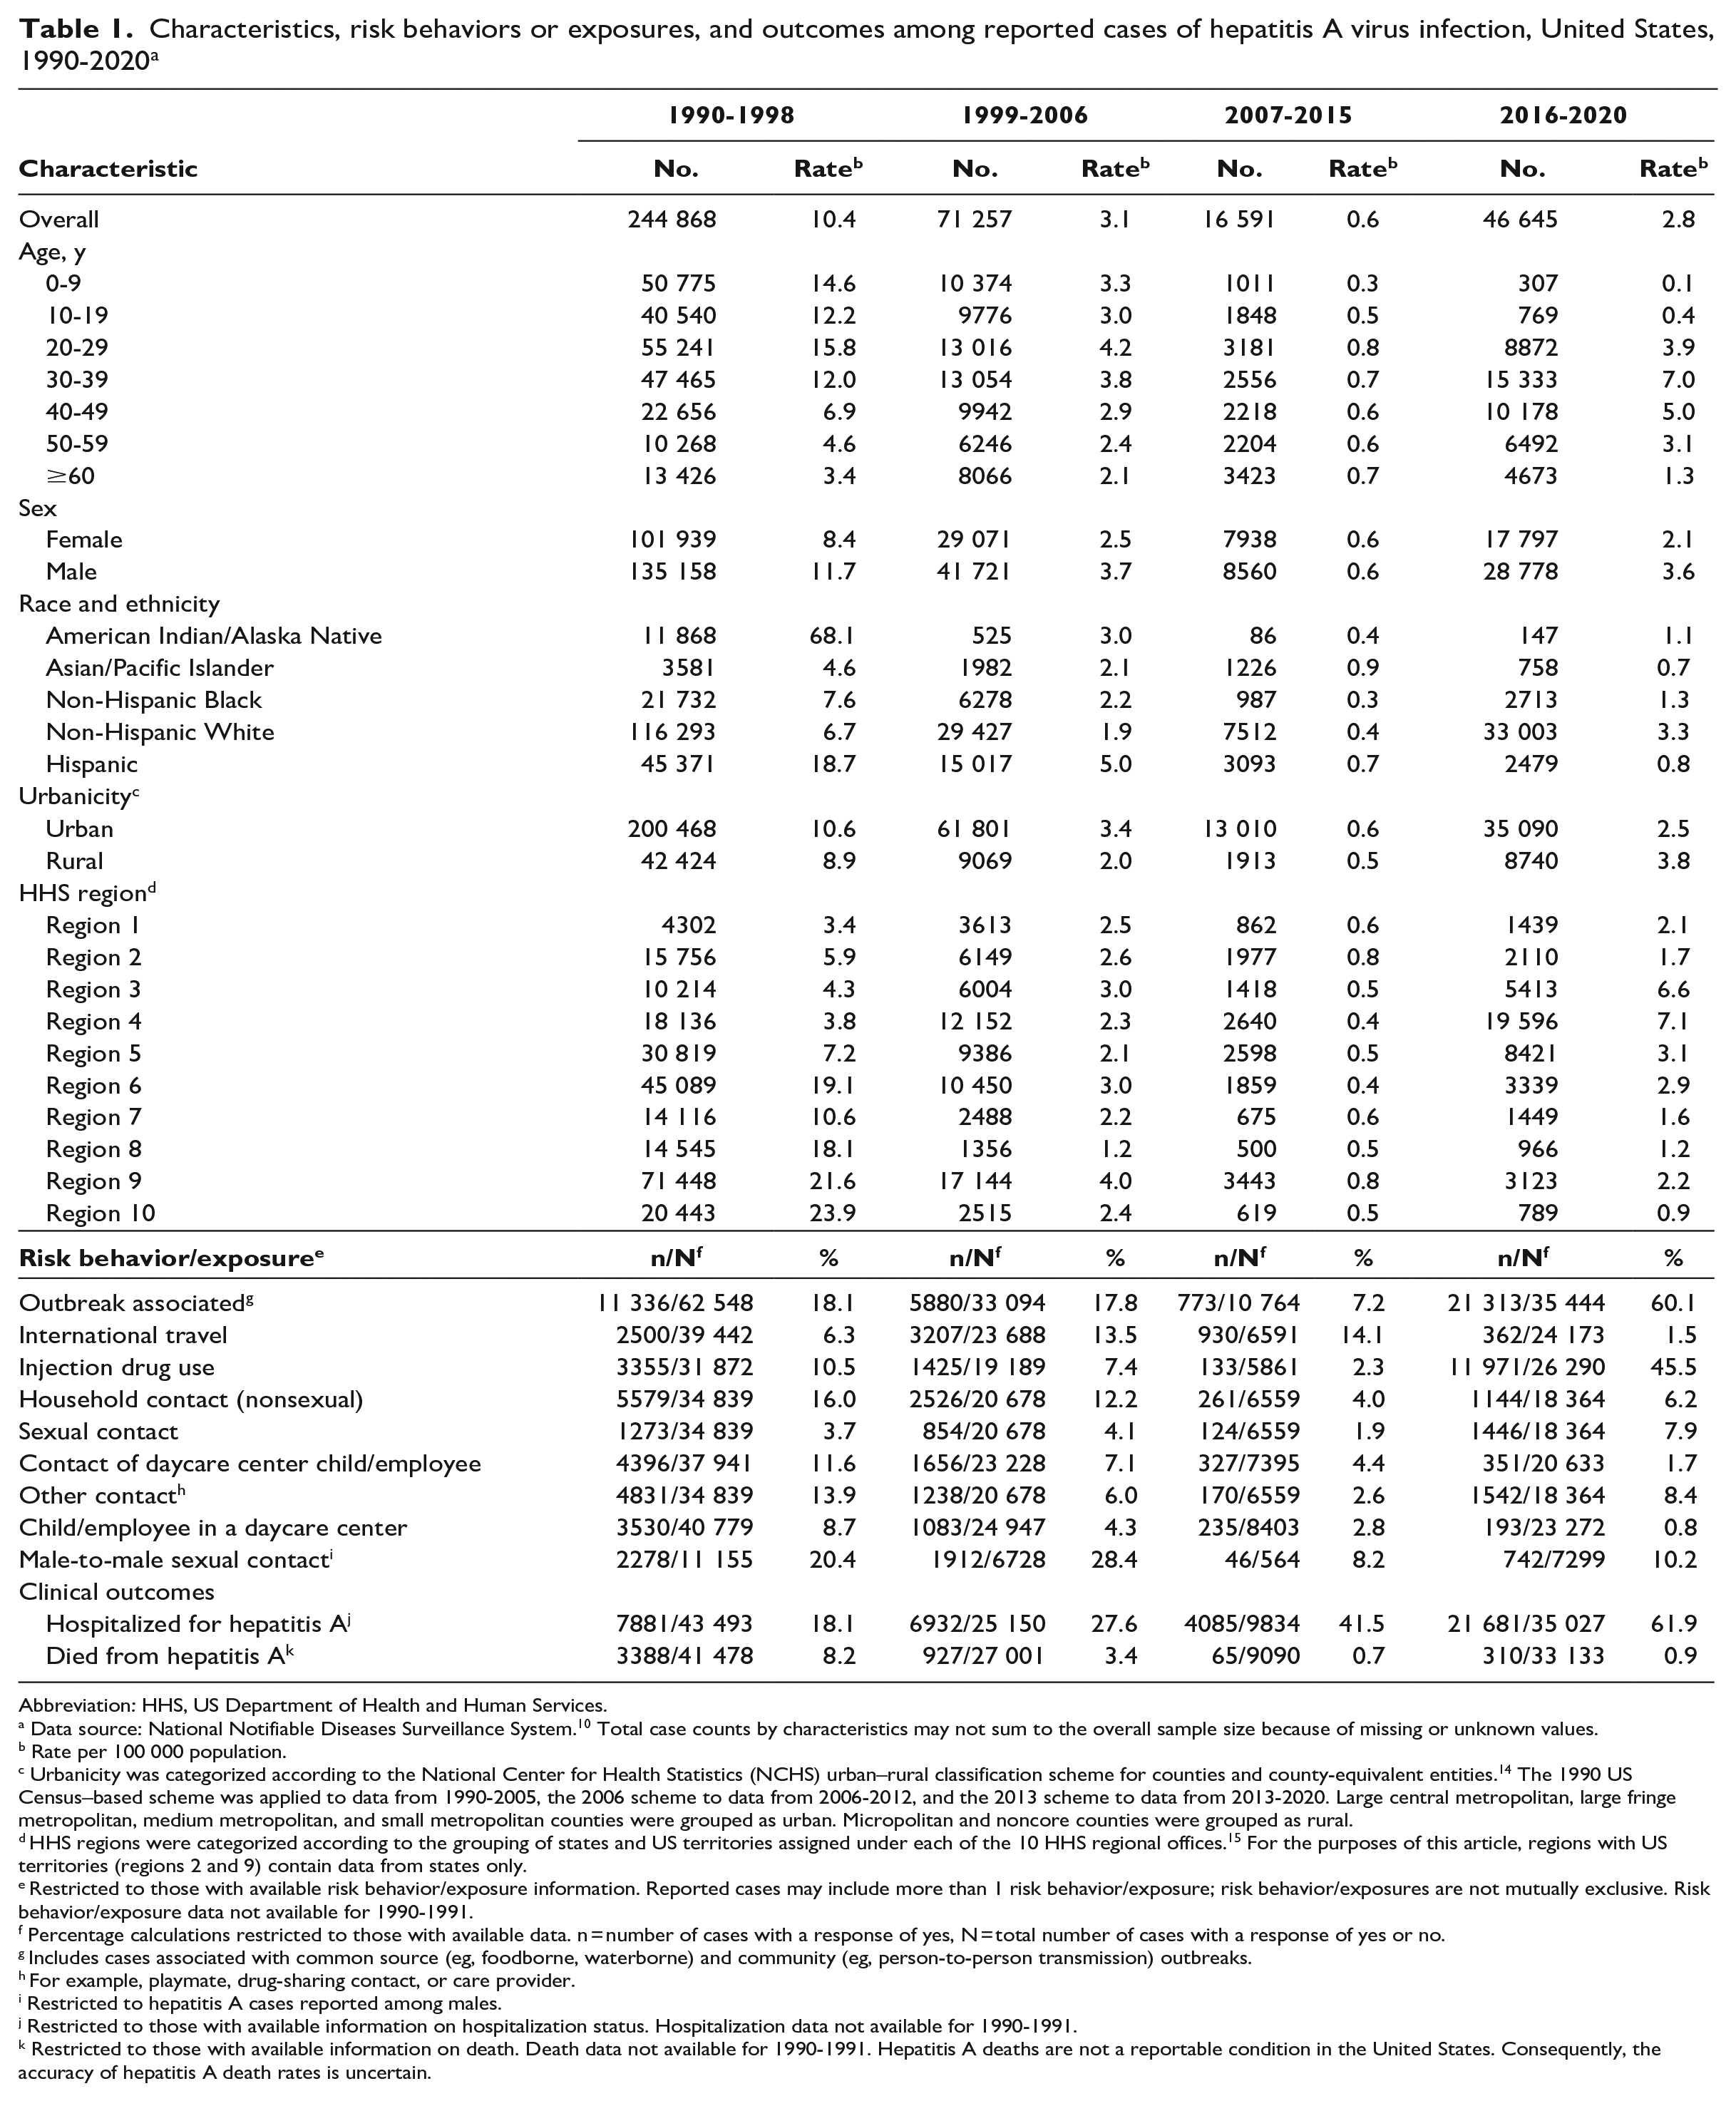
Overall, the rate per 100 000 population of reported cases of HAV infection in the United States declined 17.3-fold, from 10.4 during 1990-1998 to 0.6 during 2007-2015, and then increased to 2.8 during 2016-2020 (Table 1). During 1990-1998, the highest incidence rates were reported in people aged <40 years; however, by 2007-2015, rates of reported pediatric cases (aged <20 years) declined substantially, reaching the lowest age-specific rates of the analysis period during 2016-2020. During the analysis period, the highest age-specific reported HAV infection rates per 100 000 population occurred in increasingly older age groups; by 2016-2020, the highest rates (7.0 and 5.0) occurred among people aged 30-39 and 40-49 years, respectively. The race and ethnicity categories with reported HAV infection rates higher than the national average changed over time; during 1990-1998, American Indian/Alaska Native and Hispanic people had rates that were 6.5-fold and 1.8-fold higher than the national average, respectively. During subsequent periods, the highest race- and ethnicity-specific rates were reported among Hispanic (1999-2006), Asian/Pacific Islander (2007-2015), and non-Hispanic White (2016-2020) people (1.6-fold, 1.5-fold, and 1.2-fold higher, respectively, than the national average during the indicated period). Reported HAV infection rates were higher in urban areas than in rural areas during 1990-2015 but lower in urban areas than in rural areas during 2016-2020. The geographic distribution of reported cases shifted during the analysis period (Figure 2). During 1990-1998, the highest rates of reported HAV infections were in the western United States; by 2016-2020, the highest rates were in the eastern and midwestern United States.
Characteristics, risk behaviors or exposures, and outcomes among reported cases of hepatitis A virus infection, United States, 1990-2020 a
Abbreviation: HHS, US Department of Health and Human Services.
Data source: National Notifiable Diseases Surveillance System. 10 Total case counts by characteristics may not sum to the overall sample size because of missing or unknown values.
Rate per 100 000 population.
Urbanicity was categorized according to the National Center for Health Statistics (NCHS) urban–rural classification scheme for counties and county-equivalent entities. 14 The 1990 US Census–based scheme was applied to data from 1990-2005, the 2006 scheme to data from 2006-2012, and the 2013 scheme to data from 2013-2020. Large central metropolitan, large fringe metropolitan, medium metropolitan, and small metropolitan counties were grouped as urban. Micropolitan and noncore counties were grouped as rural.
HHS regions were categorized according to the grouping of states and US territories assigned under each of the 10 HHS regional offices. 15 For the purposes of this article, regions with US territories (regions 2 and 9) contain data from states only.
Restricted to those with available risk behavior/exposure information. Reported cases may include more than 1 risk behavior/exposure; risk behavior/exposures are not mutually exclusive. Risk behavior/exposure data not available for 1990-1991.
Percentage calculations restricted to those with available data. n = number of cases with a response of yes, N = total number of cases with a response of yes or no.
Includes cases associated with common source (eg, foodborne, waterborne) and community (eg, person-to-person transmission) outbreaks.
For example, playmate, drug-sharing contact, or care provider.
Restricted to hepatitis A cases reported among males.
Restricted to those with available information on hospitalization status. Hospitalization data not available for 1990-1991.
Restricted to those with available information on death. Death data not available for 1990-1991. Hepatitis A deaths are not a reportable condition in the United States. Consequently, the accuracy of hepatitis A death rates is uncertain.
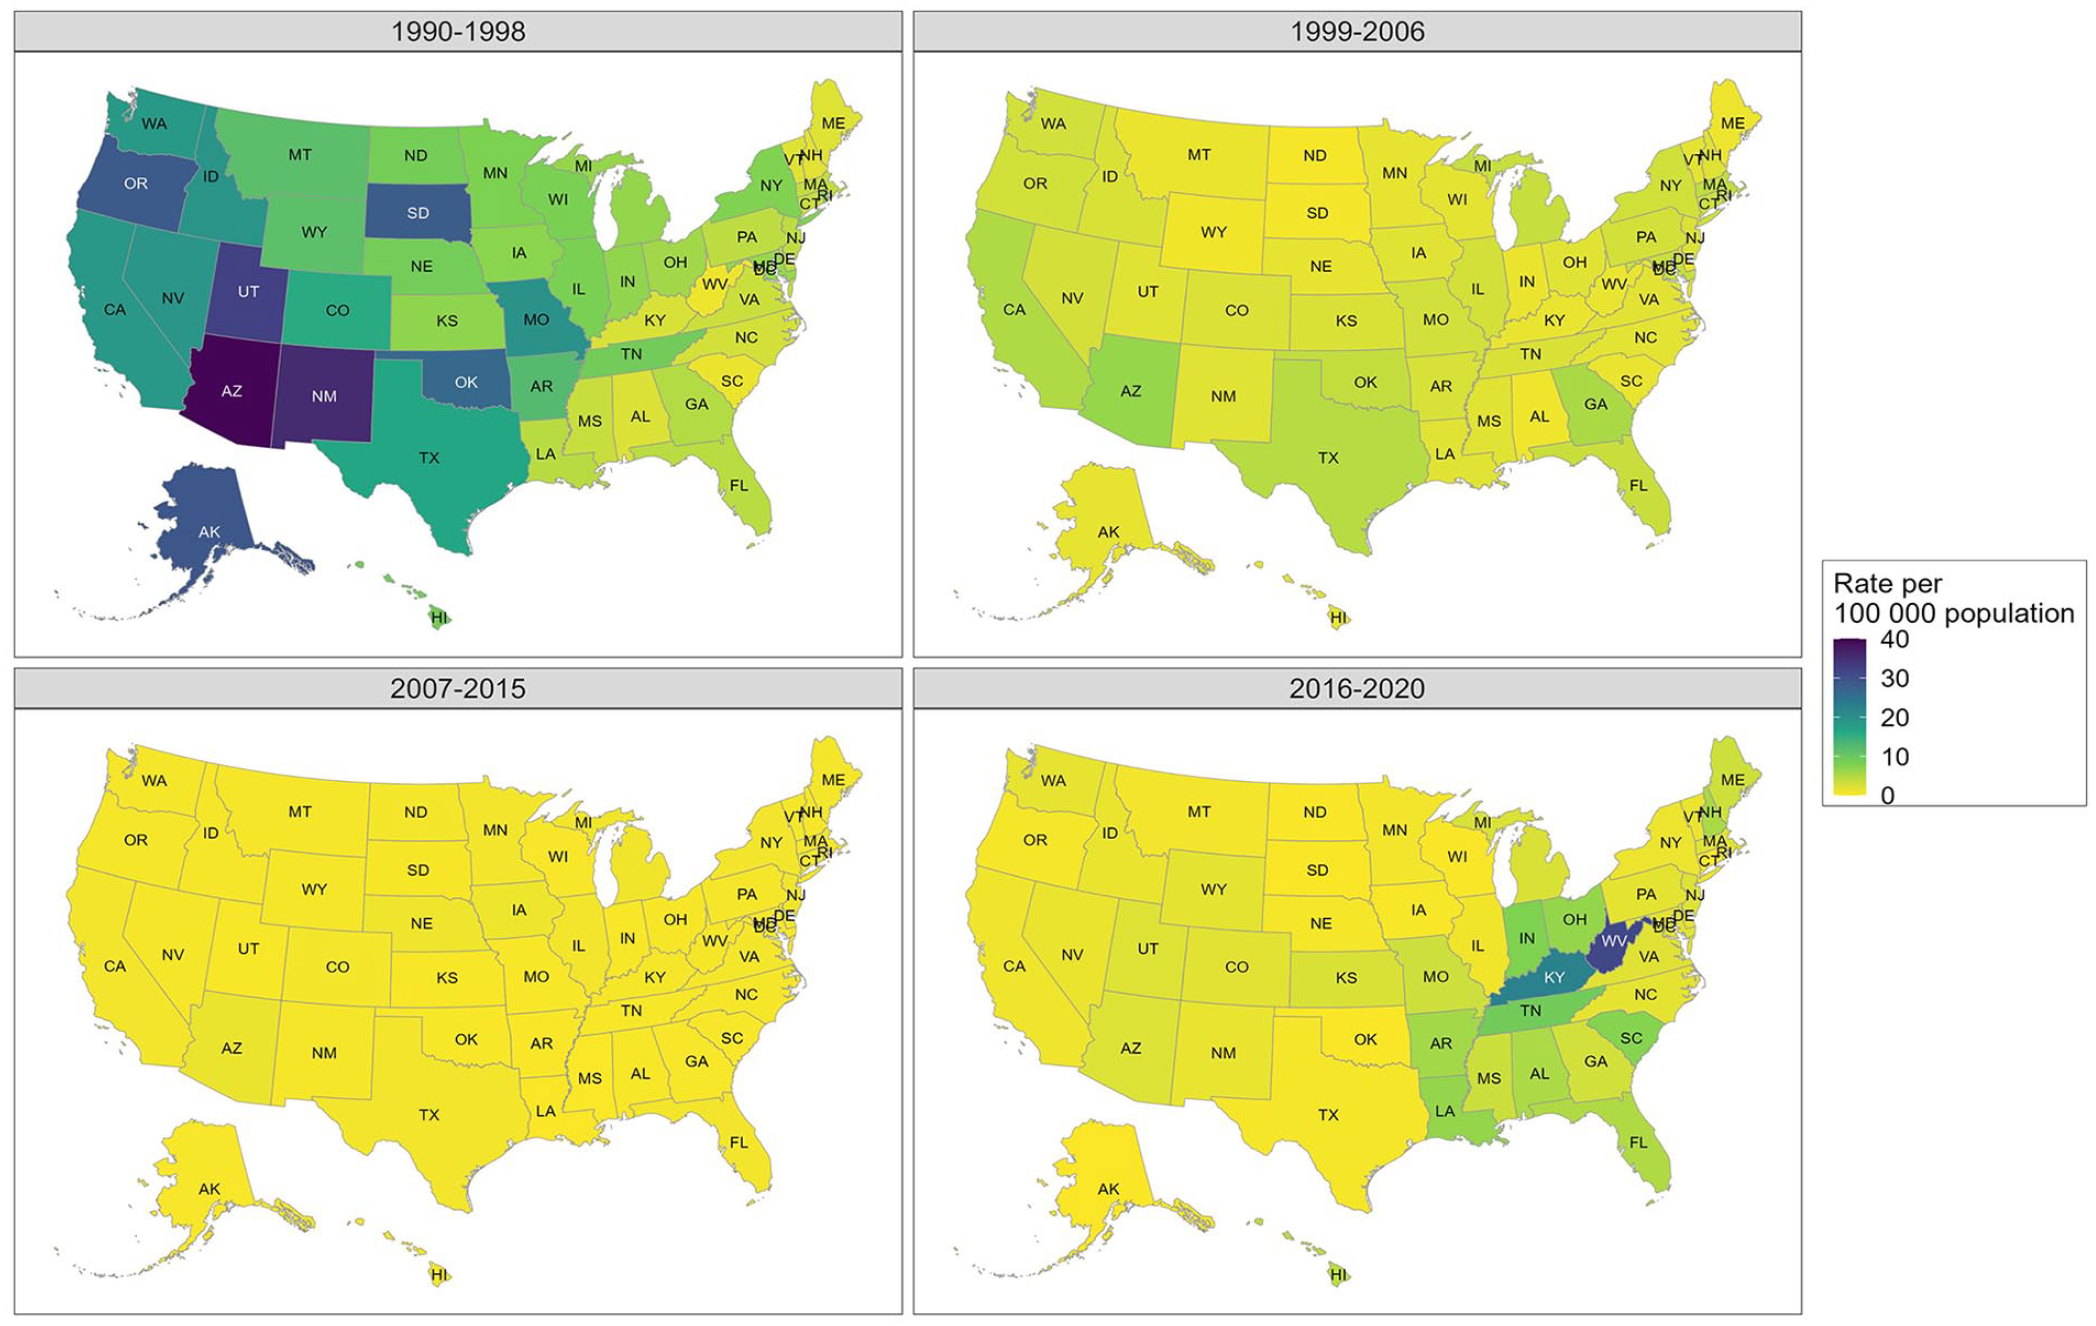
Rate of reported hepatitis A virus infections per 100 000 population, by state, United States, 1990-2020. Data source: National Notifiable Diseases Surveillance System. 10
The most frequently reported risk behaviors and exposures also changed over time. Among those with available information on risk factors, male-to-male sexual contact (20.4%), outbreak-associated (18.1%), and nonsexual household contact of a hepatitis A case (16.0%) were the most frequently reported risk factors during 1990-1998; outbreak-associated (60.1%), injection drug use (45.5%), and male-to-male sexual contact (10.2%) were the most frequently reported risk factors during 2016-2020 (Table 1).
Among those with available information, the percentage of reported hepatitis A cases that were hospitalized increased 3.4-fold during the analysis period, from 18.1% during 1990-1998 to 61.9% during 2016-2020 (Table 1). Conversely, the percentage of reported hepatitis A cases who died decreased from 8.2% during 1990-1998 to 0.7% during 2007-2015 and then increased to 0.9% during 2016-2020.
NHANES
Hepatitis A seroprevalence
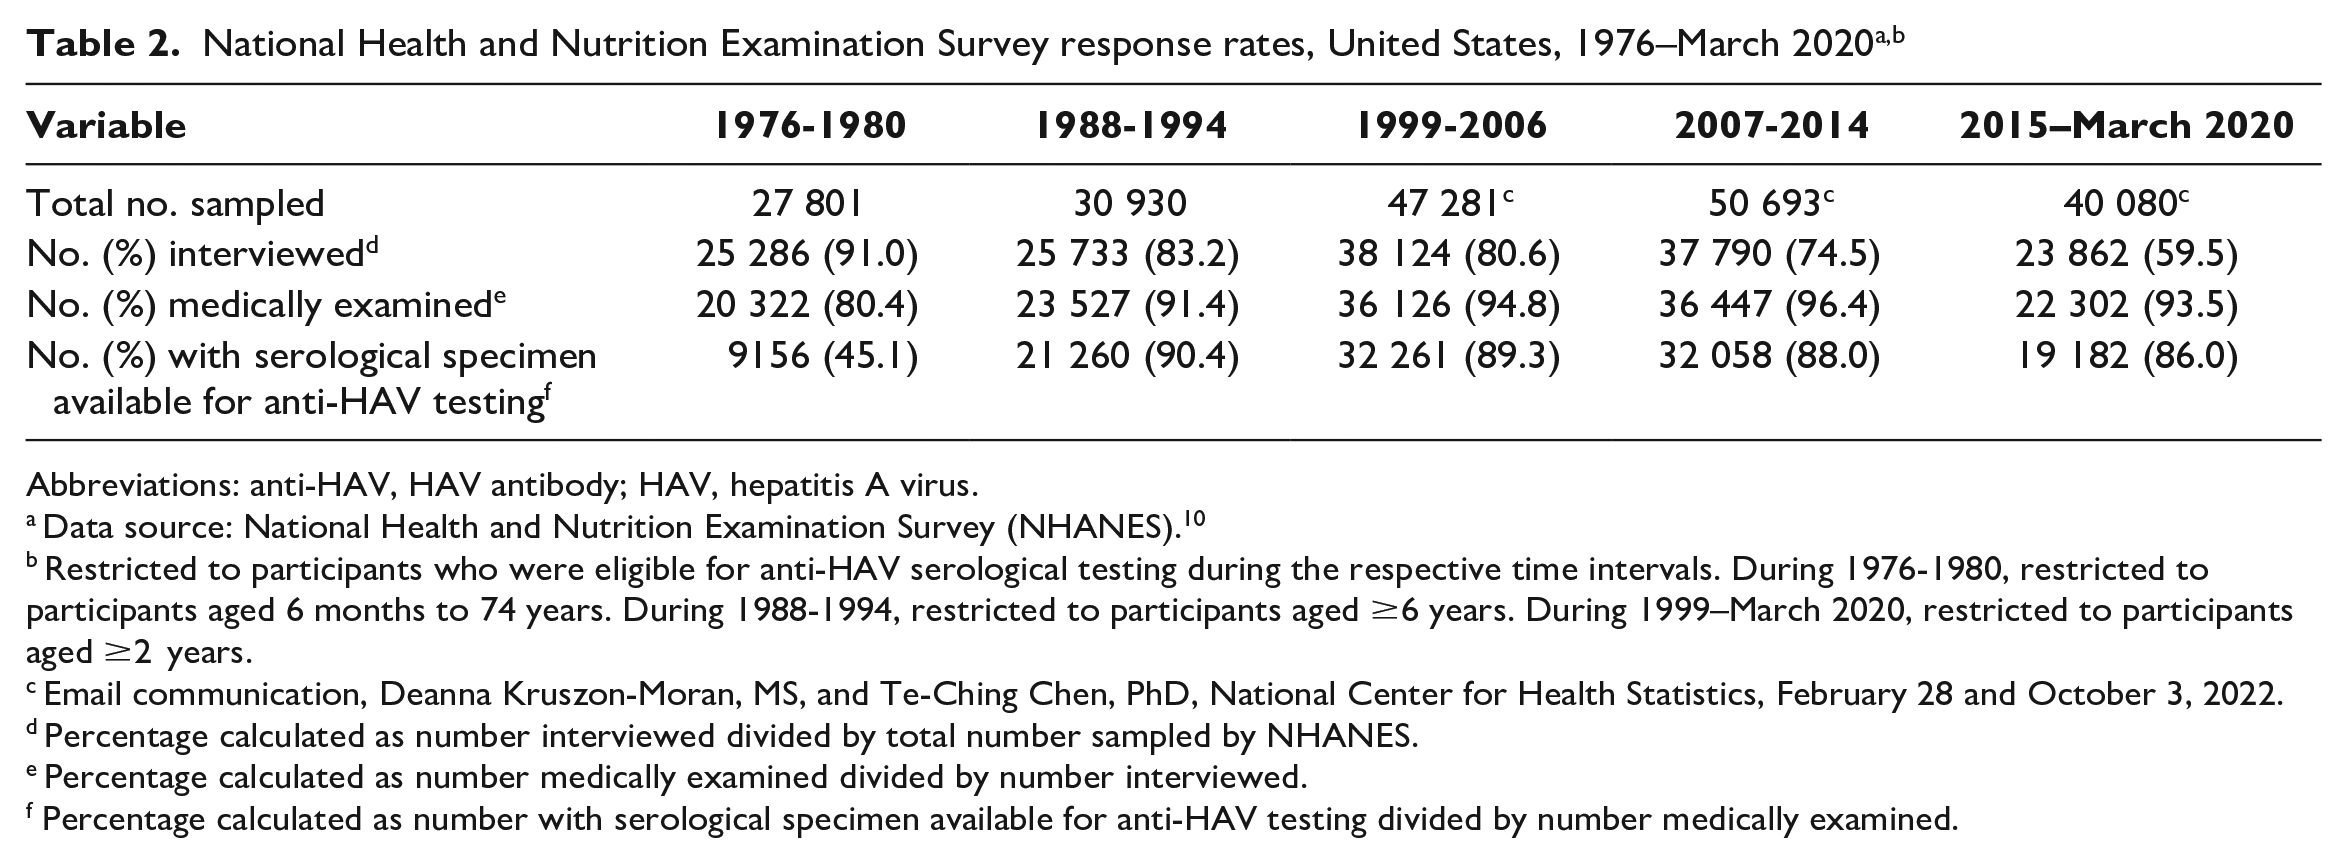
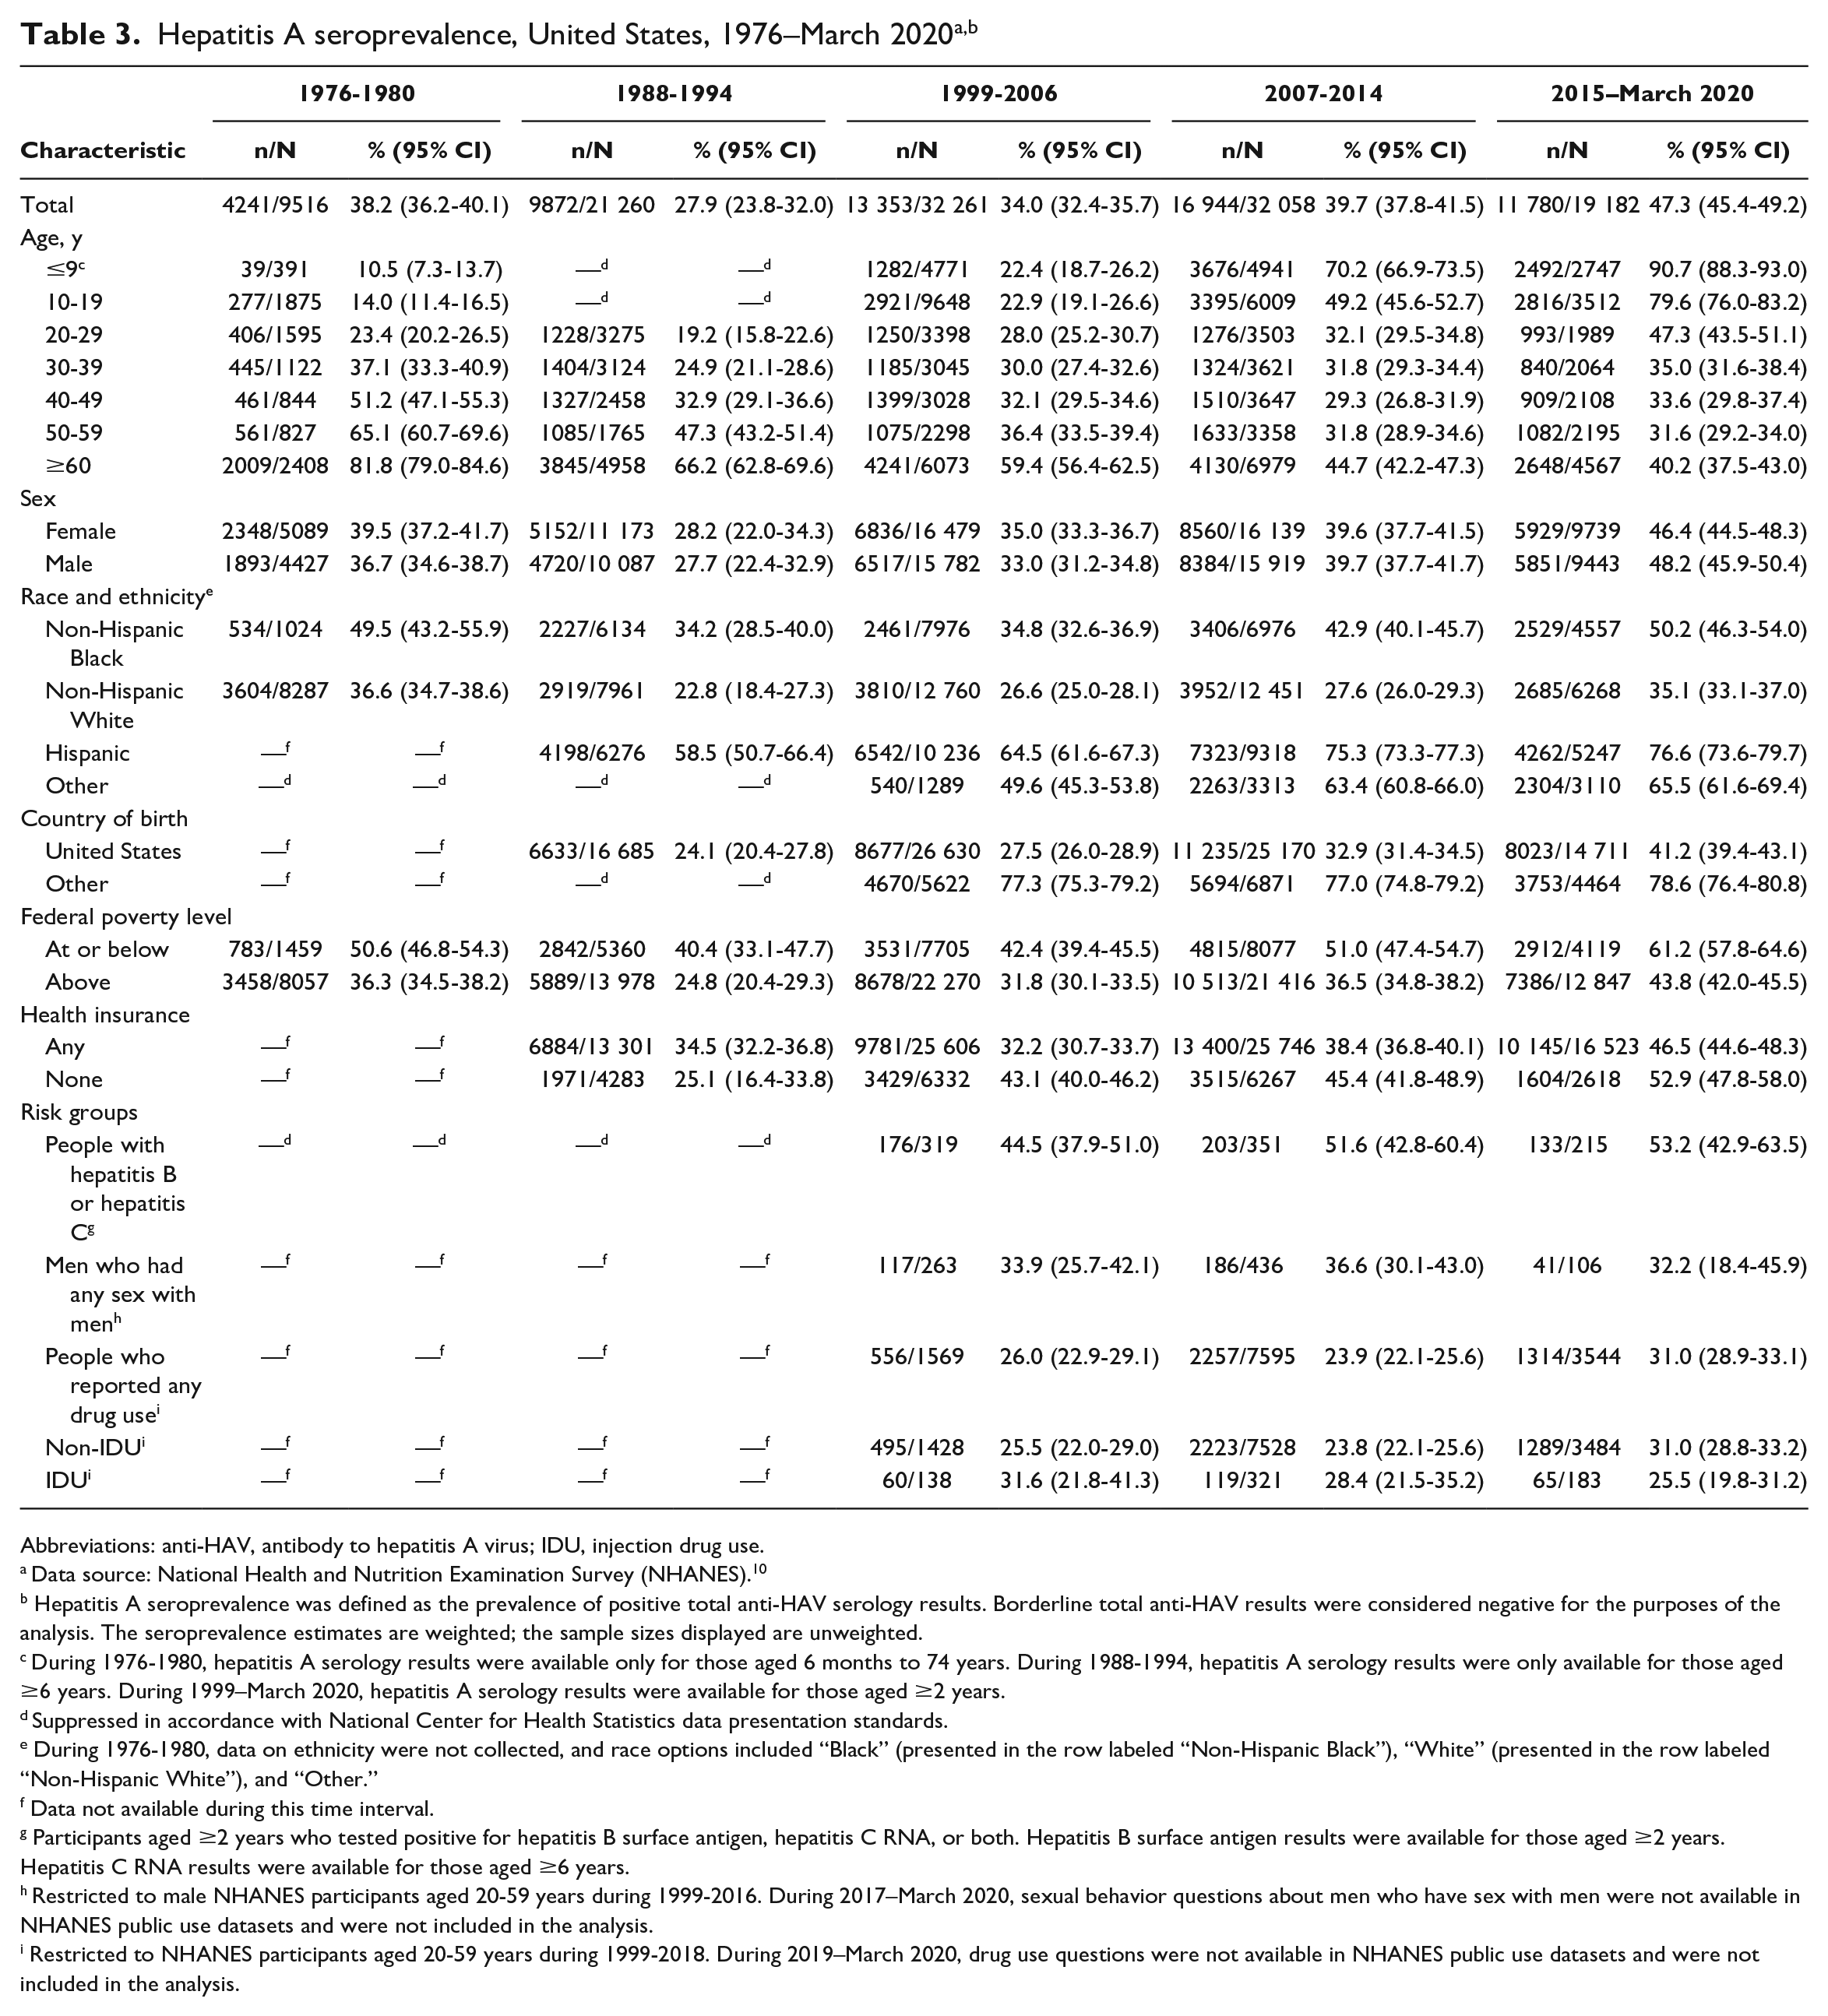
NHANES response rates varied over time (Table 2). The overall hepatitis A seroprevalence in the United States increased from 38.2% (95% CI, 36.2%-40.1%) during 1976-1980 to 47.3% (95% CI, 45.4%-49.2%) during 2015–March 2020 (Table 3). Seroprevalence increased from 1976-1980 to 2015–March 2020 among people aged ≤9, 10-19, and 20-29 years but decreased during the same time frame among people aged ≥30 years, with larger decreases occurring among older age groups. Seroprevalence increased among males and females during the analysis period. By race and ethnicity, seroprevalence was highest among Hispanic people and lowest among non-Hispanic White people throughout the analysis period. During 2015–March 2020, hepatitis A seroprevalence among Hispanic people was 2.2-fold higher than among non-Hispanic White people, 1.5-fold higher than among non-Hispanic Black people, and 1.2-fold higher than among people in the “other” racial and ethnic category. In all time intervals examined, seroprevalence was higher among non–US-born than among US-born people and among those living at or below the federal poverty level than among those living above the federal poverty level. Seroprevalence more than doubled during the analysis period among those without health insurance (2.1-fold increase); those with any health insurance had a 1.3-fold increase in seroprevalence.
National Health and Nutrition Examination Survey response rates, United States, 1976–March 2020a,b
Abbreviations: anti-HAV, HAV antibody; HAV, hepatitis A virus.
Data source: National Health and Nutrition Examination Survey (NHANES). 10
Restricted to participants who were eligible for anti-HAV serological testing during the respective time intervals. During 1976-1980, restricted to participants aged 6 months to 74 years. During 1988-1994, restricted to participants aged ≥6 years. During 1999–March 2020, restricted to participants aged ≥2 years.
Email communication, Deanna Kruszon-Moran, MS, and Te-Ching Chen, PhD, National Center for Health Statistics, February 28 and October 3, 2022.
Percentage calculated as number interviewed divided by total number sampled by NHANES.
Percentage calculated as number medically examined divided by number interviewed.
Percentage calculated as number with serological specimen available for anti-HAV testing divided by number medically examined.
Abbreviations: anti-HAV, antibody to hepatitis A virus; IDU, injection drug use.
Data source: National Health and Nutrition Examination Survey (NHANES). 10
Hepatitis A seroprevalence was defined as the prevalence of positive total anti-HAV serology results. Borderline total anti-HAV results were considered negative for the purposes of the analysis. The seroprevalence estimates are weighted; the sample sizes displayed are unweighted.
During 1976-1980, hepatitis A serology results were available only for those aged 6 months to 74 years. During 1988-1994, hepatitis A serology results were only available for those aged ≥6 years. During 1999–March 2020, hepatitis A serology results were available for those aged ≥2 years.
Suppressed in accordance with National Center for Health Statistics data presentation standards.
During 1976-1980, data on ethnicity were not collected, and race options included “Black” (presented in the row labeled “Non-Hispanic Black”), “White” (presented in the row labeled “Non-Hispanic White”), and “Other.”
Data not available during this time interval.
Participants aged ≥2 years who tested positive for hepatitis B surface antigen, hepatitis C RNA, or both. Hepatitis B surface antigen results were available for those aged ≥2 years. Hepatitis C RNA results were available for those aged ≥6 years.
Restricted to male NHANES participants aged 20-59 years during 1999-2016. During 2017–March 2020, sexual behavior questions about men who have sex with men were not available in NHANES public use datasets and were not included in the analysis.
Restricted to NHANES participants aged 20-59 years during 1999-2018. During 2019–March 2020, drug use questions were not available in NHANES public use datasets and were not included in the analysis.
Hepatitis A seroprevalence changed among groups at risk for HAV infection from 1999-2006 to 2015–March 2020. People with hepatitis B or hepatitis C, people who reported any drug use, and people who reported non–injection drug use had 1.2-fold increases in seroprevalence, while MSM and people who reported injection drug use had 0.9-fold and 0.8-fold decreases in seroprevalence, respectively (Table 3).
Self-reported hepatitis A vaccination coverage
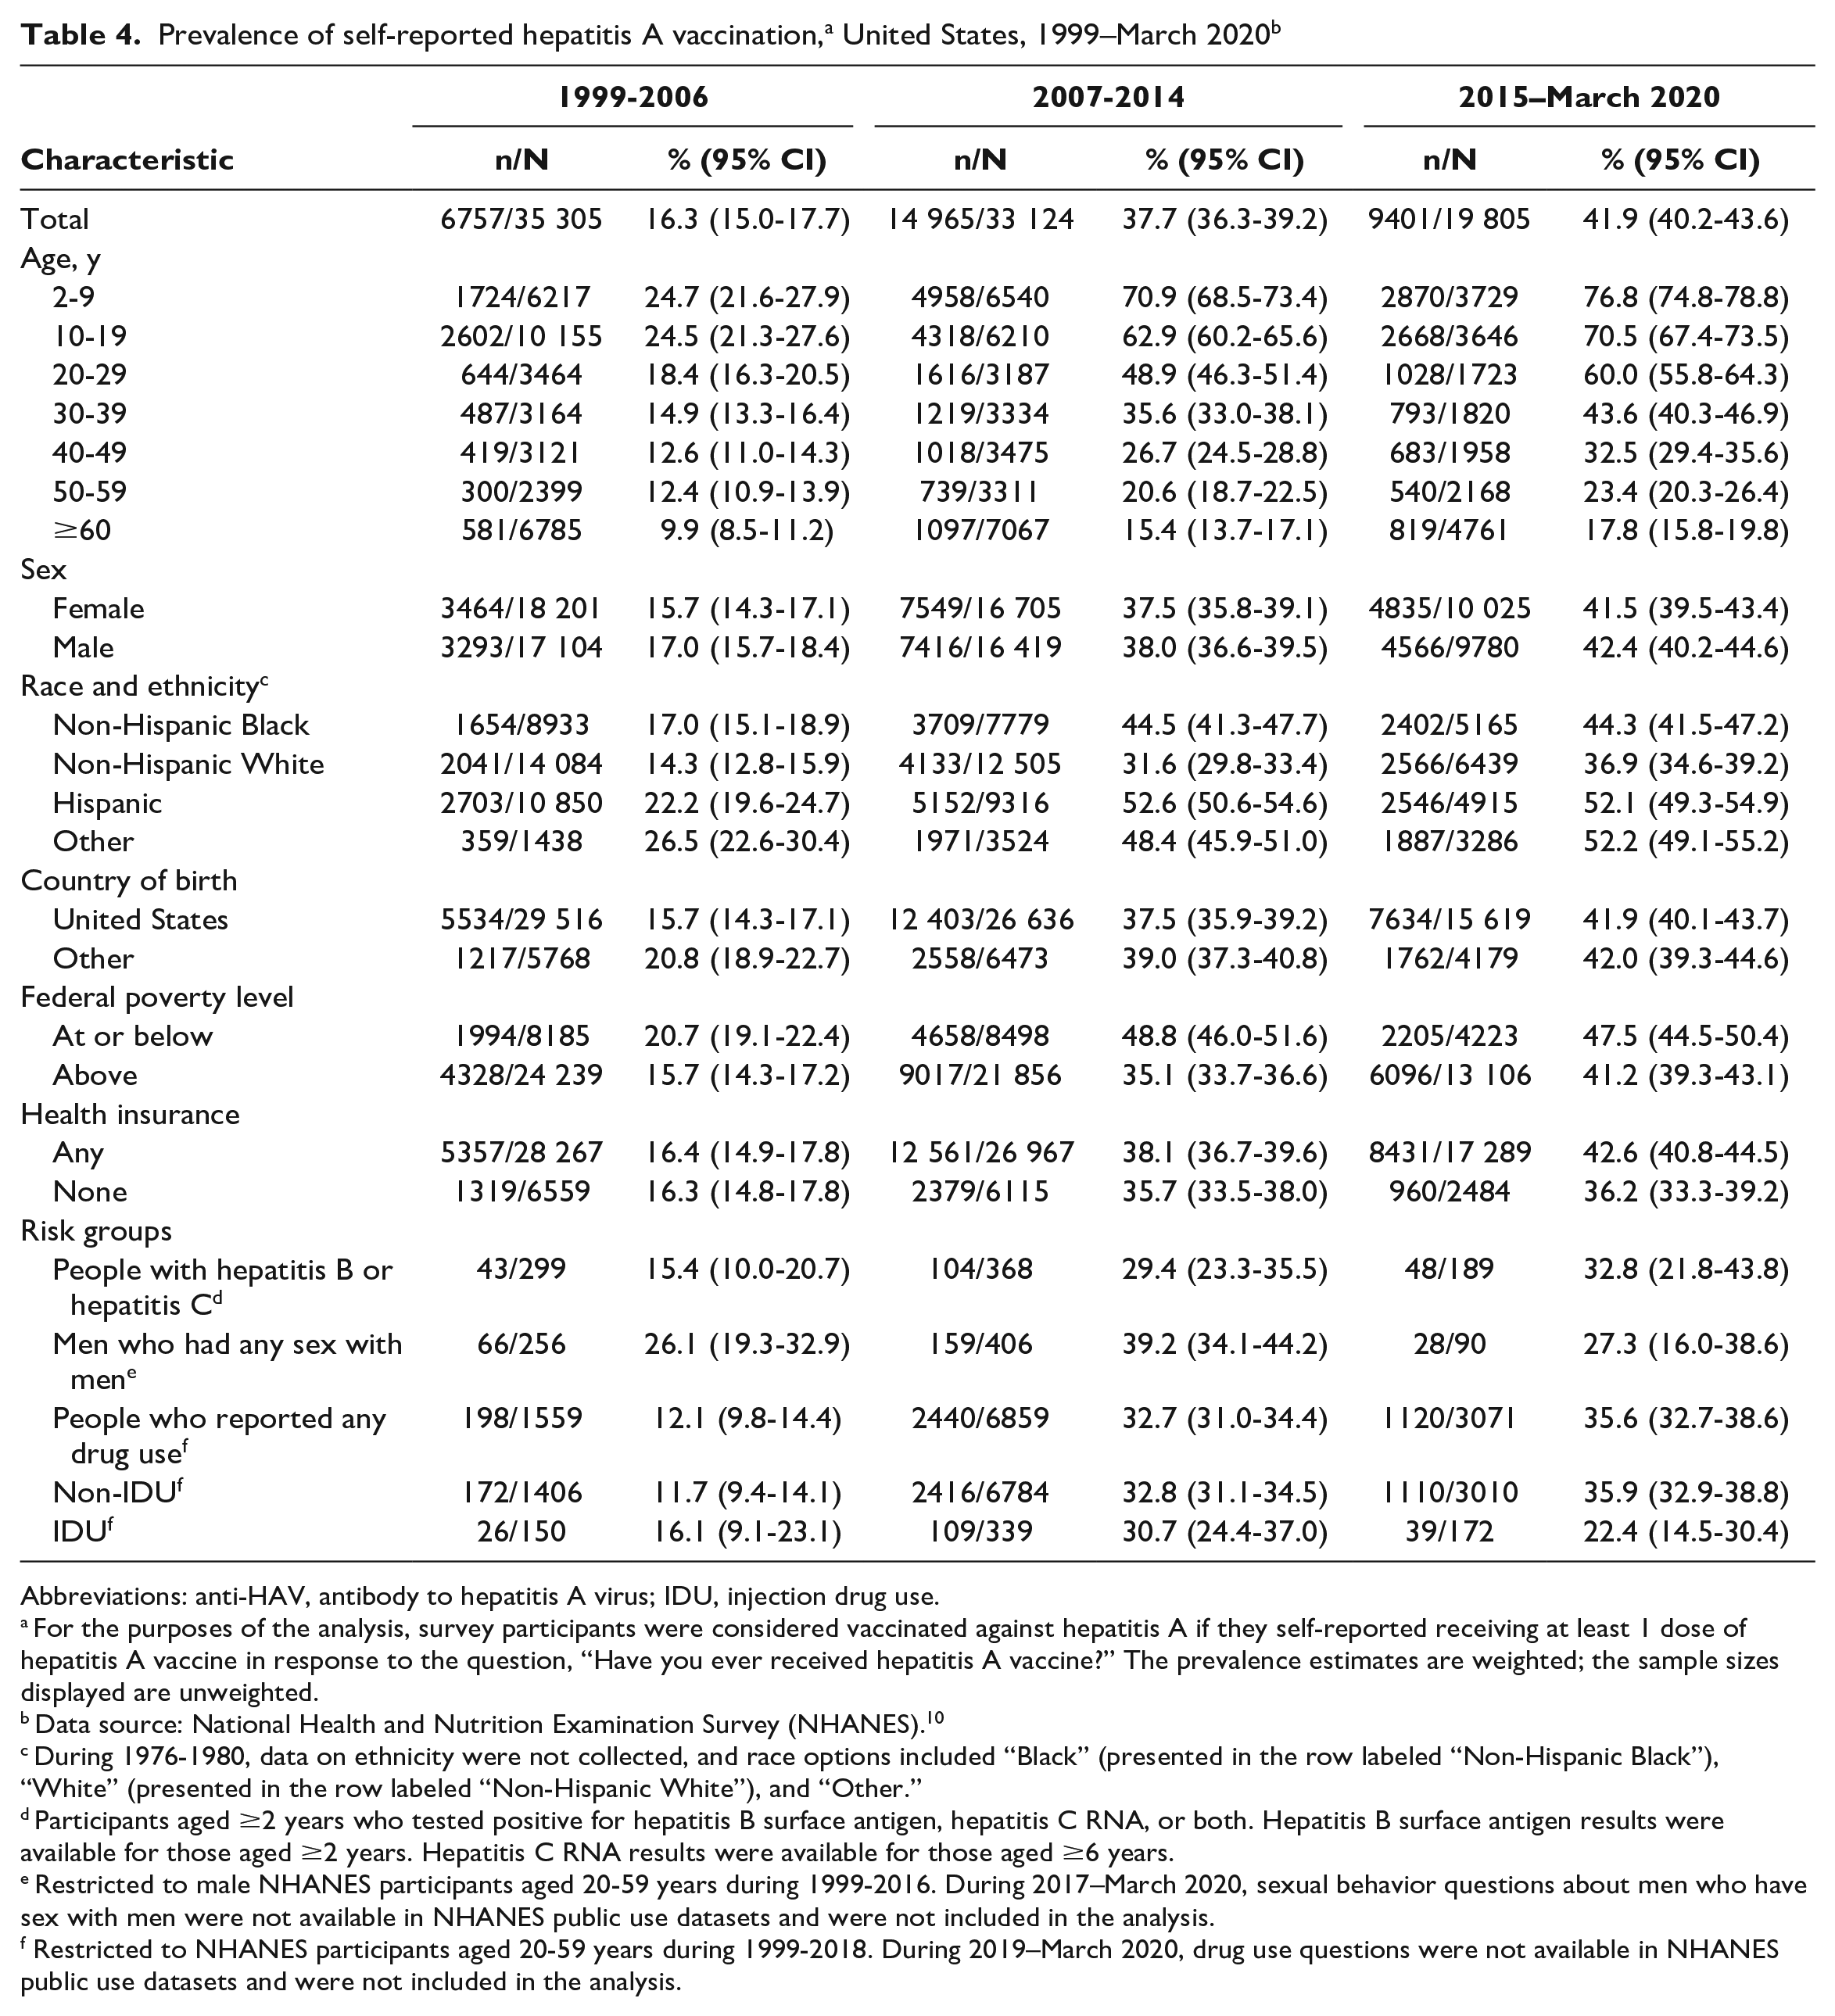
Overall, self-reported hepatitis A vaccination coverage in the United States increased more than 2.5-fold, from 16.3% (95% CI, 15.0%-17.7%) during 1999-2006 to 41.9% (95% CI, 40.2%-43.6%) during 2015–March 2020 (Table 4). We noted increases across all groups examined. Self-reported hepatitis A vaccination coverage rates were inversely related to age; across the analysis period, the highest rates were among the youngest age group, while decreasing rates were among increasingly older age groups. During 2015–March 2020, self-reported hepatitis A vaccination coverage was 76.8% among those aged 2-9 years, 70.5% among those aged 10-19 years, 60.0% among those aged 20-29 years, and 43.6% among those aged 30-39 years; self-reported hepatitis A vaccination coverage was <33% for all people aged ≥40 years. Throughout the analysis period, the self-reported vaccination coverage rate was higher among non-Hispanic Black, Hispanic, and non-Hispanic Other people than the overall national estimate, while coverage was lower among non-Hispanic White people than the overall national estimate.
Abbreviations: anti-HAV, antibody to hepatitis A virus; IDU, injection drug use.
For the purposes of the analysis, survey participants were considered vaccinated against hepatitis A if they self-reported receiving at least 1 dose of hepatitis A vaccine in response to the question, “Have you ever received hepatitis A vaccine?” The prevalence estimates are weighted; the sample sizes displayed are unweighted.
Data source: National Health and Nutrition Examination Survey (NHANES). 10
During 1976-1980, data on ethnicity were not collected, and race options included “Black” (presented in the row labeled “Non-Hispanic Black”), “White” (presented in the row labeled “Non-Hispanic White”), and “Other.”
Participants aged ≥2 years who tested positive for hepatitis B surface antigen, hepatitis C RNA, or both. Hepatitis B surface antigen results were available for those aged ≥2 years. Hepatitis C RNA results were available for those aged ≥6 years.
Restricted to male NHANES participants aged 20-59 years during 1999-2016. During 2017–March 2020, sexual behavior questions about men who have sex with men were not available in NHANES public use datasets and were not included in the analysis.
Restricted to NHANES participants aged 20-59 years during 1999-2018. During 2019–March 2020, drug use questions were not available in NHANES public use datasets and were not included in the analysis.
Self-reported hepatitis A vaccination coverage increased from 1999-2006 to 2015–March 2020 among all risk groups examined. However, self-reported vaccination coverage remained <36% for all risk groups during 2015–March 2020. Throughout the analysis period, the largest changes in self-reported vaccination coverage from 1999-2006 to 2015–March 2020 were among people who reported non–injection drug use, people who reported any drug use, and people with hepatitis B or hepatitis C (3.1-fold, 2.9-fold, and 2.1-fold increases, respectively), while smaller increases occurred among people who reported injection drug use (1.4-fold) and MSM (1.0-fold) (Table 4).
Discussion
Hepatitis A epidemiology in the United States has changed substantially since the condition first became nationally notifiable in 1966, owing largely to the 1996 introduction of hepatitis A vaccines and implementation of the 2006 ACIP recommendation for universal childhood vaccination. From 1990 to 2020, hepatitis A transitioned from a disease primarily affecting people aged <30 years, living in the western United States, and of Hispanic ethnicity, to a disease affecting people aged 30-49 years, living in the eastern and midwestern United States, and of non-Hispanic White race and ethnicity. Hepatitis A seroprevalence increased over time among people aged <30 years but decreased among those aged ≥30 years. Seroprevalence among adults at risk for HAV infection or serious consequences of HAV infection was lower than the national average among all risk groups examined in the analysis except for people with hepatitis B or hepatitis C. Similarly, self-reported vaccination coverage was lower than the national average among all risk groups examined, except MSM during 1999-2014.
The US populations that are most susceptible to HAV infection have shifted over time in response to the changing epidemiology and the introduction of hepatitis A vaccines. Prior to the introduction of hepatitis A vaccines, people aged ≤19 years were the most susceptible to HAV infection; however, during 2015–March 2020, they were the most highly protected against infection, and adults aged 30-59 years were the most susceptible to HAV infection. Among the race and ethnicity categories examined, non-Hispanic White people had the highest HAV infection susceptibility throughout the entire analysis period. In addition, during 1999–March 2020, all adult risk groups examined (except for people with hepatitis B or hepatitis C) had higher susceptibility to HAV infection than the overall national average.
During 2007-2014, the high levels of hepatitis A susceptibility among adults aged 20-59 years (>66%), non-Hispanic White people (>72%), and people who reported any drug use, injection drug use, or non–injection drug use (>71%) set the stage for the hepatitis A outbreaks associated with person-to-person transmission that have been widespread across the United States since 2016. These outbreaks have been unprecedented in the era of the hepatitis A vaccine; 37 states have been affected, and these states have reported >44 850 outbreak-associated cases, >27 400 hospitalizations, and approximately 421 deaths as of April 7, 2023.18,19 The US hepatitis A incidence rate increased 850% from the beginning of the outbreaks in 2016 to their peak in 2019. 4 As the epidemiology of susceptible populations shifted, people more likely to have severe outcomes (eg, hospitalization) represented an increasingly higher proportion of cases reported nationally. Infections have spread primarily through close contact among people who use drugs—a group recommended for hepatitis A vaccination by ACIP for more than 25 years—and people experiencing homelessness.20,21
Limitations
Our analysis had several limitations. First, risk factors and self-reported vaccination status are subject to social desirability and recall bias, which might have resulted in underestimates of the prevalence of risk factors and self-reported vaccination. Second, NNDSS is a passive surveillance system, and the capacity for case ascertainment and reporting varies considerably across states; case counts and incidence rates might underestimate the true prevalence of hepatitis A in the United States. Third, substantial data (approximately 19% of data on race and ethnicity, 34% of data on risk factors, and 70% of data on clinical outcomes) were missing from NNDSS hepatitis A reports during the analysis period (CDC, unpublished data), which might have introduced bias in our analysis. Fourth, NNDSS and NHANES lack data to describe hepatitis A incidence among people experiencing homelessness or incarceration, 2 groups that have increased risk for HAV infection; consequently, we were unable to calculate incidence rates, seroprevalence, and self-reported vaccination coverage for these groups. Fifth, NHANES used different anti-HAV assays during the analysis period, which might have resulted in varying prevalence estimates. However, previous research indicates that the impact would be minimal. 22
Conclusions
HHS and CDC have called for a reduction in new hepatitis A infections by 40% by 2025 and 65% by 2030.23,24 To reach the goal of eliminating hepatitis A as a public health threat, improved universal and catchup childhood vaccination and increased vaccination coverage among adult populations most affected by recent outbreaks are essential. Enhancements to core case surveillance are critical to support vaccination outreach and other preventive efforts. Improvements to variables collected in NNDSS are underway to better characterize the risk behaviors and exposures of people infected with HAV. In addition, investments in workforce development for disease intervention specialists will support jurisdictions in case investigation, linkage to preventive services, and outbreak control. 25 These investments are particularly important given the challenges often encountered during case investigations of people who use drugs, people experiencing homelessness, and people in correctional facilities, where loss to follow-up, mistrust of government, and stigma are often prevalent. Lastly, the call for a reduction in new hepatitis A infections is an important opportunity to leverage investments made to immunization information systems and vaccine infrastructure during the COVID-19 pandemic. Improved data quality and better linkage of surveillance systems and immunization registries with other data sources, such as Homeless Management Information Systems, Department of Corrections, and Medicaid databases, can provide a better understanding of the local epidemiology of hepatitis A and inform interventions for targeted and equitable vaccine delivery.
The epidemiology of hepatitis A has changed substantially during the past 4 decades. The public health gains we observed after the introduction of hepatitis A vaccines, however, have been interrupted by widespread outbreaks among people who use drugs and people experiencing homelessness. In the United States, hepatitis A is now a disease that primarily affects medically underserved people with inadequate access to preventive and community resources, and many people who experience increased risk for hepatitis A remain susceptible to infection and severe outcomes. Improvements to viral hepatitis surveillance, immunization information systems, vaccine delivery models, and services for disproportionately affected populations (eg, access to substance use treatment and sanitation) are needed to reduce health disparities and eliminate hepatitis A as a public health threat.
Footnotes
Disclaimer
The findings and conclusions in this article are those of the authors and do not necessarily represent the official position of the Centers for Disease Control and Prevention.
Declaration of Conflicting Interests
The authors declared no potential conflicts of interest with respect to the research, authorship, and/or publication of this article.
Funding
The authors received no financial support for the research, authorship, and/or publication of this article.