
Abstract
Objective:
Reports on recent mortality trends among adults aged ≥65 years are lacking. We examined trends in the leading causes of death from 1999 through 2020 among US adults aged ≥65 years.
Methods:
We used data from the National Vital Statistics System mortality files to identify the 10 leading causes of death among adults aged ≥65 years. We calculated overall and cause-specific age-adjusted death rates and then calculated the average annual percentage change (AAPC) in death rates from 1999 through 2020.
Results:
The overall age-adjusted death rate decreased on average by 0.5% (95% CI, −1.0% to −0.1%) per year from 1999 through 2020. Although rates for 7 of the top 10 causes of death decreased significantly, the rates of death from Alzheimer disease (AAPC = 3.0%; 95% CI, 1.5% to 4.5%) and from unintentional injuries (AAPC = 1.2%; 95% CI, 1.0% to 1.4%), notably falls (AAPC = 4.1%; 95% CI, 3.9% to 4.3%) and poisoning (AAPC = 6.6%; 95% CI, 6.0% to 7.2%), increased significantly.
Conclusion:
Public health prevention strategies and improved chronic disease management may have contributed to decreased rates in the leading causes of death. However, longer survival with comorbidities may have contributed to increased rates of death from Alzheimer disease and unintentional falls.
From 1960 through 2018, the all-cause age-adjusted death rate in the United States decreased by 46%. 1 Compared with life expectancy during previous decades, people in the United States are living longer. 2 By 2060, 1 in 4 people in the United States is projected to be aged ≥65 years. 2 However, reports on trends in mortality rates among adults aged ≥65 years are lacking. In this study, we examined and identified trends in the 10 leading causes of death among US adults aged ≥65 years from 1999 through 2020.
Methods
We accessed the National Vital Statistics System’s underlying cause of death data through the Centers for Disease Control and Prevention’s (CDC’s) Wide-ranging ONline Data for Epidemiologic Research (WONDER) 3 to identify leading causes of death among adults aged ≥65 years.
We classified the 10 leading underlying causes of death according to International Classification of Diseases, Tenth Revision (ICD-10) codes. 4 We used the following ICD-10 codes (1) I00-I09, I11, I13, and I20-I51 (heart disease); (2) C00-C97 (malignant neoplasms); (3) I60-I69 (cerebrovascular disease); (4) J40-J47 (chronic lower respiratory disease); (5) G30 (Alzheimer disease); (6) E10-E14 (diabetes mellitus); (7) J09-J18 (influenza and pneumonia); (8) V01-X59 and Y85-Y86 (unintentional injuries); (9) N00-N07, N17-N19, and N25-N27 (nephritis, nephrotic syndrome, and nephrosis); and (10) A40-A41 (septicemia). 4 We further classified deaths due to unintentional injuries into 7 additional categories, because prevention efforts differ based on the mechanism of injury, using the following ICD-10 codes: W00-W19 (falls); V01-V89, V91, and V93-V99 (transport-related deaths); W75-W84 (suffocation); X40-X49 (poisoning); X00-X19 (burns); W65-W74, V90, and V92 (drowning); and W20-W64, W85-W99, X20-X39, X50-X59, and Y85-Y86 (other unintentional injuries). 4
Overall and cause-specific death rates were age adjusted to the 2000 US standard population using the direct method. 3 We used Joinpoint version 4.7 software (National Cancer Institute) to calculate the average annual percentage change (AAPC) in age-adjusted death rates (and 95% CIs) from 1999 through 2020. We also calculated AAPCs by age group (65-74, 75-84, and ≥85 years) for each cause of death, post hoc, to explore how increasing age affected the overall results. When the 95% CI for AAPC did not contain 0, we described the death trend to have significantly increased or decreased based on the sign of the AAPC estimate.
Results
From 1999 through 2020, the age-adjusted death rate for all causes of death among adults aged ≥65 years decreased significantly on average by −0.5% (95% CI, −1.0% to −0.1%) per year (Table 1). The rates of 7 of the 10 leading causes of death decreased significantly, whereas the rates of deaths due to Alzheimer disease increased by 3.0% (95% CI, 1.5% to 4.5%) and that of unintentional injuries by 1.2% (95% CI, 1.0% to 1.4%) per year. The death rates for nephritis, nephrotic syndrome, and nephrosis remained stable (AAPC = −0.5%; 95% CI, −1.2% to 0.2%).
Rates and average annual percentage change (AAPC) in rates of the top causes of death among adults aged ≥65 years, United States, 1999 through 2020 a
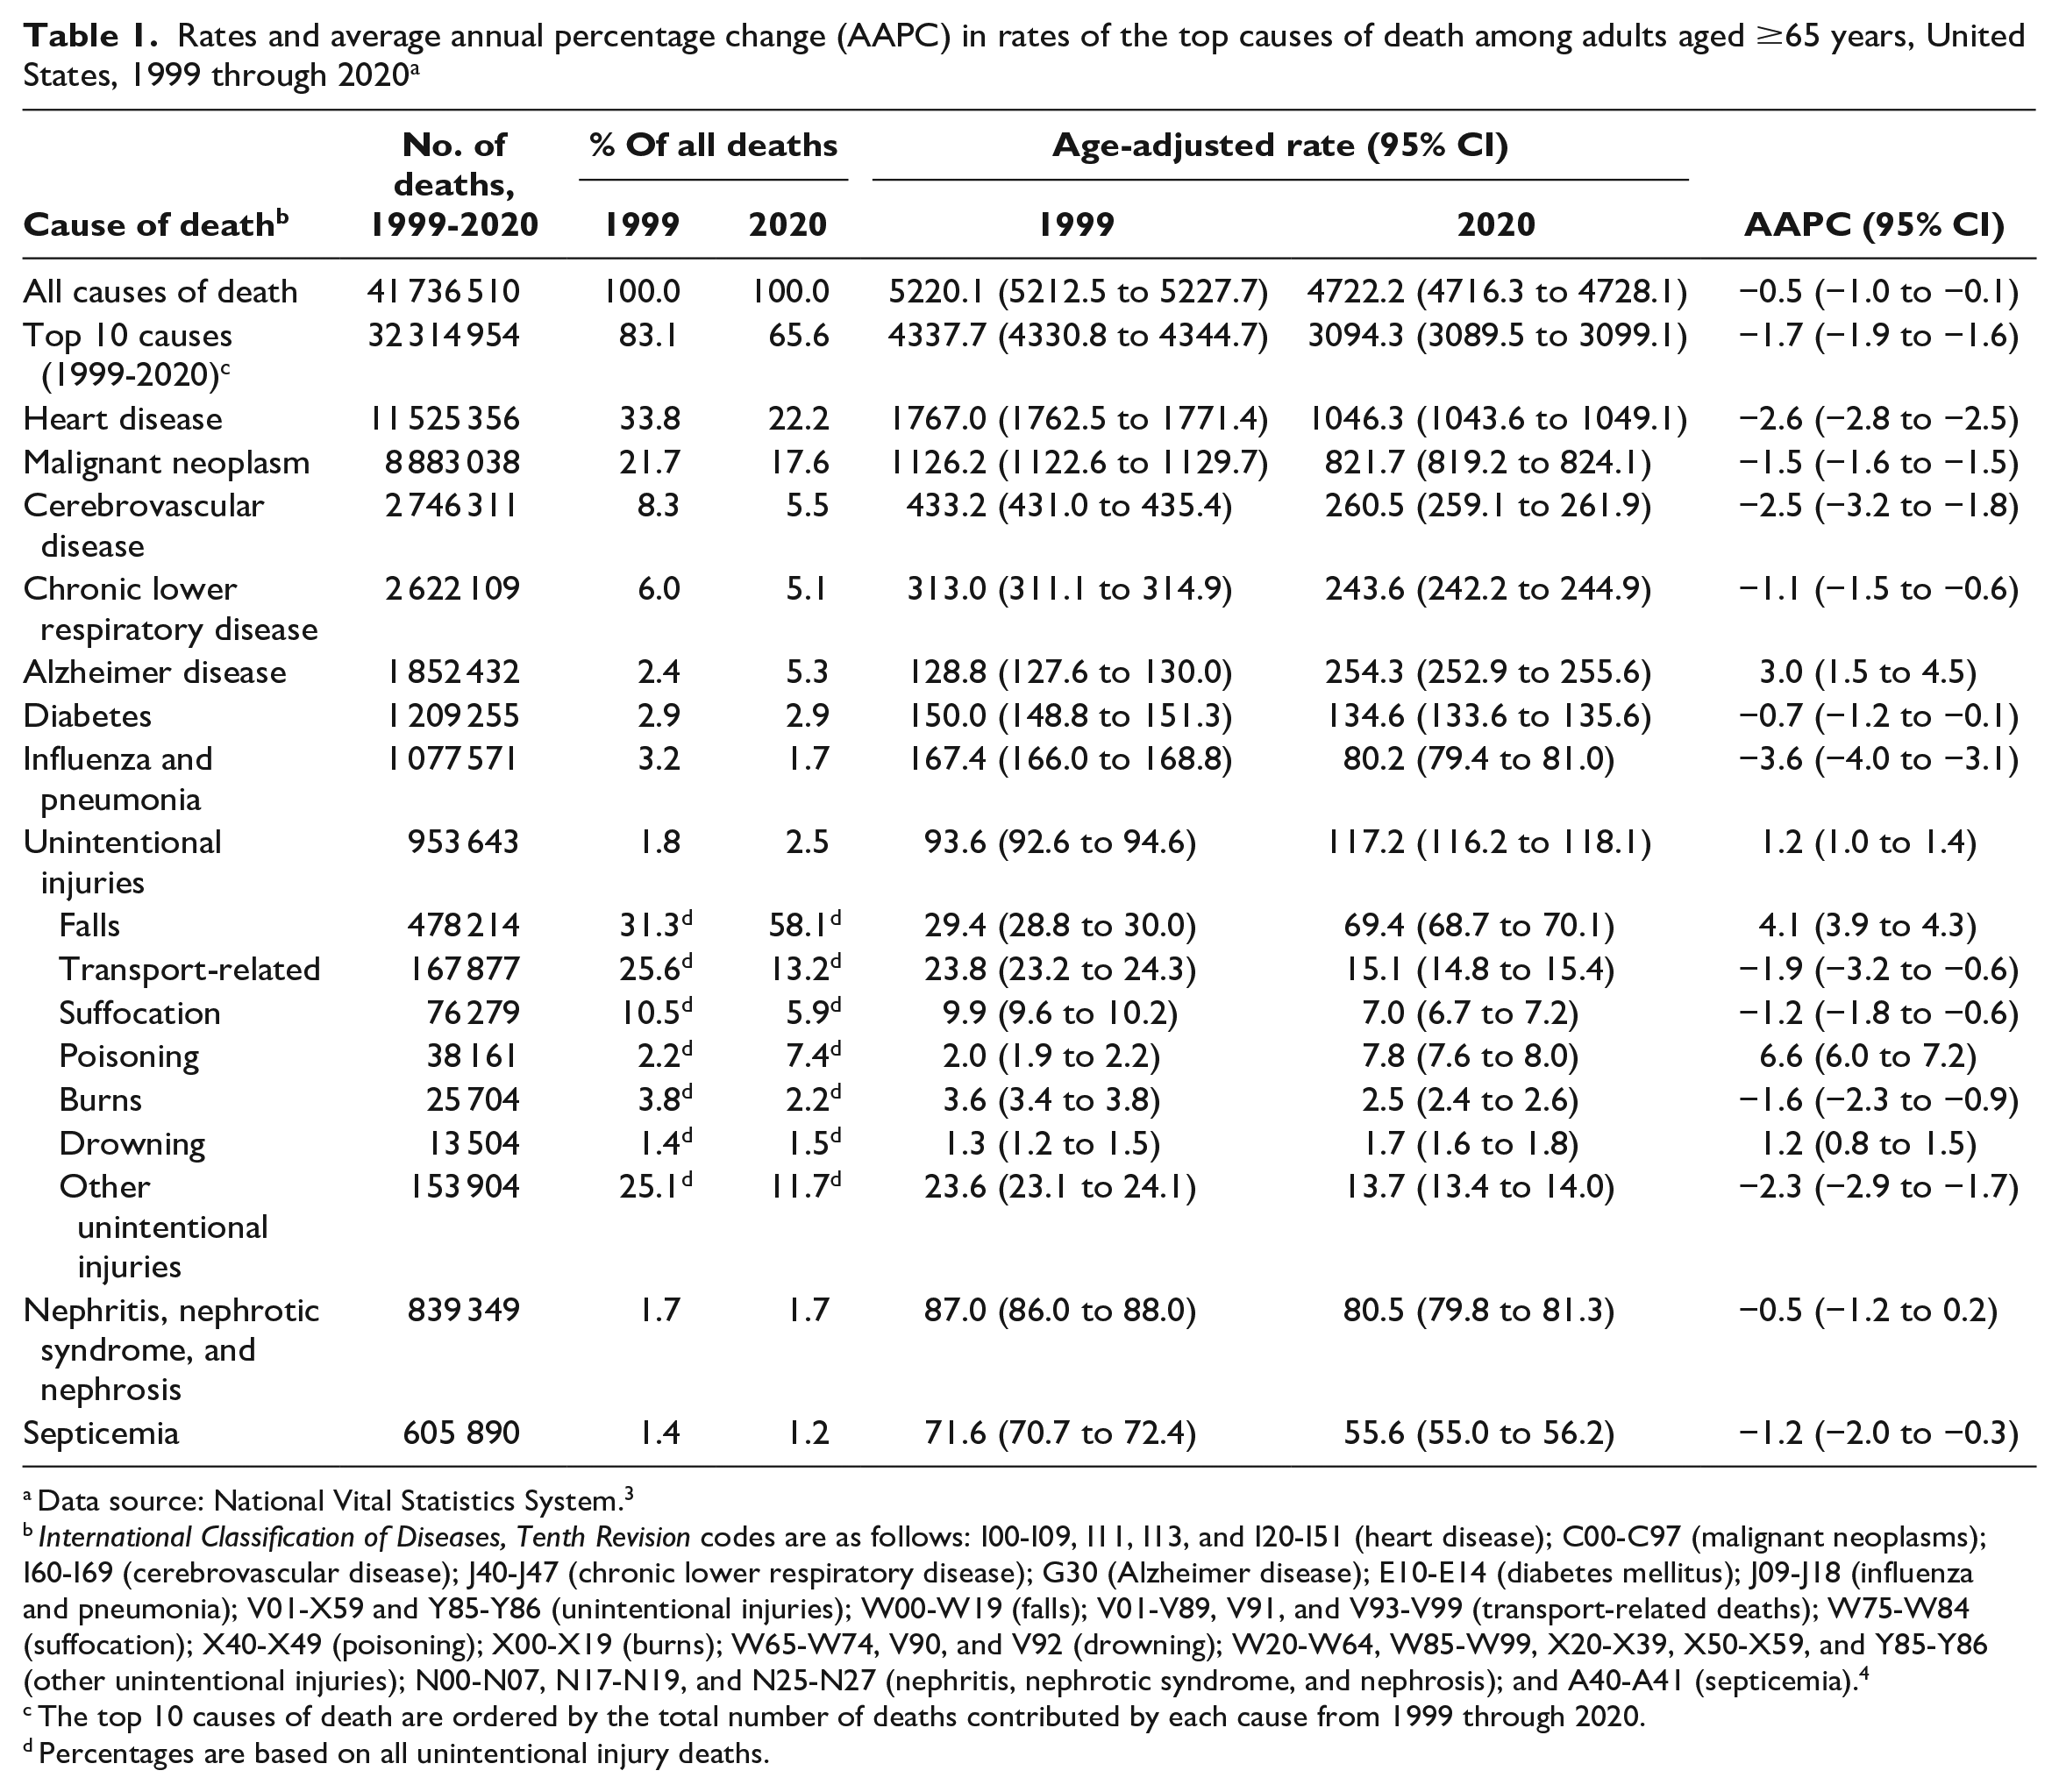
Data source: National Vital Statistics System. 3
International Classification of Diseases, Tenth Revision codes are as follows: I00-I09, I11, I13, and I20-I51 (heart disease); C00-C97 (malignant neoplasms); I60-I69 (cerebrovascular disease); J40-J47 (chronic lower respiratory disease); G30 (Alzheimer disease); E10-E14 (diabetes mellitus); J09-J18 (influenza and pneumonia); V01-X59 and Y85-Y86 (unintentional injuries); W00-W19 (falls); V01-V89, V91, and V93-V99 (transport-related deaths); W75-W84 (suffocation); X40-X49 (poisoning); X00-X19 (burns); W65-W74, V90, and V92 (drowning); W20-W64, W85-W99, X20-X39, X50-X59, and Y85-Y86 (other unintentional injuries); N00-N07, N17-N19, and N25-N27 (nephritis, nephrotic syndrome, and nephrosis); and A40-A41 (septicemia). 4
The top 10 causes of death are ordered by the total number of deaths contributed by each cause from 1999 through 2020.
Percentages are based on all unintentional injury deaths.
Among 953 643 deaths from unintentional injuries during the study period, half (50.1%) were from falls. Rates of deaths from falls increased by 136% from 1999 through 2020, at an AAPC of 4.1% (95% CI, 3.9% to 4.3%) (Table 1). Except for deaths from poisoning (AAPC = 6.6%; 95% CI, 6.0% to 7.2%) and drowning (AAPC = 1.2%; 95% CI, 0.8% to 1.5%), the rates of deaths from all other types of unintentional injuries decreased.
We observed higher increases in rates of death from falls among adults aged ≥85 years (AAPC = 4.8%; 95% CI, 4.5% to 5.0%) than among adults aged 65-74 years (AAPC = 3.5%; 95% CI, 3.0% to 3.9%) and 75-84 years (AAPC = 3.7%; 95% CI, 3.4% to 4.0%) (Table 2). However, we found a larger increase in the rate of death from unintentional poisonings among adults aged 65-74 years (AAPC = 10.2%; 95% CI, 9.5% to 10.9%) than among adults aged 75-84 years (AAPC = 2.2%; 95% CI, 1.1% to 3.3%). The rate of death from unintentional poisonings decreased significantly among adults aged ≥85 years (AAPC = −1.1%; 95% CI, −2.1% to −0.1%).
Average annual percentage change (AAPC) in rates of the top causes of death among adults aged ≥65 years, by age group, United States, 1999 through 2020 a
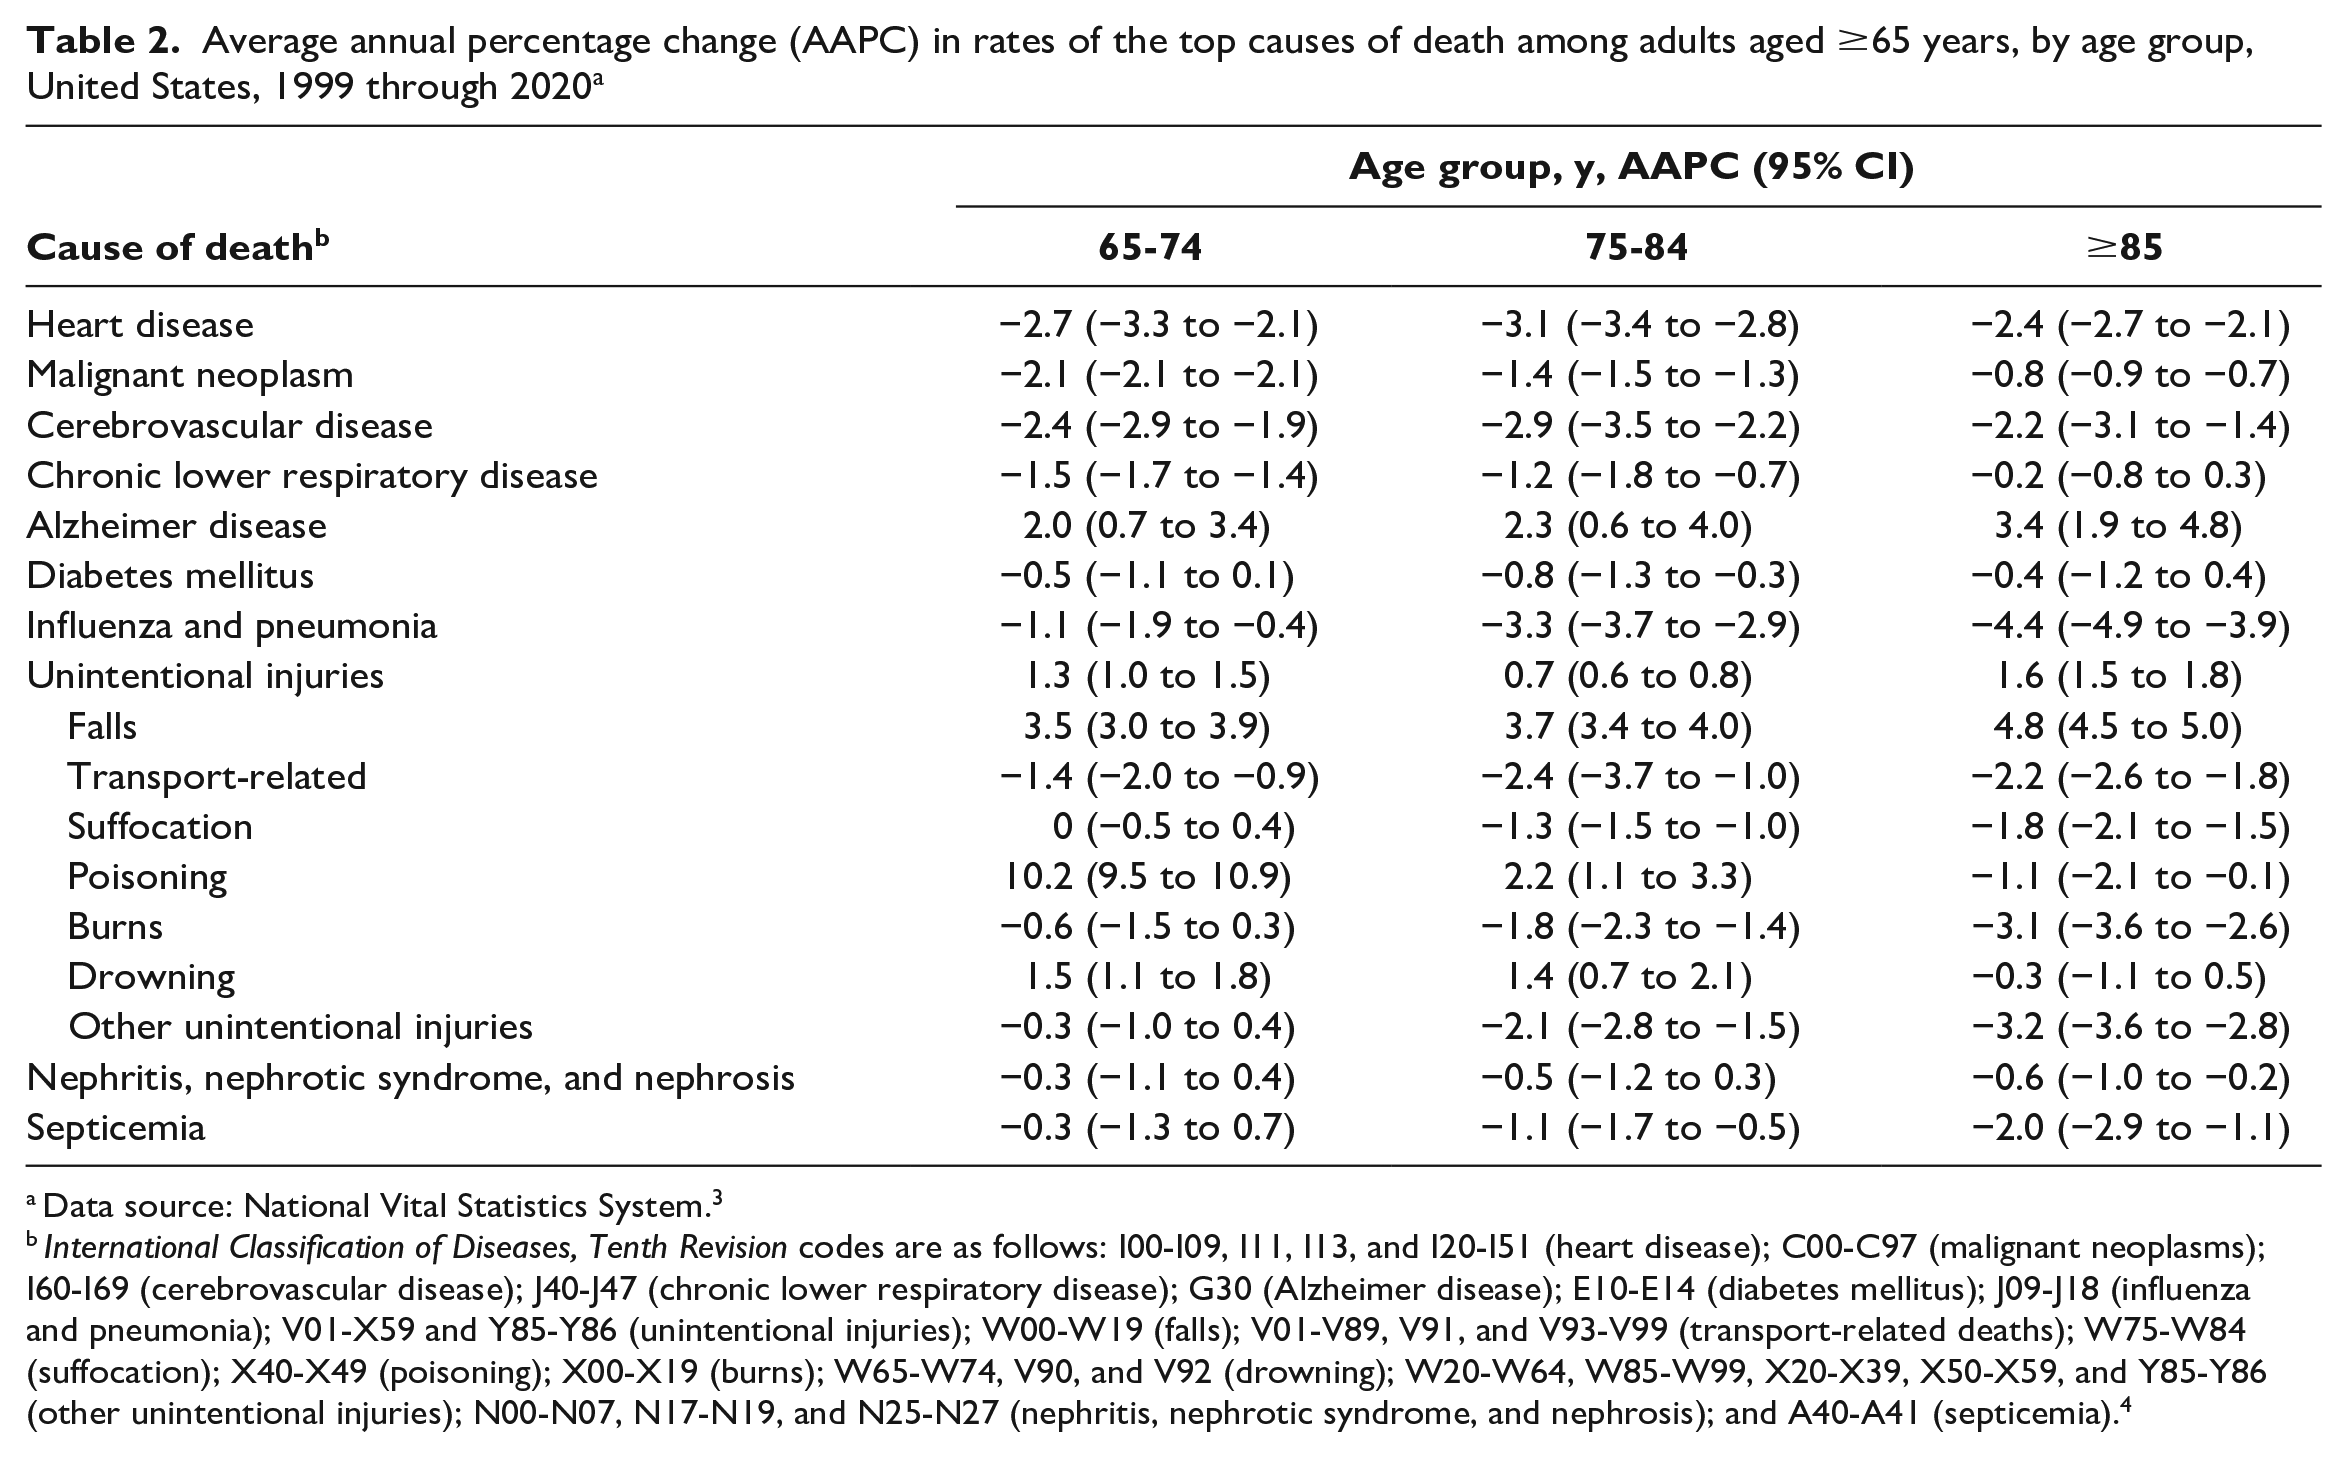
Data source: National Vital Statistics System. 3
International Classification of Diseases, Tenth Revision codes are as follows: I00-I09, I11, I13, and I20-I51 (heart disease); C00-C97 (malignant neoplasms); I60-I69 (cerebrovascular disease); J40-J47 (chronic lower respiratory disease); G30 (Alzheimer disease); E10-E14 (diabetes mellitus); J09-J18 (influenza and pneumonia); V01-X59 and Y85-Y86 (unintentional injuries); W00-W19 (falls); V01-V89, V91, and V93-V99 (transport-related deaths); W75-W84 (suffocation); X40-X49 (poisoning); X00-X19 (burns); W65-W74, V90, and V92 (drowning); W20-W64, W85-W99, X20-X39, X50-X59, and Y85-Y86 (other unintentional injuries); N00-N07, N17-N19, and N25-N27 (nephritis, nephrotic syndrome, and nephrosis); and A40-A41 (septicemia). 4
Discussion
The overall age-adjusted rate of death among US adults aged ≥65 years decreased from 1999 through 2020. Advances in the treatment of established disease, effective prevention through vaccinations and cancer screening, focus on the reduction of risk factors (eg, smoking, blood pressure, cholesterol), and programs aimed at promoting physical activity may have influenced the observed declines.2,5-9 However, rates of death from Alzheimer disease and unintentional injuries, notably falls and poisoning, increased during the study period. Although the growth in population of people aged ≥65 years could partly explain the increase in the number of deaths from Alzheimer disease and unintentional falls, the significant increase in the age-adjusted rates suggests other reasons.
Rates of death from Alzheimer disease have been increasing among both men and women and among all racial and ethnic groups, with rates higher among women than among men and among people who are non-Hispanic White than among people of other racial and ethnic groups. 10 From 1999 through 2014, the rates of death from Alzheimer disease increased in 40 states and the District of Columbia. 10 Details on geographic variations and potential reasons for increasing rates of death from Alzheimer disease, such as increases in premorbid Alzheimer diagnosis, are discussed elsewhere. 10
Similarly, rates of death from falls have also been increasing among men and women and among all racial and ethnic groups.3,11 However, rates of death from falls are higher among men than among women and higher among non-Hispanic White and American Indian/Alaska Native people than among people of other racial and ethnic groups.3,11 From 2006 through 2017, rates of death from falls increased in 30 states and the District of Columbia. 11 In 2017, the state-specific rates of death per 100 000 population from falls ranged from 24.4 in Alabama to 142.7 in Wisconsin. 11 Differences in racial and ethnic composition, general health of the residents, and differential coding and reporting practices on death certificates are possible reasons for geographic variations in rates of death from falls. 11
The reasons for the increasing trends in deaths from falls are not fully understood. Increased survival after the onset of common chronic diseases, such as heart disease, stroke, and cancer, could mean a longer period of frailty and disability and increased risk of falls. 12 Although rates of death from falls increased among all 3 age groups in our study, rate changes were highest among adults aged ≥85 years. With decreasing mortality rates and greater life expectancy, the number of older adults with multiple chronic conditions has increased. 13 About 60% of adults aged 65-74 years and 80% of adults aged ≥85 years have ≥2 chronic conditions. 13 Having comorbidities (eg, diabetes, congestive heart failure, chronic kidney disease), in the presence of age-related physical and physiological changes, puts adults in older age groups at high risk of falls. 14 In addition, the use of drugs classified as increasing risk of falls (eg, benzodiazepines, opioids, antidepressants) has increased during the past 2 decades among adults aged ≥65 years. 15 From 1999 through 2017, the percentage of older adults using ≥1 of these drugs, including antihypertensives, increased by 65%, which may partly explain the concurrent rise in rates of mortality from falls. 15 In addition, despite an aging population and the high economic and public health burden of falls among older adults, personal and clinical barriers to falls prevention practices remain. 16 Some older adults perceive falls as a “normal” part of aging, are unaware of their risk of falls, or attribute the cause of a fall to environmental factors such as slippery floors. 16 Other adults are hesitant to have discussions about falls with health care providers, perhaps because of stigma associated with falling or the fear of losing their independence. 16 Self-reported barriers for health care providers include time constraints, competing medical priorities, and the lack of a sufficient level of awareness about falls prevention compared with other routine preventive measures such as cancer screening. 16
Limitations
Our study had some limitations. First, in death certificates, the underlying cause of death depends on the medical opinion of the certifier (eg, physician, medical examiner, coroner) and could overestimate or underestimate cause-specific death rates. 17 Second, because we included data from 2020, the results reflected changes in mortality due to the COVID-19 pandemic. From 2019 through 2020, the overall age-adjusted death rates per 100 000 adults aged ≥65 years increased from 4073.8 to 4722.2. 3 Death rates from 1999 through 2019 decreased on average by 1.3% per year (data not shown); however, with the addition of 2020 data, the decrease dropped to 0.5% per year. In addition to Alzheimer disease and unintentional injuries, the age-adjusted rates (per 100 000 adults aged ≥65 years) of the following causes of death increased from 2019 to 2020: heart diseases (from 1020.9 to 1046.3), cerebrovascular diseases (from 250.0 to 260.5), diabetes (from 119.4 to 134.6), and influenza and pneumonia (from 77.8 to 80.2). 3 However, because our analysis included 22 years of data, these increases in 2020 did not significantly alter trends in cause-specific death rates. The AAPCs in causes of death for 1999 through 2019 were similar to AAPCs in causes of death for 1999 through 2020. Investigation into COVID-19–related changes in overall and cause-specific trends was beyond the scope of our study. Third, the top 10 leading causes of death in our study were for the combined period of 1999 through 2020. A few changes occurred in the leading causes of death from 2017 to 2020. In 2017, 2018, and 2019, Parkinson disease was the 10th leading cause of death instead of septicemia. 3 In 2020, COVID-19 was the 3rd leading cause of death, and Parkinson disease ranked 11th. 3
Conclusions
The rates for 7 of the 10 leading causes of death among adults aged ≥65 years decreased significantly from 1999 through 2020. Exceptions included increases in rates of death from Alzheimer disease and unintentional injuries. These changes in cause-specific mortality suggest the need for more consideration in how we treat and care for adults aged ≥65 years in the United States. Preventive strategies such as screening and risk factor reduction, which may have influenced the decline in deaths from heart disease, stroke, and cancer, could be used to address the rising rates of death from Alzheimer disease and unintentional falls. Chronic disease management through proactive, primary care–focused, person-centered, team-based approaches such as the Chronic Care Model has improved clinical outcomes among patients with heart disease, diabetes, and hypertension, especially when multiple components of the model are implemented.18-23 The Chronic Care Model is an organizational approach to chronic disease management in primary care that includes 6 components: self-management support, decision support, delivery system design, clinical information systems, health care organization, and community resources. 22 Newer models similar to the Chronic Care Model are being tested among people with dementia, and results for improved process outcomes are promising. 24 Falls are also a complex, multifactorial chronic condition. Adults aged ≥65 years may benefit from approaches such as the Chronic Care Model to reduce the risk of falls and mortality from falls. Encouraging health care providers to screen and assess for risk of falls and to regard falls as a chronic condition could be one strategy for early intervention. Promoting physical activity, with an emphasis on regular, structured strength and balance exercises, could also provide benefits for prevention of falls and other chronic conditions among adults aged ≥65 years. Clinical resources for the prevention of falls, including medication management, are available at CDC’s Stopping Elderly Accidents, Deaths, and Injury website. 25
Footnotes
Disclaimer
The findings and conclusions in this article are those of the authors and do not necessarily represent the official position of the Centers for Disease Control and Prevention.
Declaration of Conflicting Interests
The authors declared no potential conflicts of interest with respect to the research, authorship, and/or publication of this article.
Funding
The authors received no financial support for the research, authorship, and/or publication of this article.