
Abstract
Objective:
State-issued behavioral policy interventions (BPIs) can limit community spread of COVID-19, but their effects on COVID-19 transmission may vary by level of social vulnerability in the community. We examined the association between the duration of BPIs and the incidence of COVID-19 across levels of social vulnerability in US counties.
Methods:
We used COVID-19 case counts from USAFacts and policy data on BPIs (face mask mandates, stay-at-home orders, gathering bans) in place from April through December 2020 and the 2018 Social Vulnerability Index (SVI) from the Centers for Disease Control and Prevention. We conducted multilevel linear regression to estimate the associations between duration of each BPI and monthly incidence of COVID-19 (cases per 100 000 population) by SVI quartiles (grouped as low, moderate low, moderate high, and high social vulnerability) for 3141 US counties.
Results:
Having a BPI in place for longer durations (ie, ≥2 months) was associated with lower incidence of COVID-19 compared with having a BPI in place for <1 month. Compared with having no BPI in place or a BPI in place for <1 month, differences in marginal mean monthly incidence of COVID-19 per 100 000 population for a BPI in place for ≥2 months ranged from –4 cases in counties with low SVI to –401 cases in counties with high SVI for face mask mandates, from –31 cases in counties with low SVI to –208 cases in counties with high SVI for stay-at-home orders, and from –227 cases in counties with low SVI to –628 cases in counties with high SVI for gathering bans.
Conclusions:
Establishing COVID-19 prevention measures for longer durations may help reduce COVID-19 transmission, especially in communities with high levels of social vulnerability.
As of September 2022, more than 95 million confirmed COVID-19 cases and more than 1 million deaths associated with COVID-19 had occurred in the United States. 1 Behavioral policy interventions (BPIs), such as face mask mandates, stay-at-home orders, and gathering bans, have been adopted across the United States to prevent and slow the community spread of COVID-19. Previous studies suggest that BPIs can effectively reduce the incidence of COVID-19 and limit severe COVID-19 outcomes across US communities.2-5 For example, face mask mandates have been shown to reduce community transmission of COVID-19 and reduce community trends of increasing COVID-19 incidence, hospitalizations, and deaths.2-5 In addition, stay-at-home orders have been associated with reductions in COVID-19 incidence,5-8 and gathering bans have been found to limit community transmission of COVID-19.9,10 Adopting and maintaining BPIs are important ways for communities to reduce COVID-19 transmission and respond to the COVID-19 pandemic.
Transmission of COVID-19 can differ by levels of social vulnerability within a community; social vulnerability refers to the demographic and socioeconomic factors that place communities at increased risk of exposure to the adverse effects of community-level stressors, such as pandemics.11,12 Such factors include having a low income, which may be associated with essential jobs that must be performed in person, or not having access to a personal vehicle, which may contribute to the use of crowded public transportation, increasing one’s exposure to COVID-19. 13 Generally, social vulnerability has been associated with incidence of COVID-19, mortality from COVID-19, and increased probability that a community becomes a COVID-19 hot spot.14-16 The level of social vulnerability within a community may also be associated with unique structural barriers to BPIs. For example, because of different workplace settings, low-income communities have more economic barriers to stay-at-home orders than high-income communities. 17 Thus, social vulnerability may place barriers on the use of BPIs.
Existing literature suggests a significant association between BPIs and a reduction in COVID-19–related outcomes (eg, incidence, mortality), and this association may vary by level of social vulnerability within a community.2-6,8-10 Given the importance of social vulnerability as a barrier to BPIs and to the transmission of COVID-19, a better understanding of the association between BPIs and incidence of COVID-19 is needed so that BPIs and other interventions can be more appropriately applied in communities that have been historically, economically, and socially marginalized. To understand this association, we examined the association between the duration of 3 types of BPIs (face mask mandates, stay-at-home orders, and gathering bans) and monthly incidence of COVID-19 by level of social vulnerability in US counties from April through December 2020, which preceded the large-scale vaccine rollout.
Methods
Data Sources and Study Measures
We obtained social vulnerability data from the 2018 Centers for Disease Control and Prevention (CDC)/Agency for Toxic Substances and Disease Registry Social Vulnerability Index (SVI) database for all US counties.11,12,18 We measured county-level social vulnerability by overall SVI and the 4 SVI themes that represent different dimensions of social vulnerability. The themes included the following: (1) socioeconomic status, (2) household composition and disability, (3) racial or ethnic minority status and language, and (4) housing type and transportation. We grouped US counties into low, moderate low, moderate high, and high social vulnerability by categorizing overall SVI and the 4 SVI themes into quartiles. The higher the SVI score, the greater the social vulnerability of a county. Because of missing SVI data for 1 county, we included 3141 counties in the analysis.
We obtained county-level data on state-issued face mask mandates, stay-at-home orders, and gathering bans in the United States in 2020 from the CDC Policy Surveillance database, which provided standardized daily status of these BPIs in each county from April through December 2020.19-21 For these county-level datasets, most counties followed state-issued administrative or executive orders, but counties in some states could implement their own BPIs, which were different from the state-issued BPIs. Implementation of state-issued face mask mandates was defined as whether face mask wearing was required in public in a county, implementation of stay-at-home orders was defined as whether any type of mandatory stay-at-home order was in effect in a county, and implementation of gathering bans was defined as bans on gathering in groups of more than 10 people in a county.3,22,23 Based on the definition of each BPI, we created a duration variable that represented the following BPI policies in a county in a given month: no BPI or a BPI in place for <1 month (reference; 0 to <1 month), a BPI in place for 1 to <2 months, and a BPI in place for ≥2 months. The duration of a BPI in place may change from month to month within a county. Further details on the definition of each BPI and the duration variables of each BPI are provided in supplement methods sections S1.1, S1.2, and Table S1.
We calculated county-level monthly incidence of COVID-19 (cases per 100 000 population) from April through December 2020 using cumulative daily COVID-19 case counts from USAFacts, which is a nonpartisan, nonprofit organization that collects and provides COVID-19 epidemiologic data from CDC and state and local public health departments. 24 We included population size and urbanicity as control variables. We extracted data on population size at the county level from USAFacts. 24 For urbanicity, we classified counties into large metropolitan (large central and large fringe metropolitan), metropolitan (medium and small metropolitan), and nonmetropolitan (micropolitan and noncore) using the 2013 National Center for Health Statistics urban–rural classification for counties. 25
Statistical Analyses
We conducted multilevel linear regression modeling to estimate the association between the duration of a BPI in place and monthly incidence of COVID-19 by quartiles of overall SVI and the 4 SVI themes (Supplemental Table S2). We adjusted the regression models by county-level attributes, including population size and urbanicity. Multilevel modeling can simultaneously account for the dependent monthly incidence of COVID-19 clustered within a county and state and adjust for county-level attributes.26,27 After model estimation, we conducted post hoc analyses to investigate the following: (1) associations between the marginal mean monthly incidence of COVID-19 and duration of a BPI by levels of overall SVI and (2) differences in the marginal mean monthly incidence of COVID-19 by duration of a BPI (ie, a BPI in place for 1 to <2 months or ≥2 months) compared with no BPI or a BPI in place for <1 month at each level of overall SVI. We estimated the marginal mean monthly incidence of COVID-19 for various durations of a BPI (0 to <1 month, 1 to <2 months, ≥2 months) at each level of overall social vulnerability by averaging the predicted incidence across levels of other factors (urbanicity, month, and duration of the other BPIs), conditional on mean population size.
We mapped the bivariate geographic distribution of overall SVI and the predicted incidence of COVID-19 in December 2020 based on various durations of a BPI (0 to <1 month, ≥2 months) among all US counties. For the predicted county-level incidence of COVID-19 mapped for December 2020, we used multilevel model estimations instead of actual incidence of COVID-19. Details about the model specification, post hoc analyses, and predicted COVID-19 incidence are described in supplement methods sections S1.3 to S1.5. We replicated the multilevel model and post hoc analyses for all 4 SVI themes. We conducted statistical analyses and post hoc analyses in R version 4.1.0 (R Foundation for Statistical Computing) with packages lme4 and emmeans. For mapping, we used ArcMap version 10.8 (Esri). CDC reviewed our study, which we conducted consistent with applicable federal law and CDC policy (protection of human subjects, 45 CFR part 46 [2018]; institutional review board, 21 CFR part 56 [1981]; public health and welfare, research, and investigations generally, 42 USC §241[d] [2018]; public information; agency rules, opinions, orders, records, and proceedings: records maintained on individuals, 5 USC §552a [2012]; and Paperwork Reduction Act, 44 USC §3501 et seq [1995]). The CDC Institutional Review Board waived ethical review because all study data were publicly available.
Results
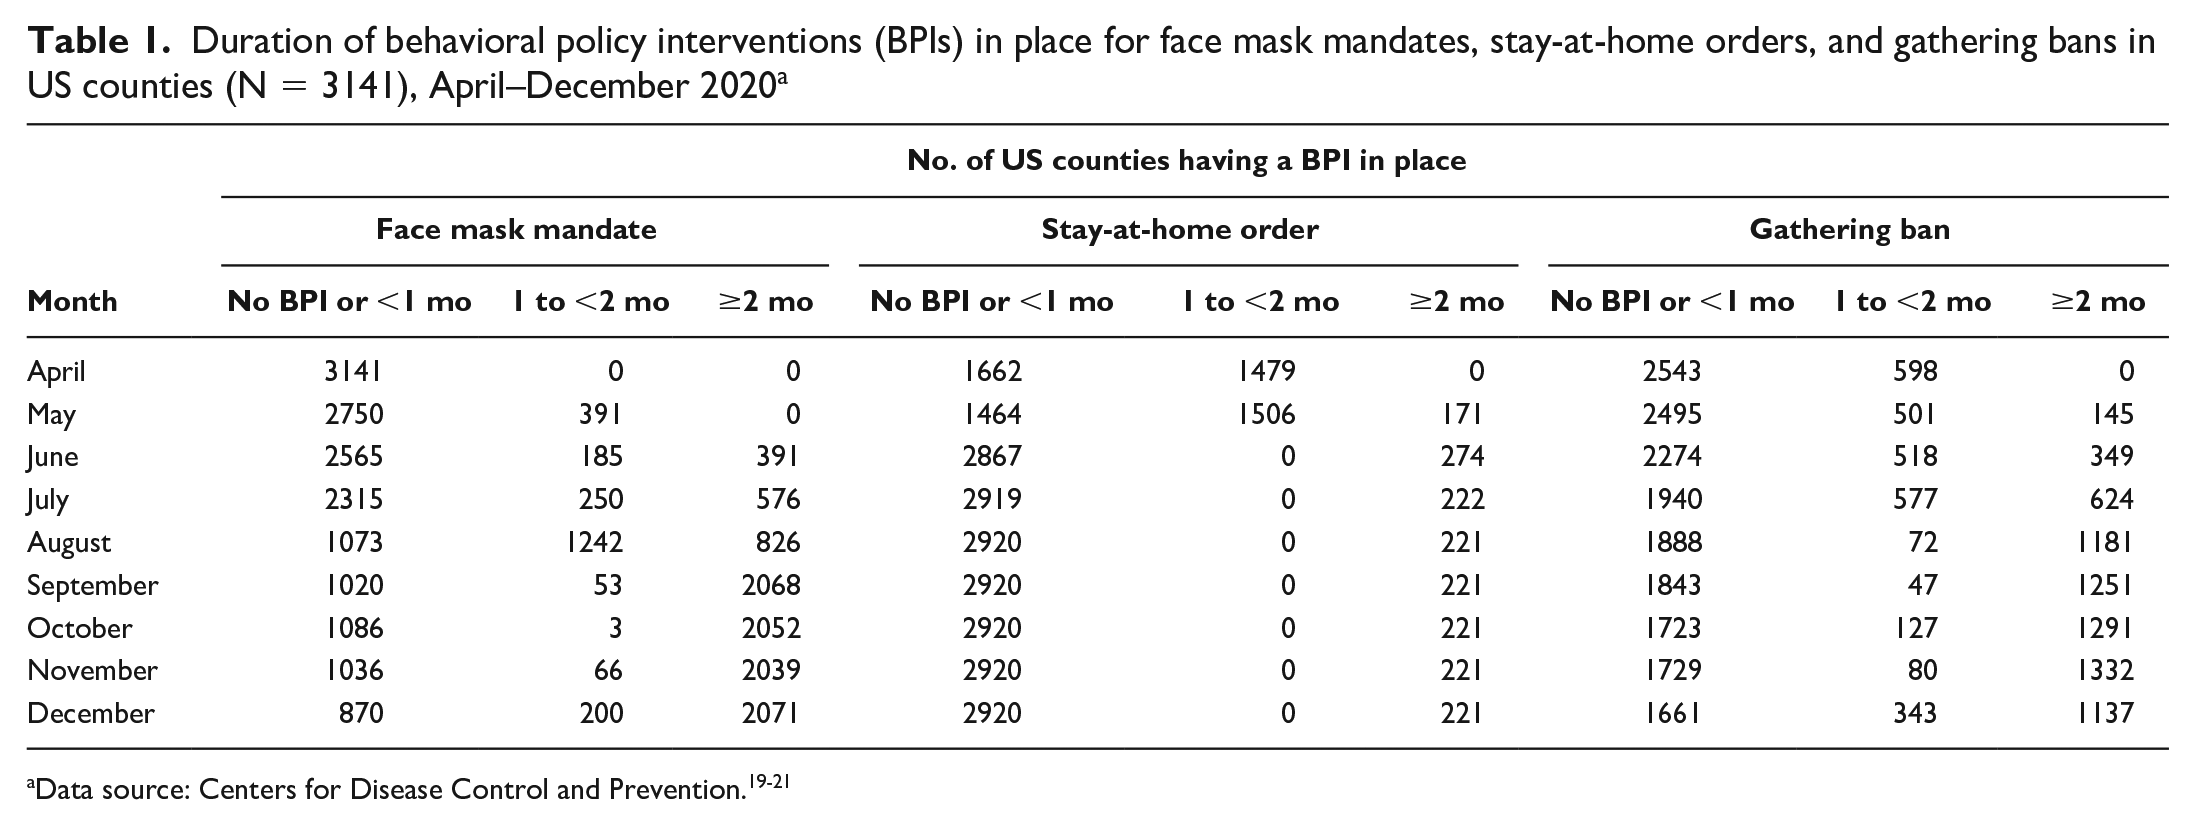
From April through December 2020, the prevalence of a BPI adopted among US counties differed by type of BPI and changed from month to month (Table 1). For face mask mandates, in April 2020, all 3141 US counties included in our study either did not have a face mask mandate in place or had a mandate in place for <1 month. By December 2020, 2271 (72.3%) counties had a face mask mandate in place for ≥1 month. For gathering bans, 2543 (81.0%) counties did not have a gathering ban in place or had a gathering ban in place for <1 month in April 2020, but 1480 (47.1%) counties had a ban in place for ≥1 month by December 2020. In April 2020, 1479 (47.1%) counties adopted stay-at-home orders for ≥1 month; however, in December, only 221 (7.0%) counties had a stay-at-home order in place. Of 3141 US counties included in our study, 2312 (73.6%) had ever implemented a BPI in 2020 (Supplemental Table S3). The percentage of counties that implemented, discontinued, and restarted a BPI was small for face mask mandates (2.7%) and stay-at-home orders (1.5%) and was 17.2% for gathering bans. County-level incidence of COVID-19 varied by month, overall social vulnerability, and type and duration of BPI in place (Table 2).
Duration of behavioral policy interventions (BPIs) in place for face mask mandates, stay-at-home orders, and gathering bans in US counties (N = 3141), April–December 2020 a
COVID-19 incidence by month according to overall county social vulnerability level and duration of behavioral policy interventions (BPIs) in place in US counties (N = 3141), April–December 2020 a
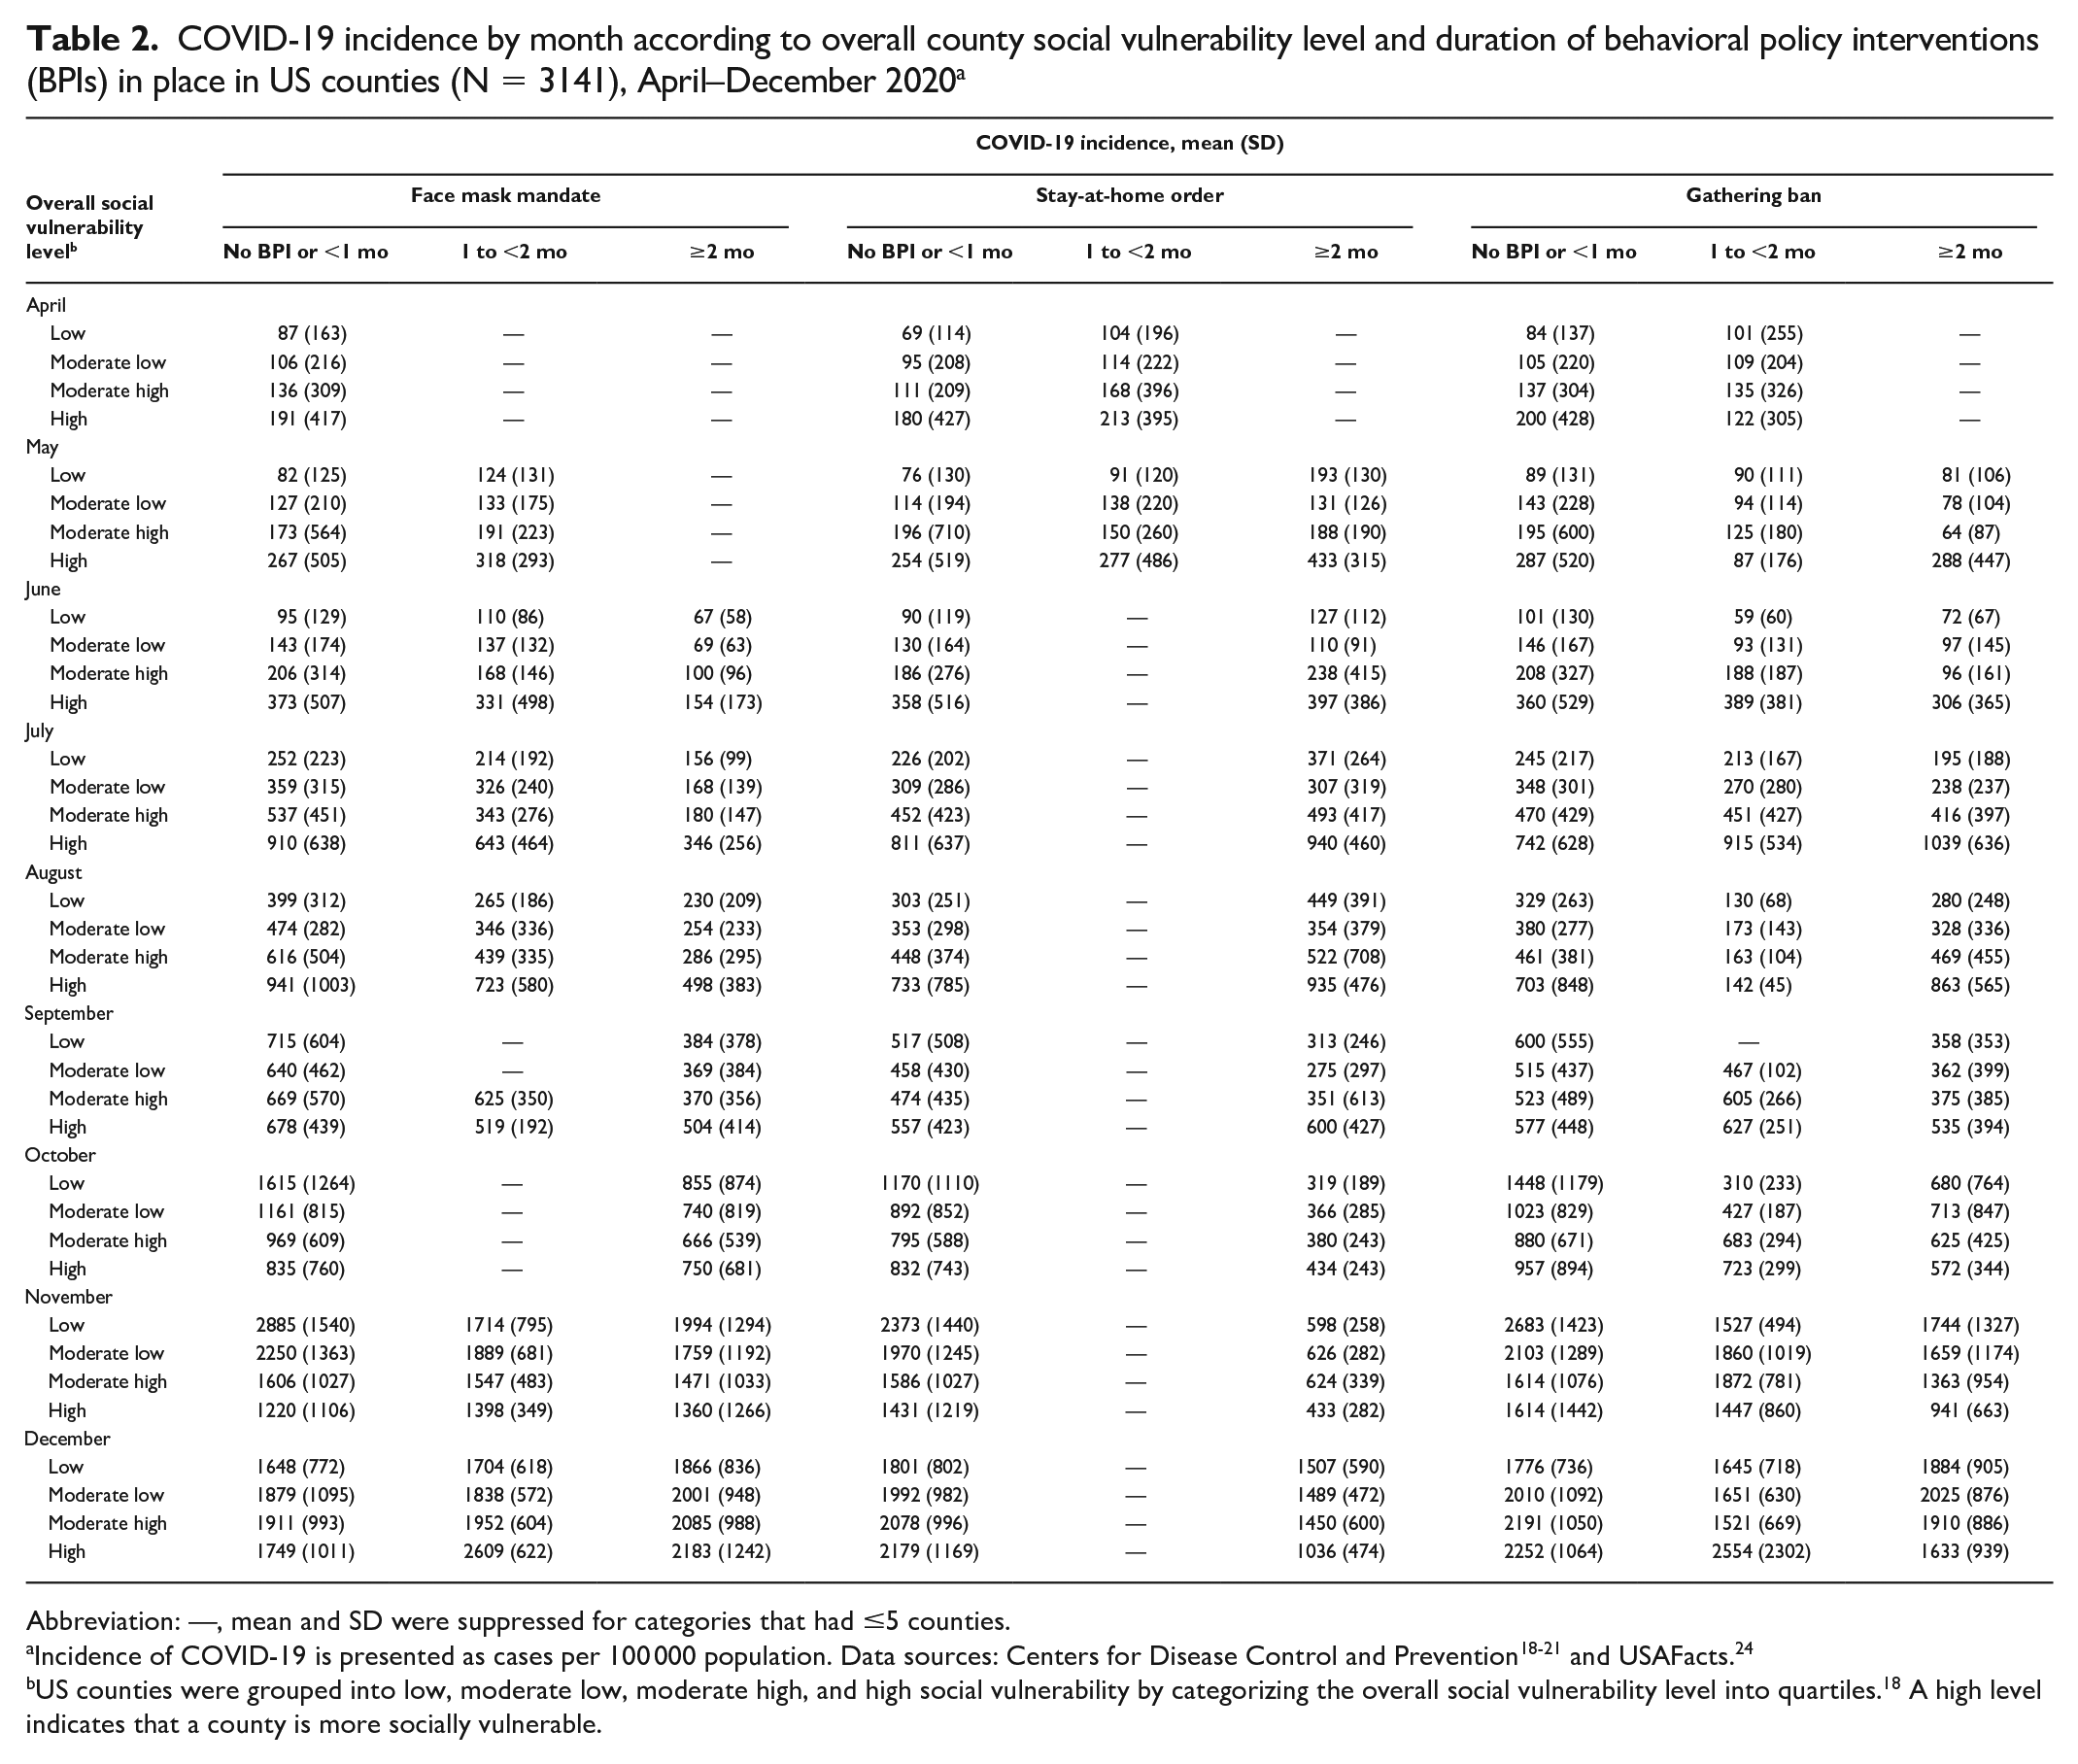
Abbreviation: —, mean and SD were suppressed for categories that had ≤5 counties.
Incidence of COVID-19 is presented as cases per 100 000 population. Data sources: Centers for Disease Control and Prevention18-21 and USAFacts. 24
US counties were grouped into low, moderate low, moderate high, and high social vulnerability by categorizing the overall social vulnerability level into quartiles. 18 A high level indicates that a county is more socially vulnerable.
When we analyzed US counties with no BPI in place, a BPI in place for <1 month, and a BPI in place for 1 to <2 months, we found that the marginal mean incidence of COVID-19 was greater in counties with higher overall SVI than in counties with lower overall SVI (Supplemental Table S4, Figure 1). If face mask mandates and gathering bans were in place for ≥2 months, the marginal mean incidence of COVID-19 per 100 000 population was similar across levels of overall SVI (350-403 cases for face mask mandates and 287-332 cases for gathering bans). However, when we analyzed US counties with stay-at-home orders in place for ≥2 months, the marginal mean incidence of COVID-19 per 100 000 population was greater in counties with overall high SVI (439 cases) than in counties with overall low SVI (315 cases). In general, longer durations of a BPI (ie, ≥2 months) were associated with a lower marginal mean incidence of COVID-19. However, the marginal mean incidence of COVID-19 was greater for stay-at-home orders in place for 1 to <2 months than for no orders or orders in place for <1 month. For face mask mandates, the marginal mean incidence of COVID-19 in counties with low SVI was similar regardless of the duration of BPI implementation.
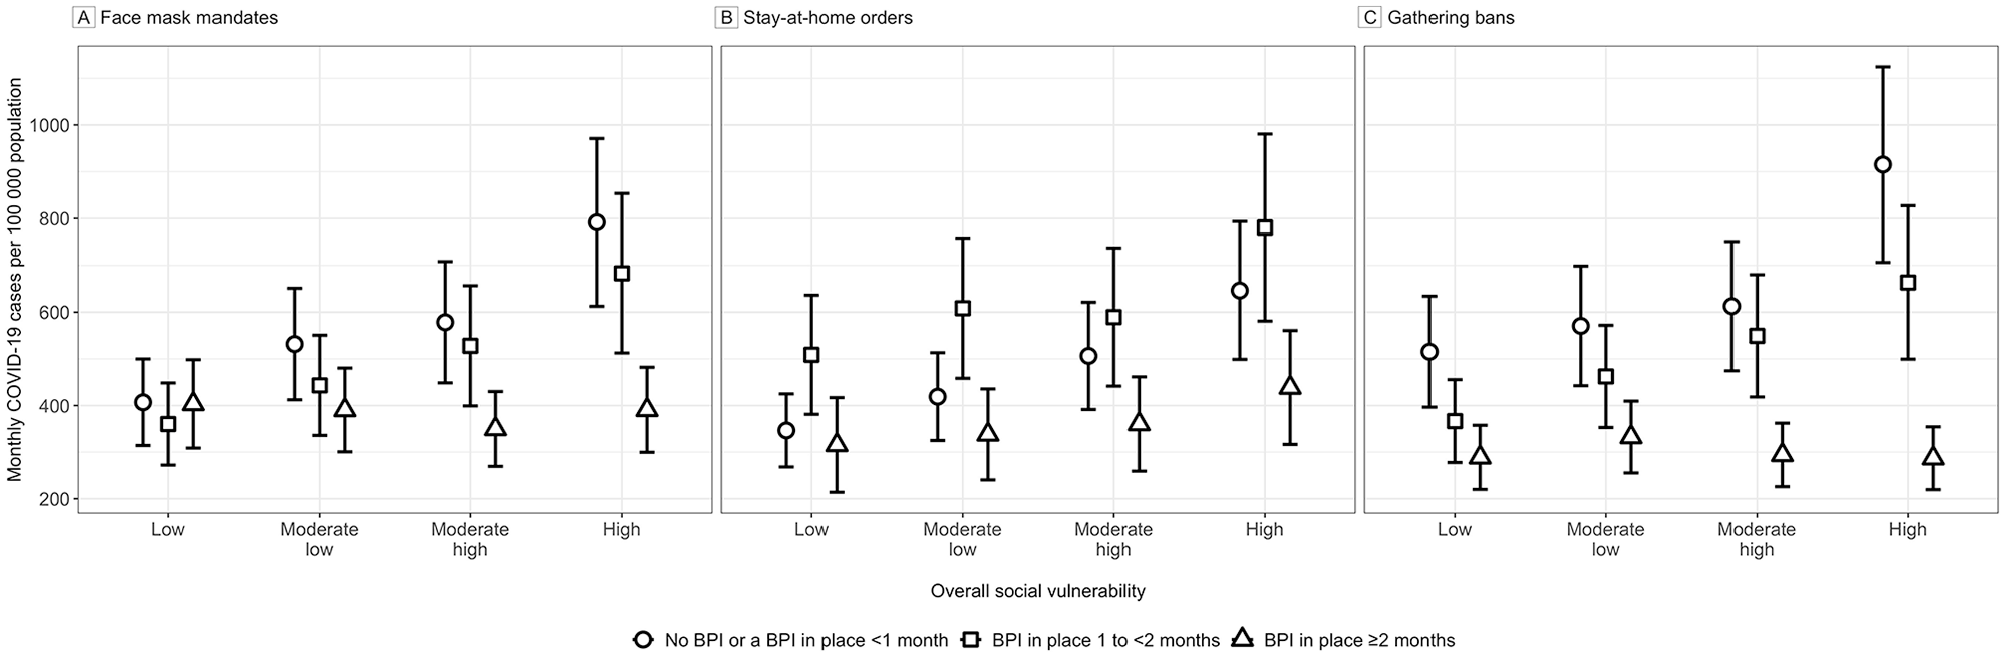
Estimated monthly marginal mean incidence of COVID-19 cases per 100 000 population according to overall county social vulnerability level and duration of behavioral policy interventions (BPIs) in place for face mask mandates (A), stay-at-home orders (B), and gathering bans (C) in US counties (N = 3141), April–December 2020. Vertical bars indicate 95% CIs. Data sources: Centers for Disease Control and Prevention18-21 and USAFacts. 24
When we compared no BPI or a BPI in place for <1 month with BPI in place for ≥2 months for face mask mandates, we observed a larger difference in marginal mean incidence of COVID-19 per 100 000 population in counties with higher levels of overall SVI (−401; 95% CI, −504 to −298 cases) than in counties with lower levels of overall SVI (−4; 95% CI, –45 to 38 cases). For stay-at-home orders, the difference in mean incidence was −208 (95% CI, −300 to −115) cases in counties with high SVI and −31 (95% CI, −107 to 45) cases in counties with low SVI. For gathering bans, the difference in mean incidence was −628 (95% CI, −781 to −476) cases in counties with high SVI and −227 (95% CI, −292 to −161) cases in counties with low SVI (Supplemental Table S3, Figure 2). For BPIs in place for 1 to <2 months, differences in the marginal mean incidence of COVID-19 at higher levels of overall SVI versus lower levels of overall SVI were similar. We observed similar results for marginal mean incidence of COVID-19 and differences in marginal mean incidence of COVID-19 for each SVI theme except for the household composition and disability theme, for which the marginal mean incidence of COVID-19 and difference in marginal mean incidence of COVID-19 were similar across different levels of the SVI theme (Supplemental Figures S1 and S2).
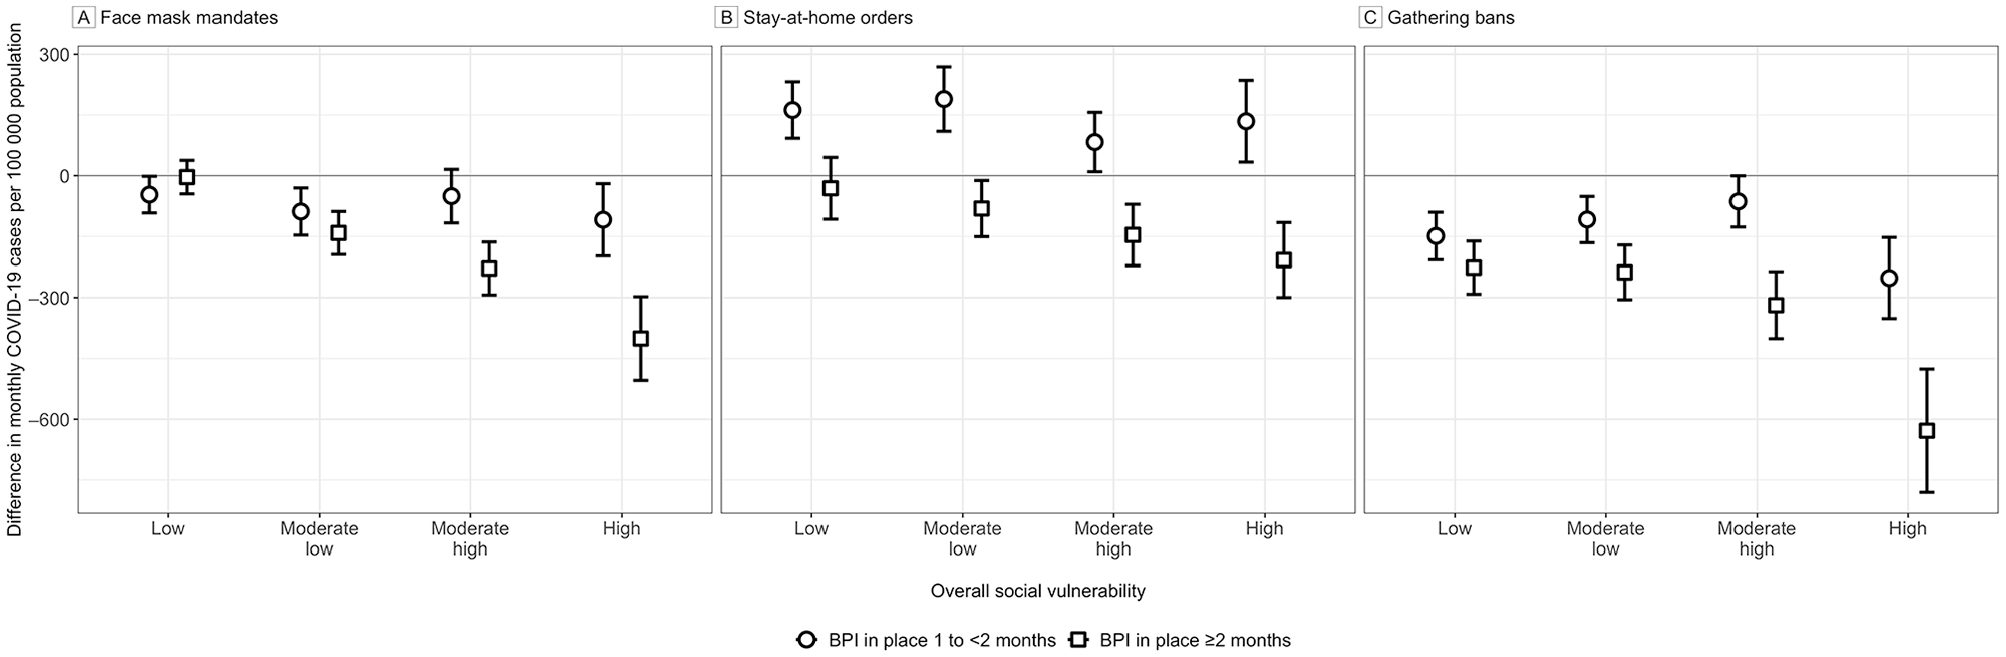
Differences in marginal mean monthly incidence of COVID-19 cases per 100 000 population for behavioral policy interventions (BPIs) in place in US counties (N = 3141) during April–December 2020 for 1 to <2 months and ≥2 months versus no BPI or a BPI in place for <1 month. Results are shown according to low, moderate low, moderate high, and high overall social vulnerability for face mask mandates (A), stay-at-home orders (B), and gathering bans (C). Vertical bars represent 95% CIs; negative values, lower predicted incidence than predicted incidence for no BPI or a BPI in place for <1 month; positive values, greater predicted incidence than predicted incidence for no BPI or a BPI in place for <1 month. Data sources: Centers for Disease Control and Prevention18-21 and USAFacts. 24
We categorized the predicted mean incidence of COVID-19 into quartiles for face mask mandates (204.41-990.89, 990.90-1463.41, 1463.42-2254.00, and 2254.01-13 819.71), stay-at-home orders (216.89-853.22, 853.23-1233.60, 1233.61-1831.21, and 1831.22-13 377.48), and gathering bans (165.51-839.08, 839.09-1292.60, 1292.61-1945.86, and 1945.87-13 377.48). The bivariate geographic distribution between the quartiles of predicted mean incidence of COVID-19 in December 2020 and the levels of overall SVI based on duration of a BPI varied across US counties (Figure 3). For face mask mandates, we found 65.2% fewer counties with high levels of SVI and predicted incidence of COVID-19 when face mask mandates were in place for ≥2 months (171 counties) than when face mask mandates were in place for 0 to <1 month (492 counties). For stay-at-home orders, we found 45.0% fewer counties with high levels of SVI and predicted incidence of COVID-19 when stay-at-home orders were in place for ≥2 months (210 counties) than when stay-at-home orders were in place for 0 to <1 month (382 counties). And we found 96.9% fewer counties with high levels of SVI and predicted incidence of COVID-19 when gathering bans were in place for ≥2 months (18 counties) than when gathering bans were in place for 0 to <1 month (577 counties). Most counties with high levels of SVI and high predicted incidence of COVID-19, regardless of the duration that a BPI was in place, were located in the southern and southwestern states.
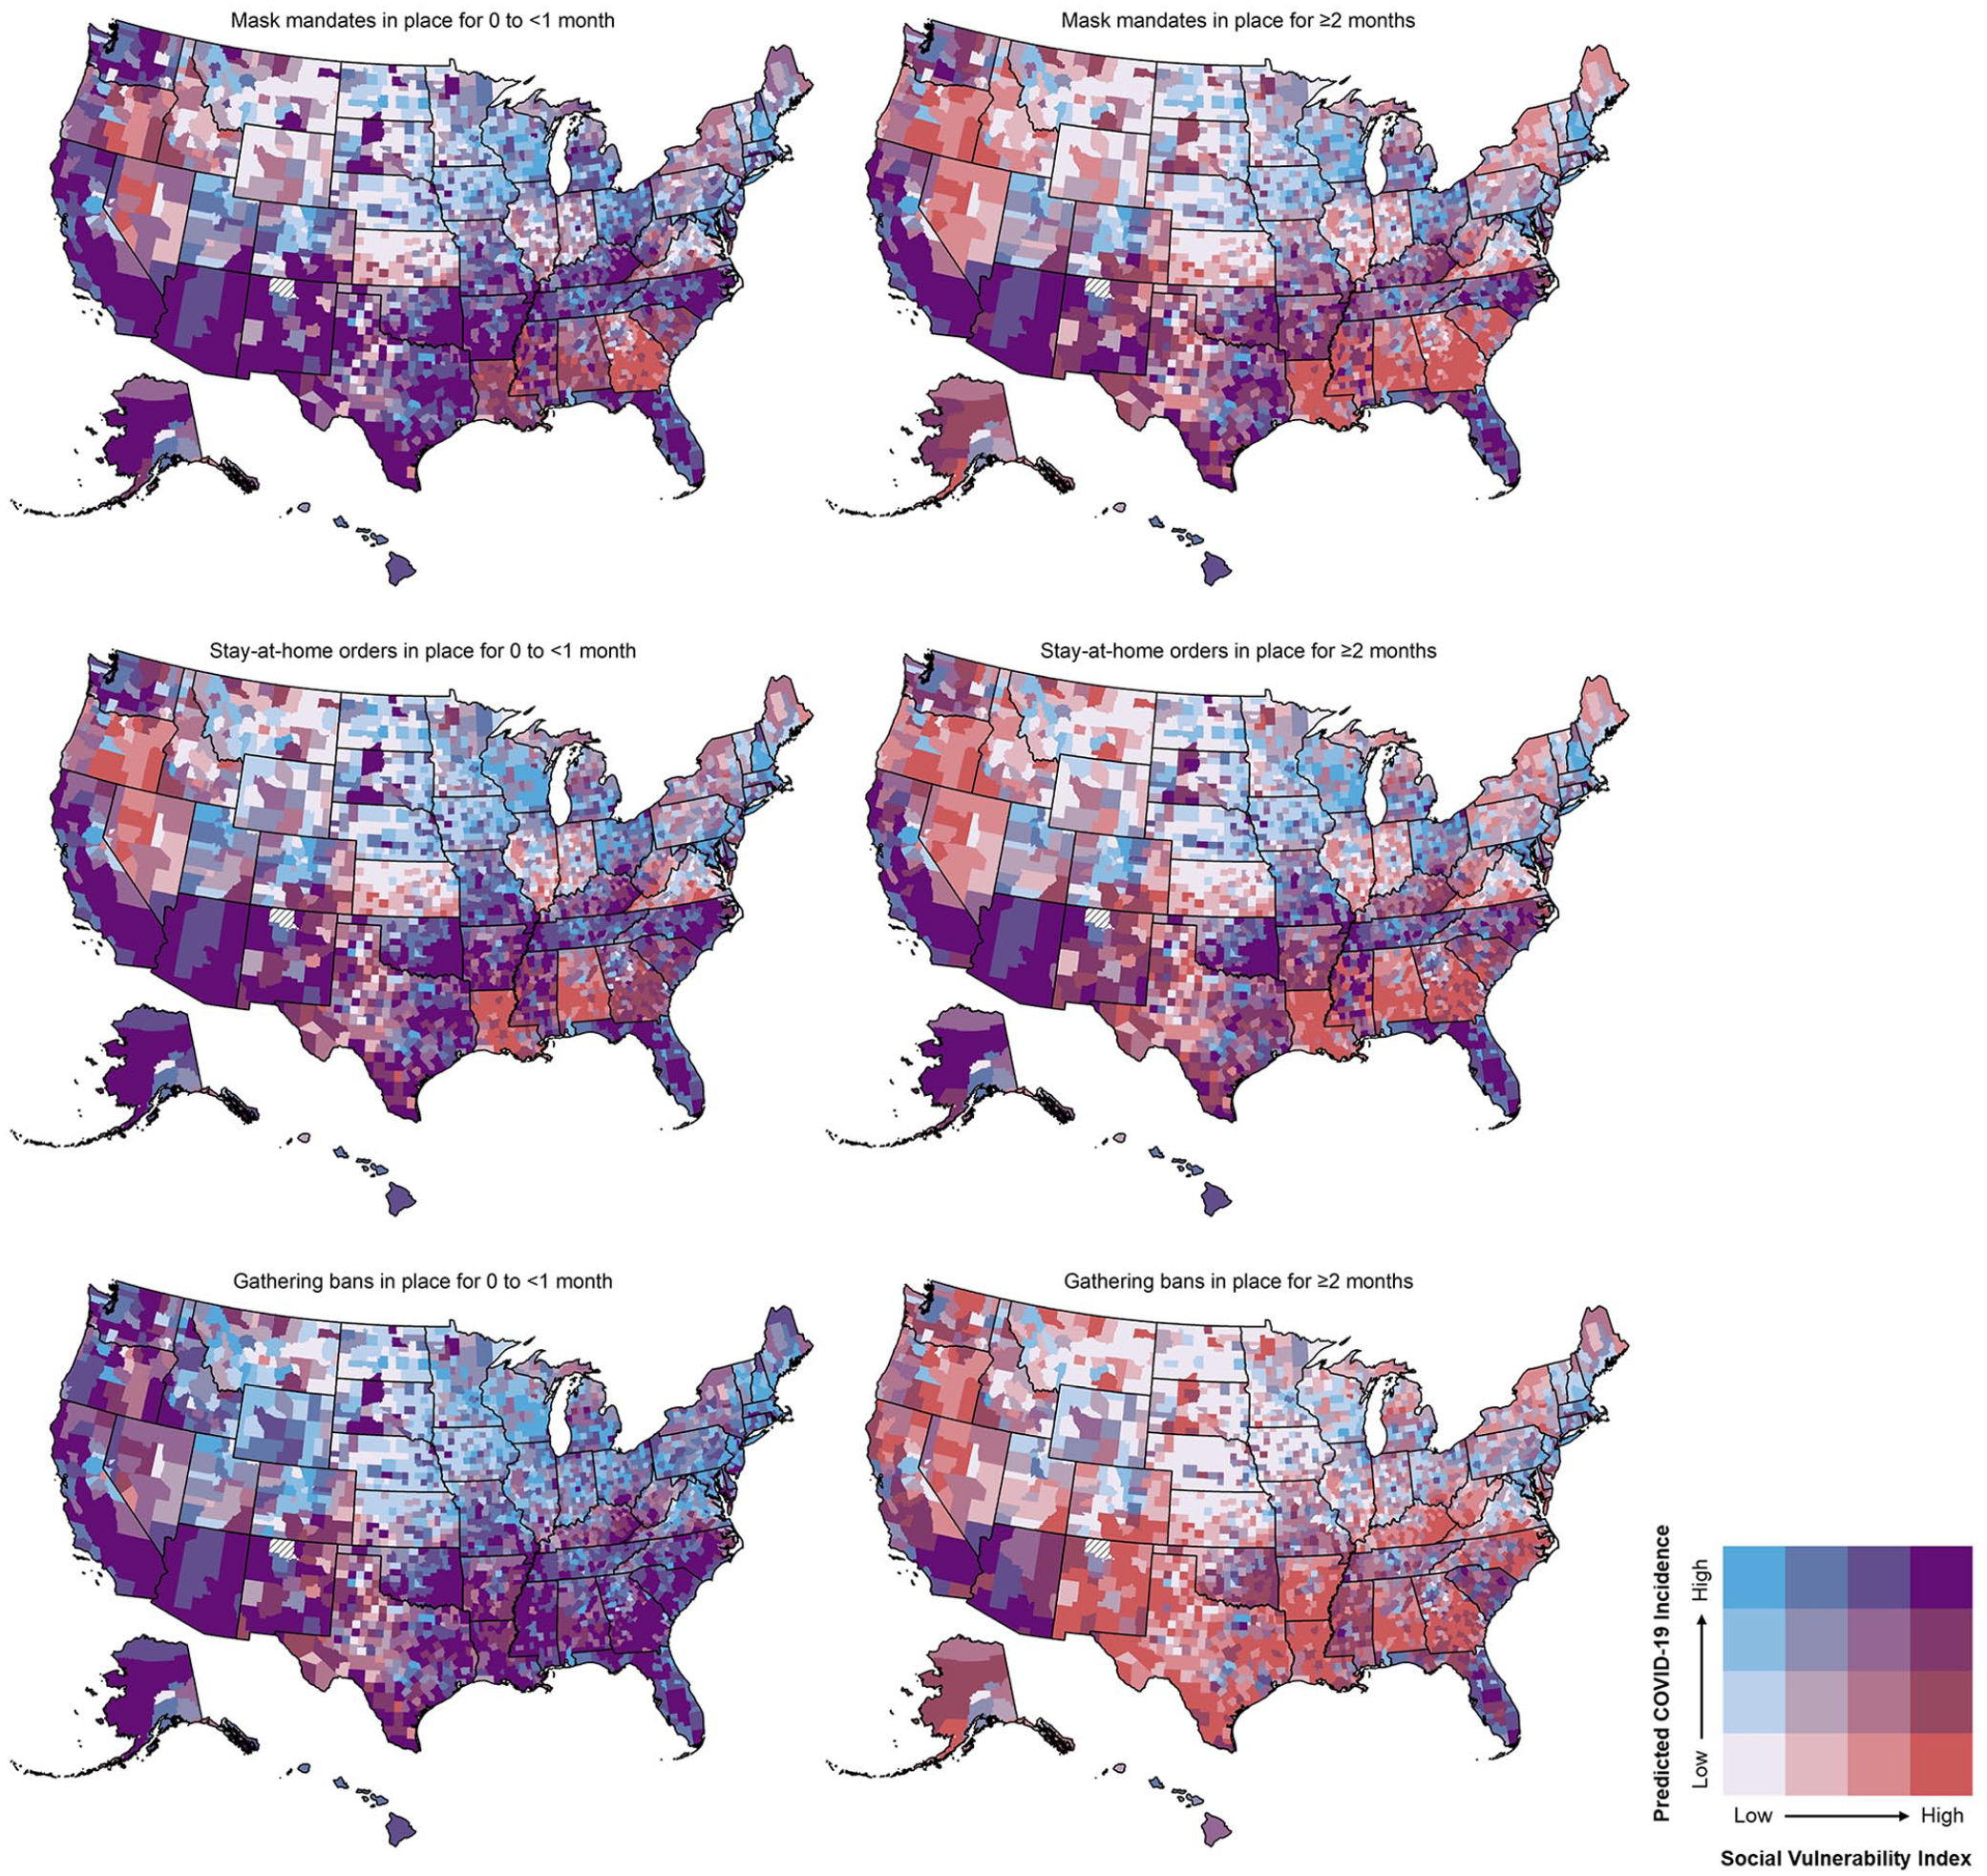
Bivariate geographic distribution of predicted mean incidence of COVID-19 cases per 100 000 population in December 2020 and the 2018 Centers for Disease Control and Prevention/Agency for Toxic Substances and Disease Registry Social Vulnerability Index 18 by duration of face mask mandates, stay-at-home orders, and gathering bans in 3141 US counties. The increasing shades of red (light gray in the printed version) indicate counties with higher social vulnerability, the increasing shades of blue (medium gray in the printed version) indicate counties with higher predicted incidence of COVID-19, and purple shade (dark gray in the printed version) indicates counties with both high social vulnerability and predicted incidence of COVID-19. Counties with hashed symbolization indicate unavailable data. Data sources: Centers for Disease Control and Prevention18-21 and USAFacts. 24
Discussion
Consistent with previous studies, we found an association between counties with high levels of social vulnerability and higher COVID-19 incidence14,16 and an association between the implementation of BPIs, especially for longer durations, and lower COVID-19 incidence.2,4-10 In addition, we observed a larger estimated difference in COVID-19 incidence in counties with high levels of social vulnerability than in counties with low levels of social vulnerability when a BPI was implemented in a county for ≥2 months.
Geographically, we found substantial variations in the distribution of overall social vulnerability and predicted incidence of COVID-19 by duration of a BPI. In general, the predicted incidence of COVID-19 was lower in counties that implemented a BPI for longer durations (eg, ≥2 months) across levels of overall SVI compared with shorter BPI durations. Notably, some counties with high social vulnerability in the southwestern and southern regions had high levels of predicted incidence of COVID-19 even when face mask mandates, stay-at-home orders, or gathering bans were in place for ≥2 months. This finding may reflect that other unique structural factors may not be accounted for or cannot be mitigated by BPIs, requiring additional resources to reduce COVID-19 incidence in these areas. Additional data on historical and structural vulnerabilities in these areas may be needed to inform the implementation of BPIs.
Our findings suggest how BPIs can be implemented during the early stages of an infectious disease pandemic to reduce community transmission and incidence of the disease and to perhaps have more equitable health outcomes. In a pandemic such as COVID-19, mitigation measures to reduce community transmission cannot be implemented in isolation because individuals cannot completely avoid interactions with each other or avoid commuting across communities. Thus, implementing and maintaining BPIs for a long period (eg, ≥2 months) among all counties may lower community transmission regardless of the social vulnerability of a community. Similarly, implementing BPIs such as face mask mandates or gathering bans for a long period may allow the most socially vulnerable counties to achieve levels of COVID-19 incidence that are comparable to levels shown in less socially vulnerable counties, leading to more equitable health outcomes.
In addition to the social vulnerability level of a community, the effect of a BPI adopted in an area on COVID-19 incidence may also vary with the type of BPI. Consistent with other research, among the 3 BPIs included in our study, gathering bans were associated with the largest reduction in COVID-19 incidence, and stay-at-home orders were associated with the smallest reduction in COVID-19 incidence.28-30 In addition, we found that only the duration of ≥2 months of stay-at-home orders in place (vs shorter durations) was associated with reduced incidence of COVID-19. Implementing face mask mandates and gathering bans in a community may likely impact individual behaviors in a community regardless of demographic and socioeconomic factors. However, stay-at-home orders, although they do reduce person-to-person contacts, may need to be implemented for a longer duration and complemented with other BPIs or resources to achieve comparable incidence levels, because stay-at-home orders may not equally apply to all individuals in a population. For example, essential workers, who may have less education and lower incomes, who often live in communities with high social vulnerability, and who often belong to racial and ethnic minority groups, are less likely than the general population to have access to opportunities to work from home.31,32 Compared with the general population, essential workers often have fewer opportunities for remote work, less health insurance coverage, and fewer comprehensive paid-leave options to work from home or stay at home when exposed to or sick with COVID-19; these systemic issues need to be addressed for stay-at-home orders to be more effective. Stay-at-home orders may not be as effective as other BPIs without addressing these structural economic issues and the working conditions of people in essential jobs. When examining the effect of stay-at-home orders on predicted incidence of COVID-19 by the 4 SVI themes, we found a positive association by the themes of socioeconomic status, racial and ethnic minority status and language, and housing type and transportation, which aligns with the sociodemographic characteristics of essential workers and their living conditions.32-34
The findings for stay-at-home orders do not imply that stay-at-home orders do not have an immediate effect on limiting the spread of COVID-19. Stay-at-home orders may have an immediate effect on other types of outcomes, such as the growth rate of COVID-19 incidence or population mobility (eg, commuting to work, traveling for grocery shopping).35,36 These findings suggest that, although the use of BPIs may help reduce the spread of COVID-19 in communities with varying levels of social vulnerability, supplementary public health resources might be needed to assist communities with high social vulnerability.
Limitations
Our study had several limitations. First, the 2018 SVI database used in our study may not reflect community-level social vulnerability in 2020, when the COVID-19 pandemic began. However, this database was the most recent SVI database available and has been used by other studies to investigate the association between SVI and COVID-19.14-16,37 Second, county-level social vulnerability may have changed throughout the duration of our study. Disruptions in the US workforce and lack of employment opportunities may have widened the gap between the most and least vulnerable counties. However, SVI measures are percentile ranks, which capture the relative rankings among US counties in terms of social vulnerability and may not change substantially over time. Third, we were unable to account for individual preventive behaviors (eg, face mask wearing, social distancing) in a county. Despite continuing efforts to conduct COVID-19 behavioral surveys, such surveys are often cross-sectional and conducted at the local level among a small number of people.38-40 Fourth, other BPIs (eg, business closures, school closures) were not accounted for in our study. However, some types of BPIs perform similar functions to the BPIs included in our study. For example, both business closures and gathering bans reduce the sizes of social gatherings in public spaces. Finally, the daily case report from USAFacts does not account for any variations in testing capacity among counties. Therefore, the number of COVID-19 cases reported from USAFacts may reflect both the community transmission and the testing constraint in the community.
Conclusions
Our findings suggest that different types of BPIs and a longer duration of BPIs in place were associated with lower incidence of COVID-19, especially in counties with high social vulnerability that were disproportionately affected by the COVID-19 pandemic before effective vaccines or treatments were available. Longer durations of gathering bans and face mask mandates might assist counties with a high level of social vulnerability to reach incidence levels similar to counties with a low level of social vulnerability. In comparison, for stay-at-home orders, the incidence of COVID-19 was positively associated with the level of social vulnerability even when an order was in place for ≥2 months. Gathering bans and face mask mandates appear to be more effective than stay-at-home orders in reducing the spread of COVID-19 in communities with high levels of social vulnerability. For the emergence of new COVID-19 variants and other similar infectious disease outbreaks, it may be important to ensure that all communities, particularly communities that are most socially vulnerable, have the resources to comply with such BPIs.
Supplemental Material
sj-docx-1-phr-10.1177_00333549221125202 – Supplemental material for Duration of Behavioral Policy Interventions and Incidence of COVID-19 by Social Vulnerability of US Counties, April–December 2020
Supplemental material, sj-docx-1-phr-10.1177_00333549221125202 for Duration of Behavioral Policy Interventions and Incidence of COVID-19 by Social Vulnerability of US Counties, April–December 2020 by Szu-Yu Zoe Kao, J. Danielle Sharpe, Rashon I. Lane, Rashid Njai, Russell F. McCord, Aderonke S. Ajiboye, Chandresh N. Ladva, Linda Vo and Donatus U. Ekwueme in Public Health Reports
Footnotes
Disclaimer
The findings and conclusions in this article are those of the authors and do not necessarily represent the official position of the Centers for Disease Control and Prevention.
Declaration of Conflicting Interests
The authors declared no potential conflicts of interest with respect to the research, authorship, and/or publication of this article.
Funding
The authors received no financial support for the research, authorship, and/or publication of this article.
Supplemental Material
Supplemental material for this article is available online.
References
Supplementary Material
Please find the following supplemental material available below.
For Open Access articles published under a Creative Commons License, all supplemental material carries the same license as the article it is associated with.
For non-Open Access articles published, all supplemental material carries a non-exclusive license, and permission requests for re-use of supplemental material or any part of supplemental material shall be sent directly to the copyright owner as specified in the copyright notice associated with the article.