
Abstract
Objective:
This analysis summarizes observational epidemiologic data and transmission dynamics of SARS-CoV-2 among people aged <18 years to better characterize the pediatric COVID-19 pandemic.
Methods:
We conducted a retrospective study of public health surveillance data among children in Denver, Colorado, who were reported to have COVID-19 from March 1, 2020, through September 30, 2021. We used descriptive statistics and bivariate rate ratios (RRs) to describe demographic and clinical characteristics, transmission dynamics, case trends, and ecological associations.
Results:
A total of 9815 children and adolescents who had COVID-19 were reported during the study period. Adolescents aged 14-17 years had the highest incidence rate (IR) per 1000 people (IR = 107.5; 3021 of 28 108). Hispanic/Latino children had a 1.6 times higher rate of infection than non-Hispanic White children (RR = 1.57; 95% CI, 1.50-1.65; P < .001). Few hospitalizations (n = 138, 1.4%) and deaths (n = 3, 0%) occurred. Most children were symptomatic (4487 of 5499, 81.6%). Within household clusters, a large proportion of pediatric cases (n = 6136) were a secondary case (n = 3959, 64.5%), followed by index case (n = 1170, 19.1%) and co–index case (n = 1007, 16.4%). Non-Hispanic White children had an increased risk of being an index or co–index case (RR = 1.14; 95% CI, 1.06-1.23; P < .001), while Hispanic/Latino children had an increased risk of being a secondary case (RR = 1.07; 95% CI, 1.03-1.11; P < .001). From 2020 to 2021, the association between pediatric case rates and neighborhoods with higher poverty and households with ≥3 people decreased.
Conclusions:
Older children and those identifying as Hispanic/Latino had a disproportionate incidence of disease. A sizable proportion of children were considered index cases or co–index cases. Pediatric prevention strategies, especially vaccinations, are vital for pandemic control.
As of November 11, 2021, a total of 6 625 857 pediatric cases of COVID-19 had been reported in the United States, representing 16.8% of COVID-19 cases nationally. 1 All children are vulnerable to severe SARS-CoV-2 infection. 2 Most infected children are asymptomatic, 3 and severe disease is rare, with 0.1%-1.9% of all pediatric cases resulting in hospitalization and 0%-0.2% of pediatric cases resulting in death. 1 The COVID-19 pandemic is marked by a rapidly evolving situation, especially with the emergence of increasingly more transmissible and immune-evasive variants of concern (VOCs), such as B.1.617.2 (Delta).4,5 Racial and ethnic disparities in the impact of COVID-19 persist among adults and children, with historically marginalized and socioeconomically disadvantaged populations having an elevated risk of disease, hospitalization, and death.6-9 COVID-19 has also disproportionately affected communities traditionally associated with certain social determinants of health and neighborhood attributes, such as lower-income and higher-density households.10-14 Although the role of children in virus transmission varies, data suggest that children have a similar risk of COVID-19 infection as adults, are commonly asymptomatic, and are fully capable of transmission.15-18 While adults often have a community or nosocomial exposure, most children have a documented household contact, even with a return to in-person learning.19,20 Schools with effective prevention strategies have lower or similar levels of community transmission compared with schools without these prevention strategies, especially with low numbers of unvaccinated people in schools.21,22 We evaluated the incidence and epidemiology of COVID-19 among children and adolescents to better inform the public health and health systems’ response in an increasingly complex and nuanced environment.
Methods
We conducted a retrospective analysis among children and adolescents aged <18 years living in noncongregate settings who had reported laboratory-confirmed COVID-19 in Denver, Colorado, with an earliest known date of infection (EKDI) of March 1, 2020, through September 30, 2021. We defined EKDI as the earliest date of the following: date of self-reported onset of symptoms, laboratory collection date, test date, or date reported. Cases were reported to the Colorado Department of Public Health and Environment’s (CDPHE’s) Colorado Electronic Disease Reporting System (CEDRS) 23 and then assigned for case/contact investigation. The Public Health Institute at Denver Health (PHIDH) used standardized forms for telephone interviews with reported patients or proxies (eg, caregivers/guardians of children or adults). PHIDH conducted medical record reviews when people were hospitalized, had died, or could not be contacted. Data on hospitalization and death were based on information available at the time of reporting and cross-validated by regional electronic health records and vital statistics. Data were securely stored in a REDCap (Vanderbilt University) database and supplemented with data from CDPHE.
Household Transmission
We used ArcGIS Pro (Esri) to geocode and standardize all cases with a valid address. We excluded cases without a valid address or without a valid address that could be geocoded (n = 1242). We used all cases, including adults, to quantify household transmission. We considered cases with the same primary address and last name or telephone number to reside in the same household. We defined a suspected household cluster, considered evidence of household transmission, as all household cases with an EKDI ±26 days the EKDI of another household case. The ±26-day household cluster transmission window accounted for a combined 3-day incubation period and 10-day communicable period for both an index and secondary case.24,25 We used the EKDI to describe the directionality of transmission within a household cluster. We considered index cases co-occurring on the same day to be co–index cases; we considered subsequent cases to be secondary cases and the result of household transmission. We restricted household transmission dynamics to household clusters with ≥2 cases with ≥1 pediatric case.
Community-Level Indicators
We aggregated US Census tract estimates from the American Community Survey 26 for the numbers of households living at ≤150% of the federal poverty level and households with ≥3 people to the neighborhood level to assess the association with pediatric case rates.
Analysis
We used descriptive statistics to summarize demographic and clinical characteristics. We used population estimates from the Colorado Department of Local Affairs 27 to calculate incidence rates (IRs). We defined reinfections as a second case of COVID-19 in an individual reported ≥90 days after the preceding infection 28 and postvaccination infections as laboratory-confirmed COVID-19 occurring >14 days after the second vaccine dose (2-dose series) or the first dose (single-dose vaccines). 29
We detailed case characteristics via descriptive statistics from January 1 through September 30, 2021, overall and by 3-month windows. Each window represented a different pandemic phase, with variations in the most predominant VOC as well as vaccine rollout: January 1–March 31, 2021 (nonvariants/variants under investigation; early descending age-phased vaccination availability among people aged ≥16 years); April 1–June 30, 2021 (Alpha, B.1.1.7; population-level vaccination availability and expansion to adolescents aged 12-15 years); and July 1–September 30, 2021 (Delta, B.1.617.2; vaccine availability to people aged ≥12 years).30,31 We used the Wald χ2 test to determine whether the distribution of reported cases during the 3 windows differed significantly by case characteristics. Epidemiologic case curves illustrated weekly trends and completed pediatric vaccines. We also analyzed the number of cases in household clusters and the estimated dynamics of transmission.
We assessed the bivariate association between quartiles of neighborhood census tract estimates and pediatric case rates using rate ratios (RRs) and 95% CIs. The first quartile of each indicator reflected the lowest level of the indicator (lowest percentage of poverty below the federal poverty level or least percentage of households with ≥3 people) and was the reference category. We illustrated the relationship between pediatric case rates and neighborhood census tract estimates by using maps created in ArcGIS Pro version 2.9.2.
We included reinfections in the calculations for 2021, epidemiologic curves, household clusters, and neighborhood estimates. We conducted all statistical analyses using Stata version 12.1 (StataCorp LLC). The Colorado Multiple Institutional Review Board approved this study as exempt because it was considered public health surveillance.
Results
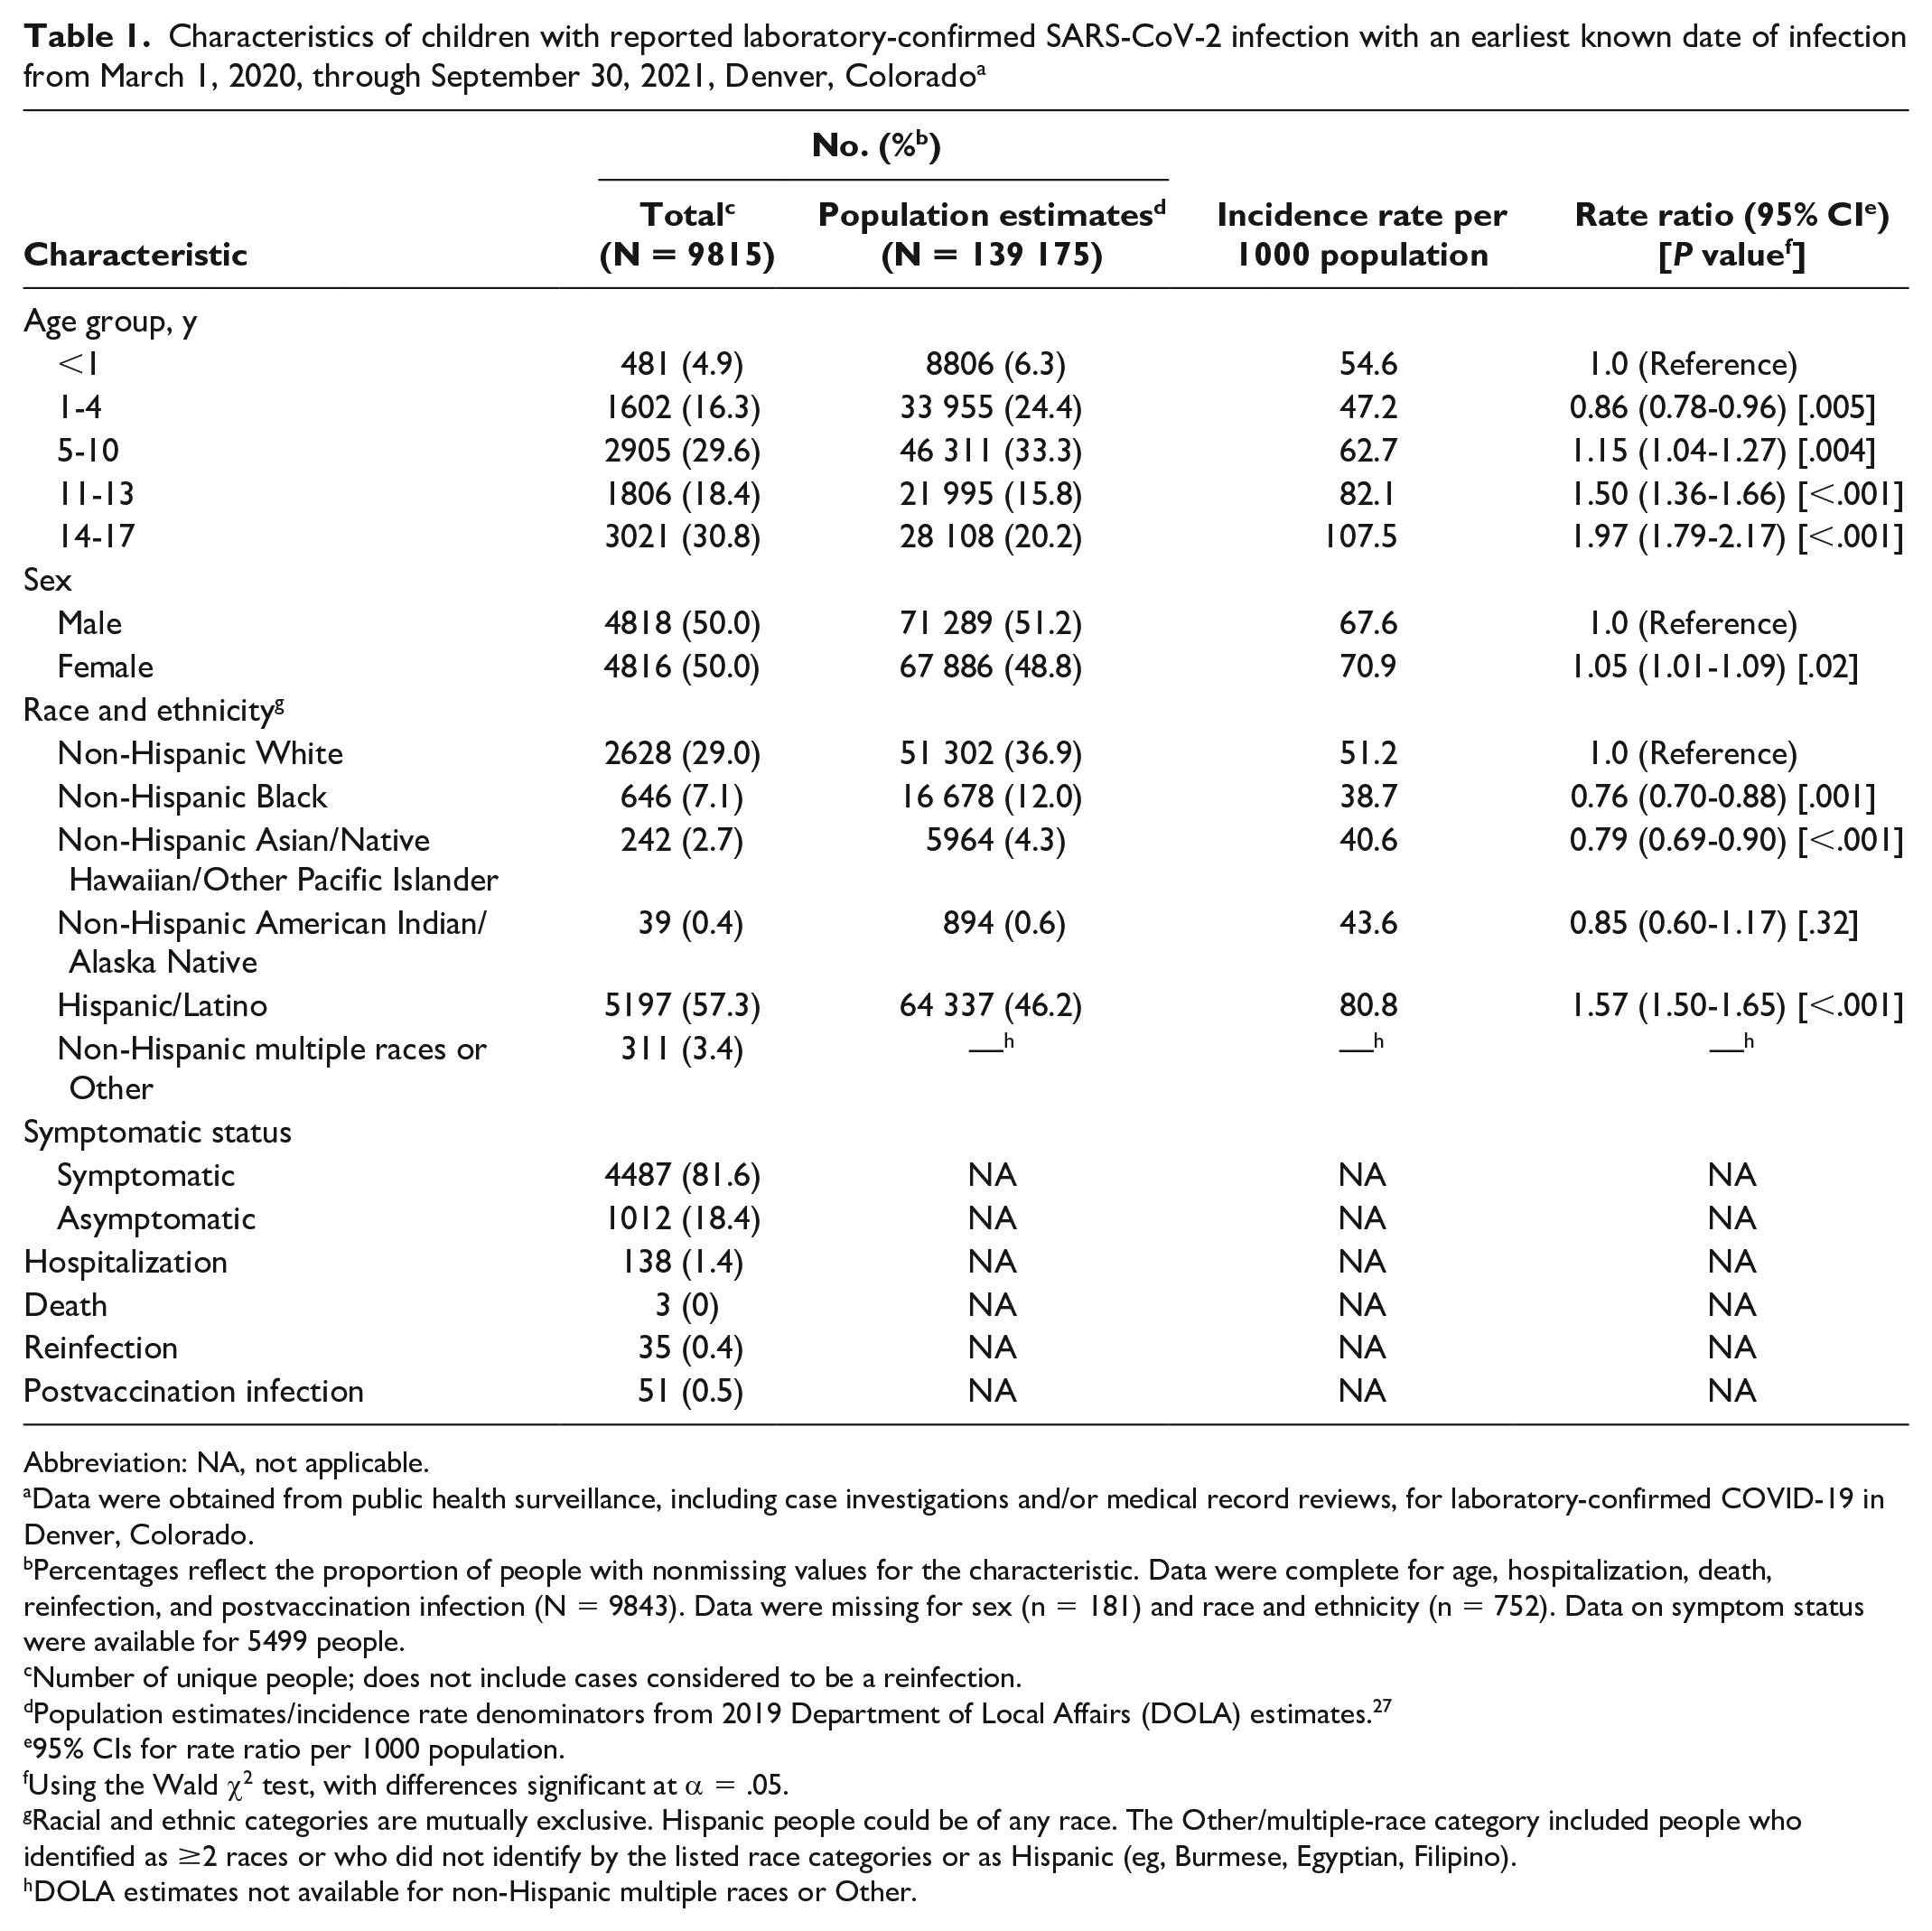
A total of 9815 unique children had an EKDI of SARS-CoV-2 from March 1, 2020, through September 30, 2021, representing 13.2% of 74 237 unique cases in Denver during that period. Adolescents aged 14-17 years had nearly twice the rate of infection (RR = 1.97; 95% CI, 1.79-2.17; P < .001) and children and adolescents aged 11-13 years had 1.5 times the rate of infection (RR = 1.50; 95% CI, 1.36-1.66; P < .001) per 1000 population compared with children aged <1 year (Table 1). Compared with population estimates, the proportion of adolescent patients aged 14-17 years (n = 3021, 30.8%) and 11-13 years (n = 1806, 18.4%) was higher than expected. Compared with non-Hispanic White children, Hispanic/Latino children had 1.6 times the rate of infection per 1000 population (RR = 1.57; 95% CI, 1.50-1.65; P < .001), while non-Hispanic Black (RR = 0.76; 95% CI, 0.70-0.88; P < .001) and non-Hispanic Asian/Native Hawaiian/Other Pacific Islander (RR = 0.79; 95% CI, 0.69-0.90; P < .001) children had a lower rate of infection.
Characteristics of children with reported laboratory-confirmed SARS-CoV-2 infection with an earliest known date of infection from March 1, 2020, through September 30, 2021, Denver, Colorado a
Abbreviation: NA, not applicable.
Data were obtained from public health surveillance, including case investigations and/or medical record reviews, for laboratory-confirmed COVID-19 in Denver, Colorado.
Percentages reflect the proportion of people with nonmissing values for the characteristic. Data were complete for age, hospitalization, death, reinfection, and postvaccination infection (N = 9843). Data were missing for sex (n = 181) and race and ethnicity (n = 752). Data on symptom status were available for 5499 people.
Number of unique people; does not include cases considered to be a reinfection.
Population estimates/incidence rate denominators from 2019 Department of Local Affairs (DOLA) estimates. 27
95% CIs for rate ratio per 1000 population.
Using the Wald χ2 test, with differences significant at α = .05.
Racial and ethnic categories are mutually exclusive. Hispanic people could be of any race. The Other/multiple-race category included people who identified as ≥2 races or who did not identify by the listed race categories or as Hispanic (eg, Burmese, Egyptian, Filipino).
DOLA estimates not available for non-Hispanic multiple races or Other.
Clinical Presentation of Children With SARS-CoV-2 Infection
Of 5499 (56.0%) children for whom symptom status was available, 4487 (81.6%) were symptomatic. The most reported symptoms were cough (1255 of 2802, 44.8%), fever (1274 of 2864, 44.5%), congestion (325 of 751, 43.3%), runny nose (1158 of 2735, 42.3%), headache (1079 of 2643, 40.8%), fatigue (1030 of 2644, 39.0%), loss of appetite (178 of 470, 37.9%), and sore throat (984 of 2645, 37.2%). Hospitalizations (n = 138, 1.4%), death (n = 3, 0%), reinfections (n = 35, 0.4%), and postvaccination cases (n = 51, 0.5%) were rare. Of 35 cases of reinfection, 2 (5.7%) were considered postvaccination infections and 1 was hospitalized.
Pediatric Cases Over Time
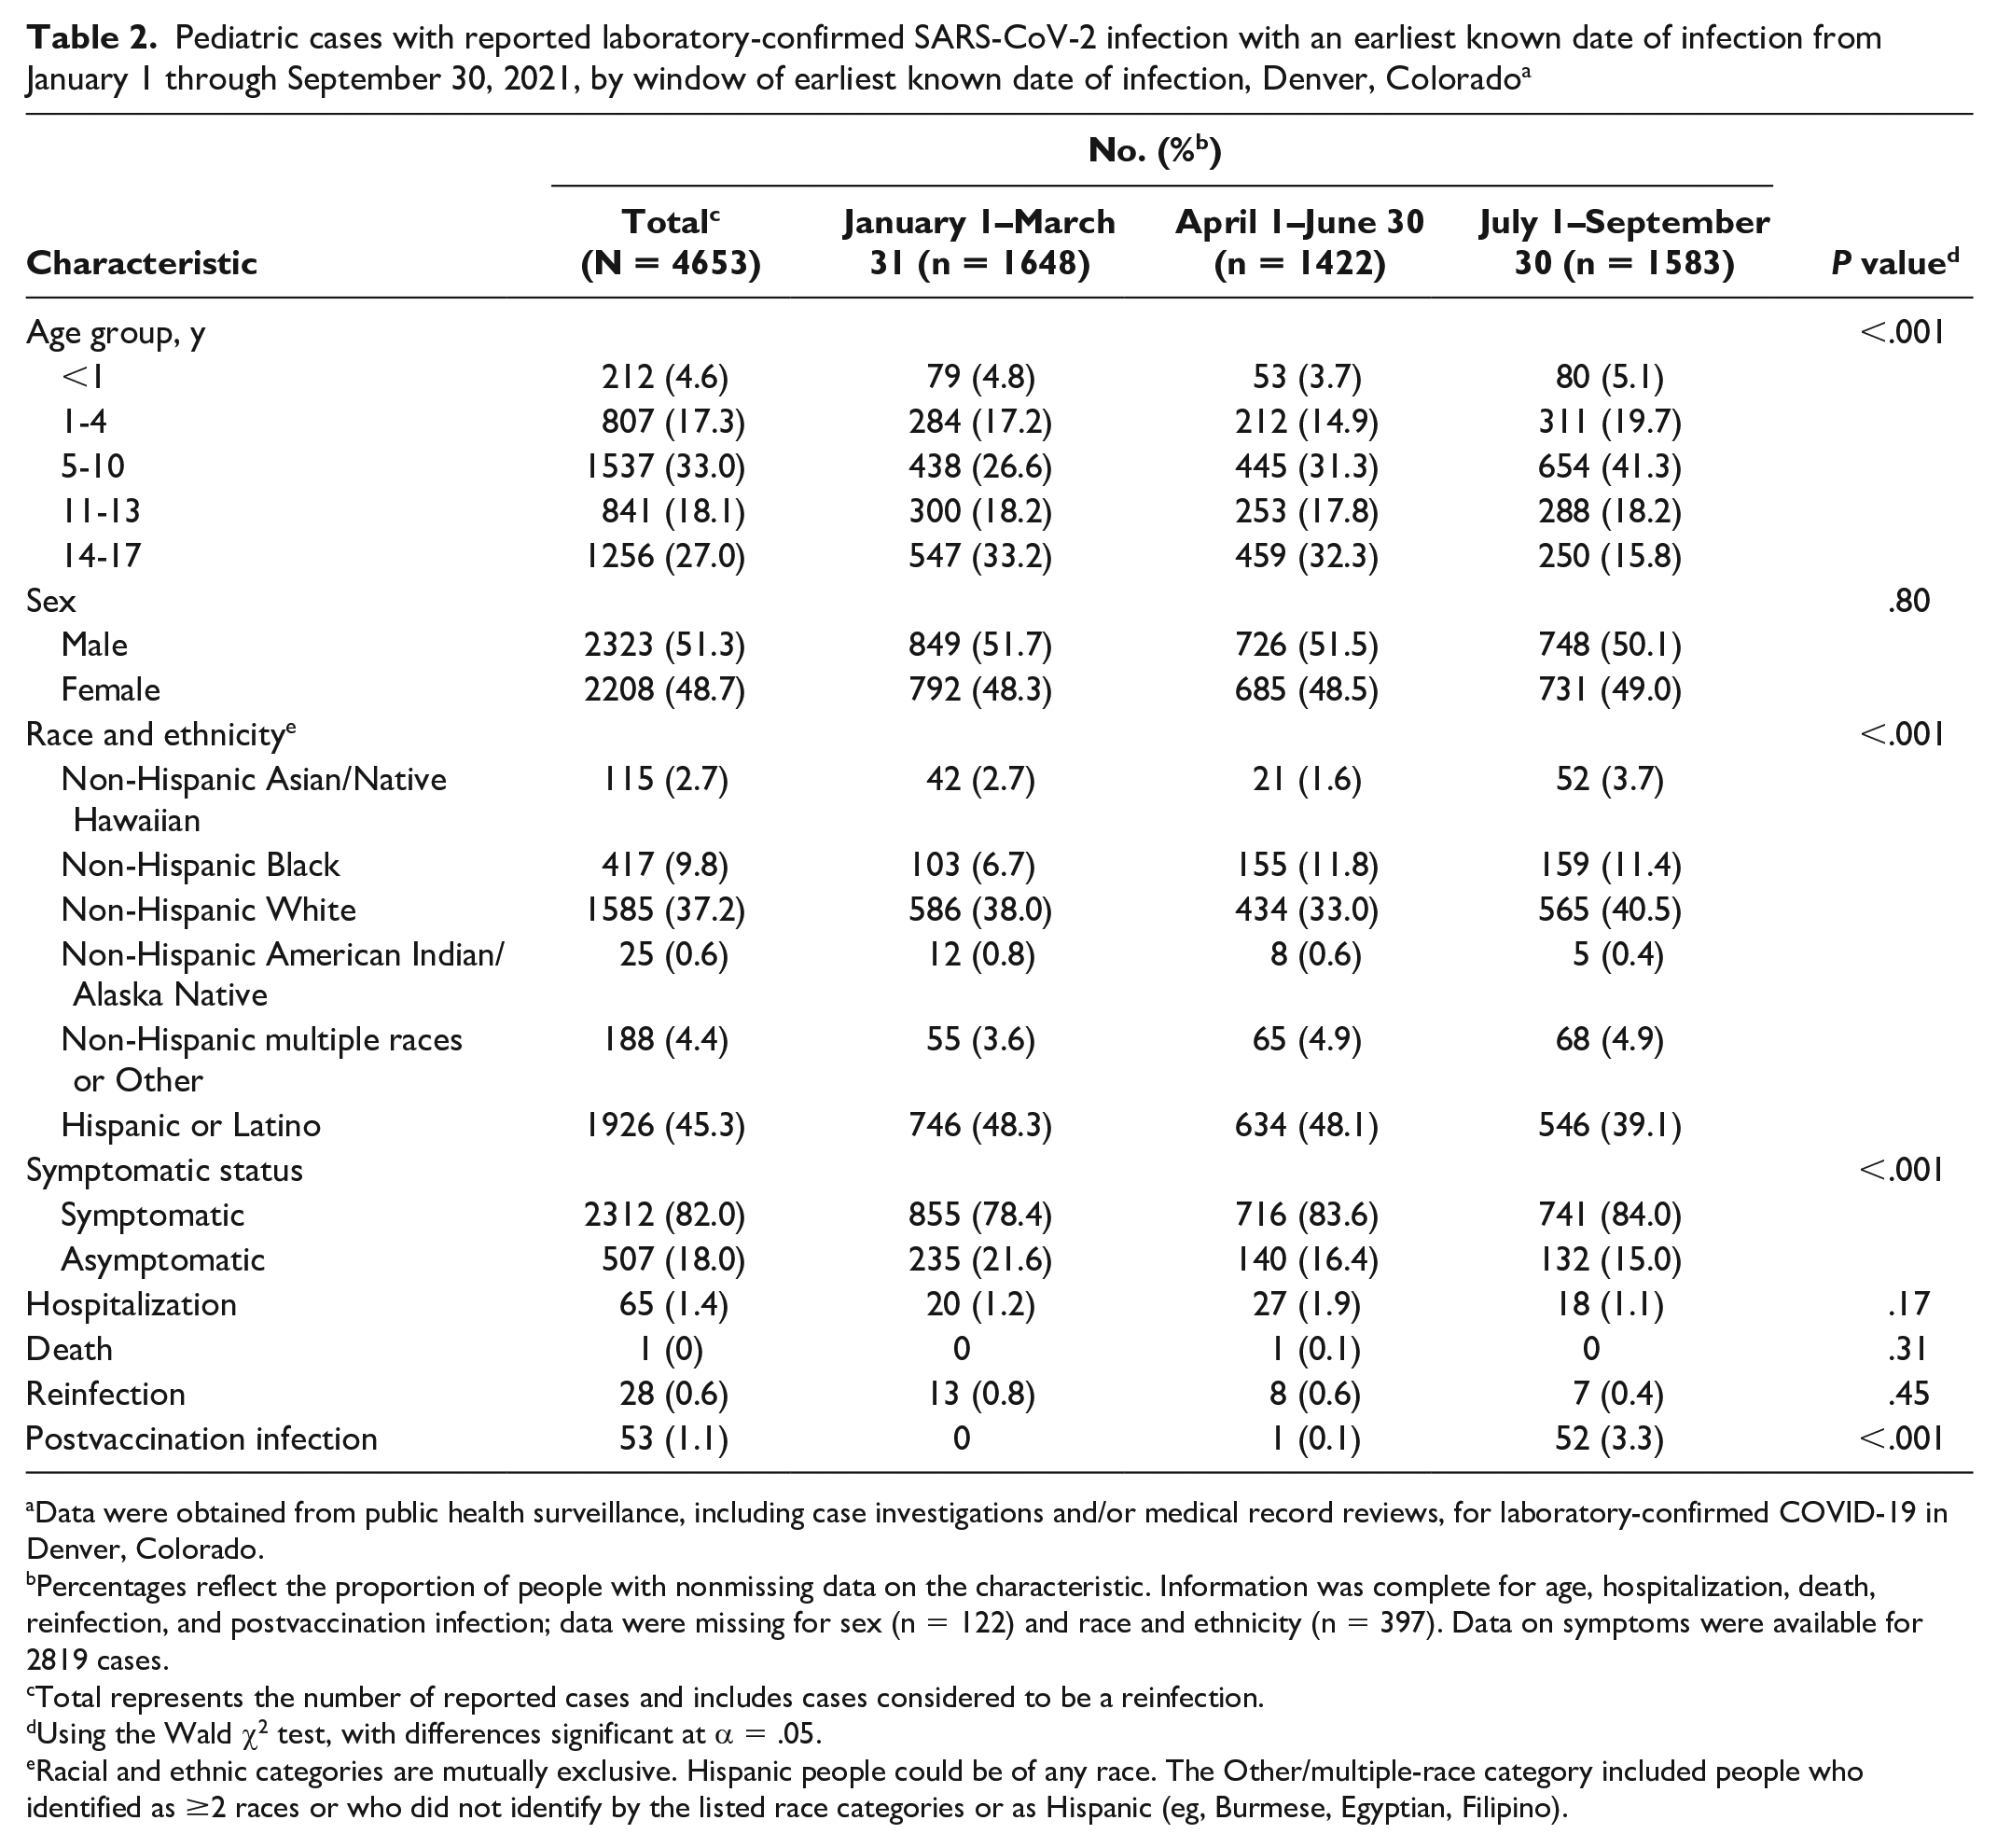
The number of pediatric cases generally mirrored the epidemiologic curve of cases among adults aged ≥18 years (Figure 1). Pediatric cases appeared to increase compared with adult cases during April–June 2021 and July–September 2021. From January 1 through September 30, 2021, 4653 (47.4%) pediatric cases were reported. Cases were roughly equally distributed across the 3 periods (Table 2). We found a decreasing trend in cases throughout 2021 among adolescents aged 14-17 years and an increasing trend among children aged 5-10 years. In 2020, cases among Hispanic/Latino children had an IR of 61.8 (95% CI, 60.0-63.6; P < .001). The proportion of cases among Hispanic/Latino children declined in 2021 compared with 2020, and we noted increasing trends of cases among non-Hispanic White children. Proportions of reported cases did not differ significantly by sex, hospitalization, or death across the 3 periods.
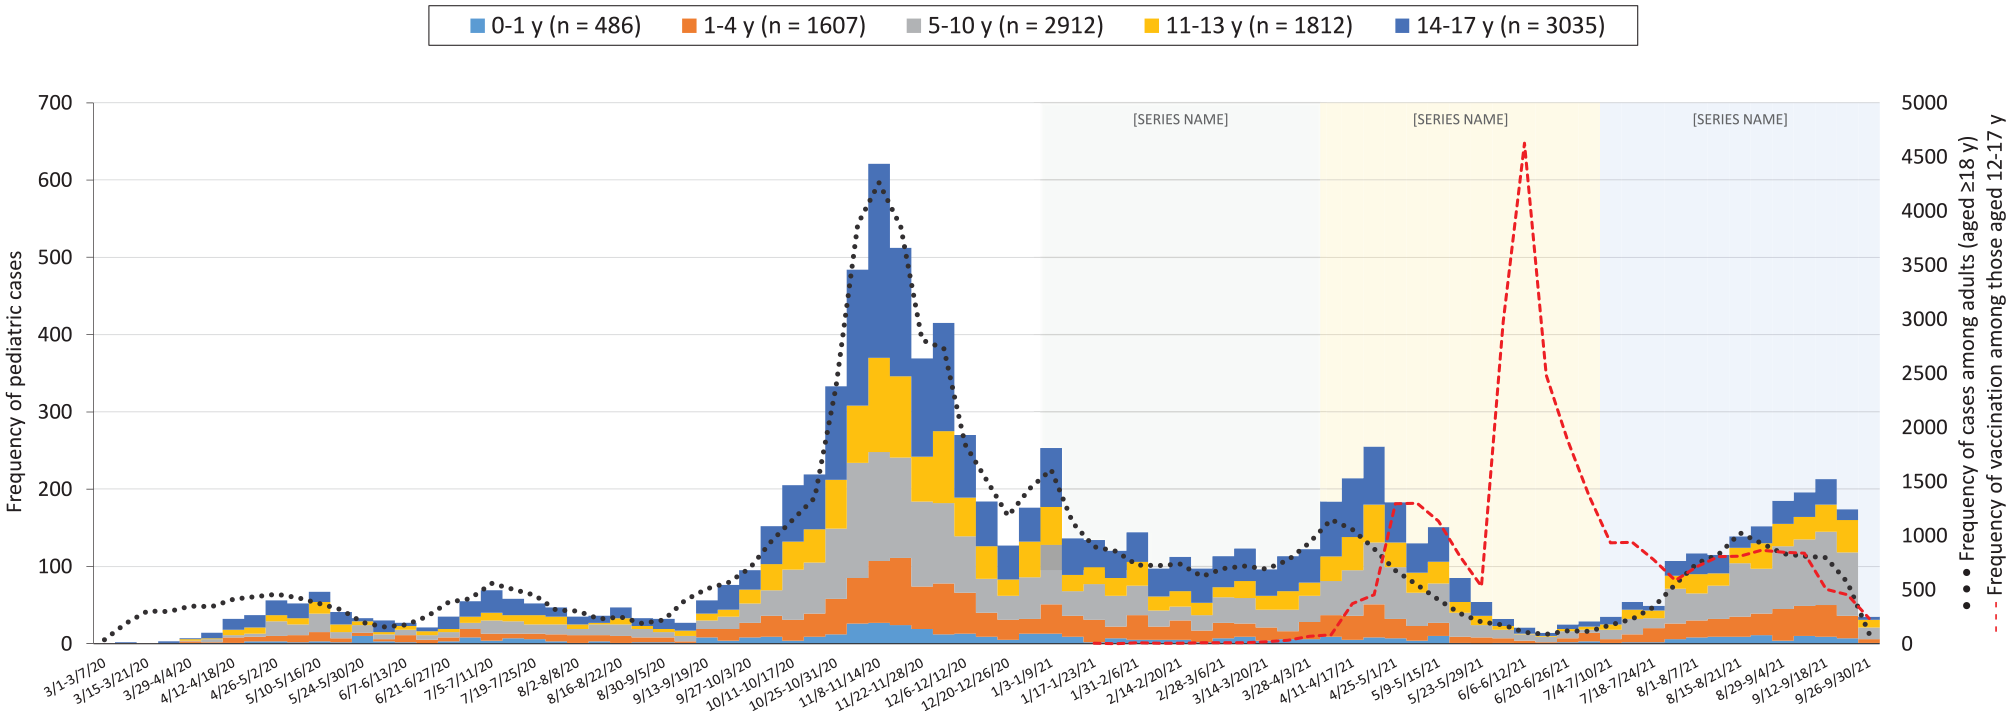
Frequency of cases of SARS-CoV-2 infection among infants, children, and adolescents aged 0 to 17 years (N = 9850), by age and earliest known date of infection, Denver, Colorado, March 1, 2020, through September 30, 2021. In addition, frequency of cases among adults aged ≥18 years (N = 64 744) and frequency of completed vaccinations among children and adolescents aged 12 to 17 years (N = 28 737). Data were obtained from public health surveillance, including case investigations and/or medical record reviews, for laboratory-confirmed COVID-19 in Denver.
Pediatric cases with reported laboratory-confirmed SARS-CoV-2 infection with an earliest known date of infection from January 1 through September 30, 2021, by window of earliest known date of infection, Denver, Colorado a
Data were obtained from public health surveillance, including case investigations and/or medical record reviews, for laboratory-confirmed COVID-19 in Denver, Colorado.
Percentages reflect the proportion of people with nonmissing data on the characteristic. Information was complete for age, hospitalization, death, reinfection, and postvaccination infection; data were missing for sex (n = 122) and race and ethnicity (n = 397). Data on symptoms were available for 2819 cases.
Total represents the number of reported cases and includes cases considered to be a reinfection.
Using the Wald χ2 test, with differences significant at α = .05.
Racial and ethnic categories are mutually exclusive. Hispanic people could be of any race. The Other/multiple-race category included people who identified as ≥2 races or who did not identify by the listed race categories or as Hispanic (eg, Burmese, Egyptian, Filipino).
Household Transmission
We were able to geocode most pediatric cases (98.6%, 9673 of 9815). We identified 7496 unique households with ≥1 pediatric case (Table 3). Most households reported >1 case (4420 of 7496, 59.0%). We could not determine transmission dynamics for 3537 children who were the only household case and/or had an EKDI outside the transmission window of another household case. Within household clusters, most of the 6136 pediatric cases were a secondary case (n = 3959, 64.5%), followed by index case (n = 1170, 19.1%) or co–index case (n = 1007, 16.4%). Adolescents aged 14-17 years composed a large proportion of index (n = 379, 32.4%) and co–index (n = 278, 27.6%) cases, while children aged 5-10 years composed a large proportion of co–index (n = 319, 31.7%) and secondary (n = 1314, 33.2%) cases. Household pediatric transmission dynamics differed significantly by age group (P < .001). Compared with children in other racial and ethnic groups, non-Hispanic White children had an increased risk of being an index or co–index case (RR = 1.14; 95% CI, 1.06-1.23; P < .001), while Hispanic/Latino children had an increased risk of being a secondary case (RR = 1.07; 95% CI, 1.03-1.11; P < .001).
Household cluster transmission dynamics among pediatric cases with reported laboratory-confirmed SARS-CoV-2 infection with an earliest known date of infection from March 1, 2020, through September 30, 2021, Denver, Colorado a
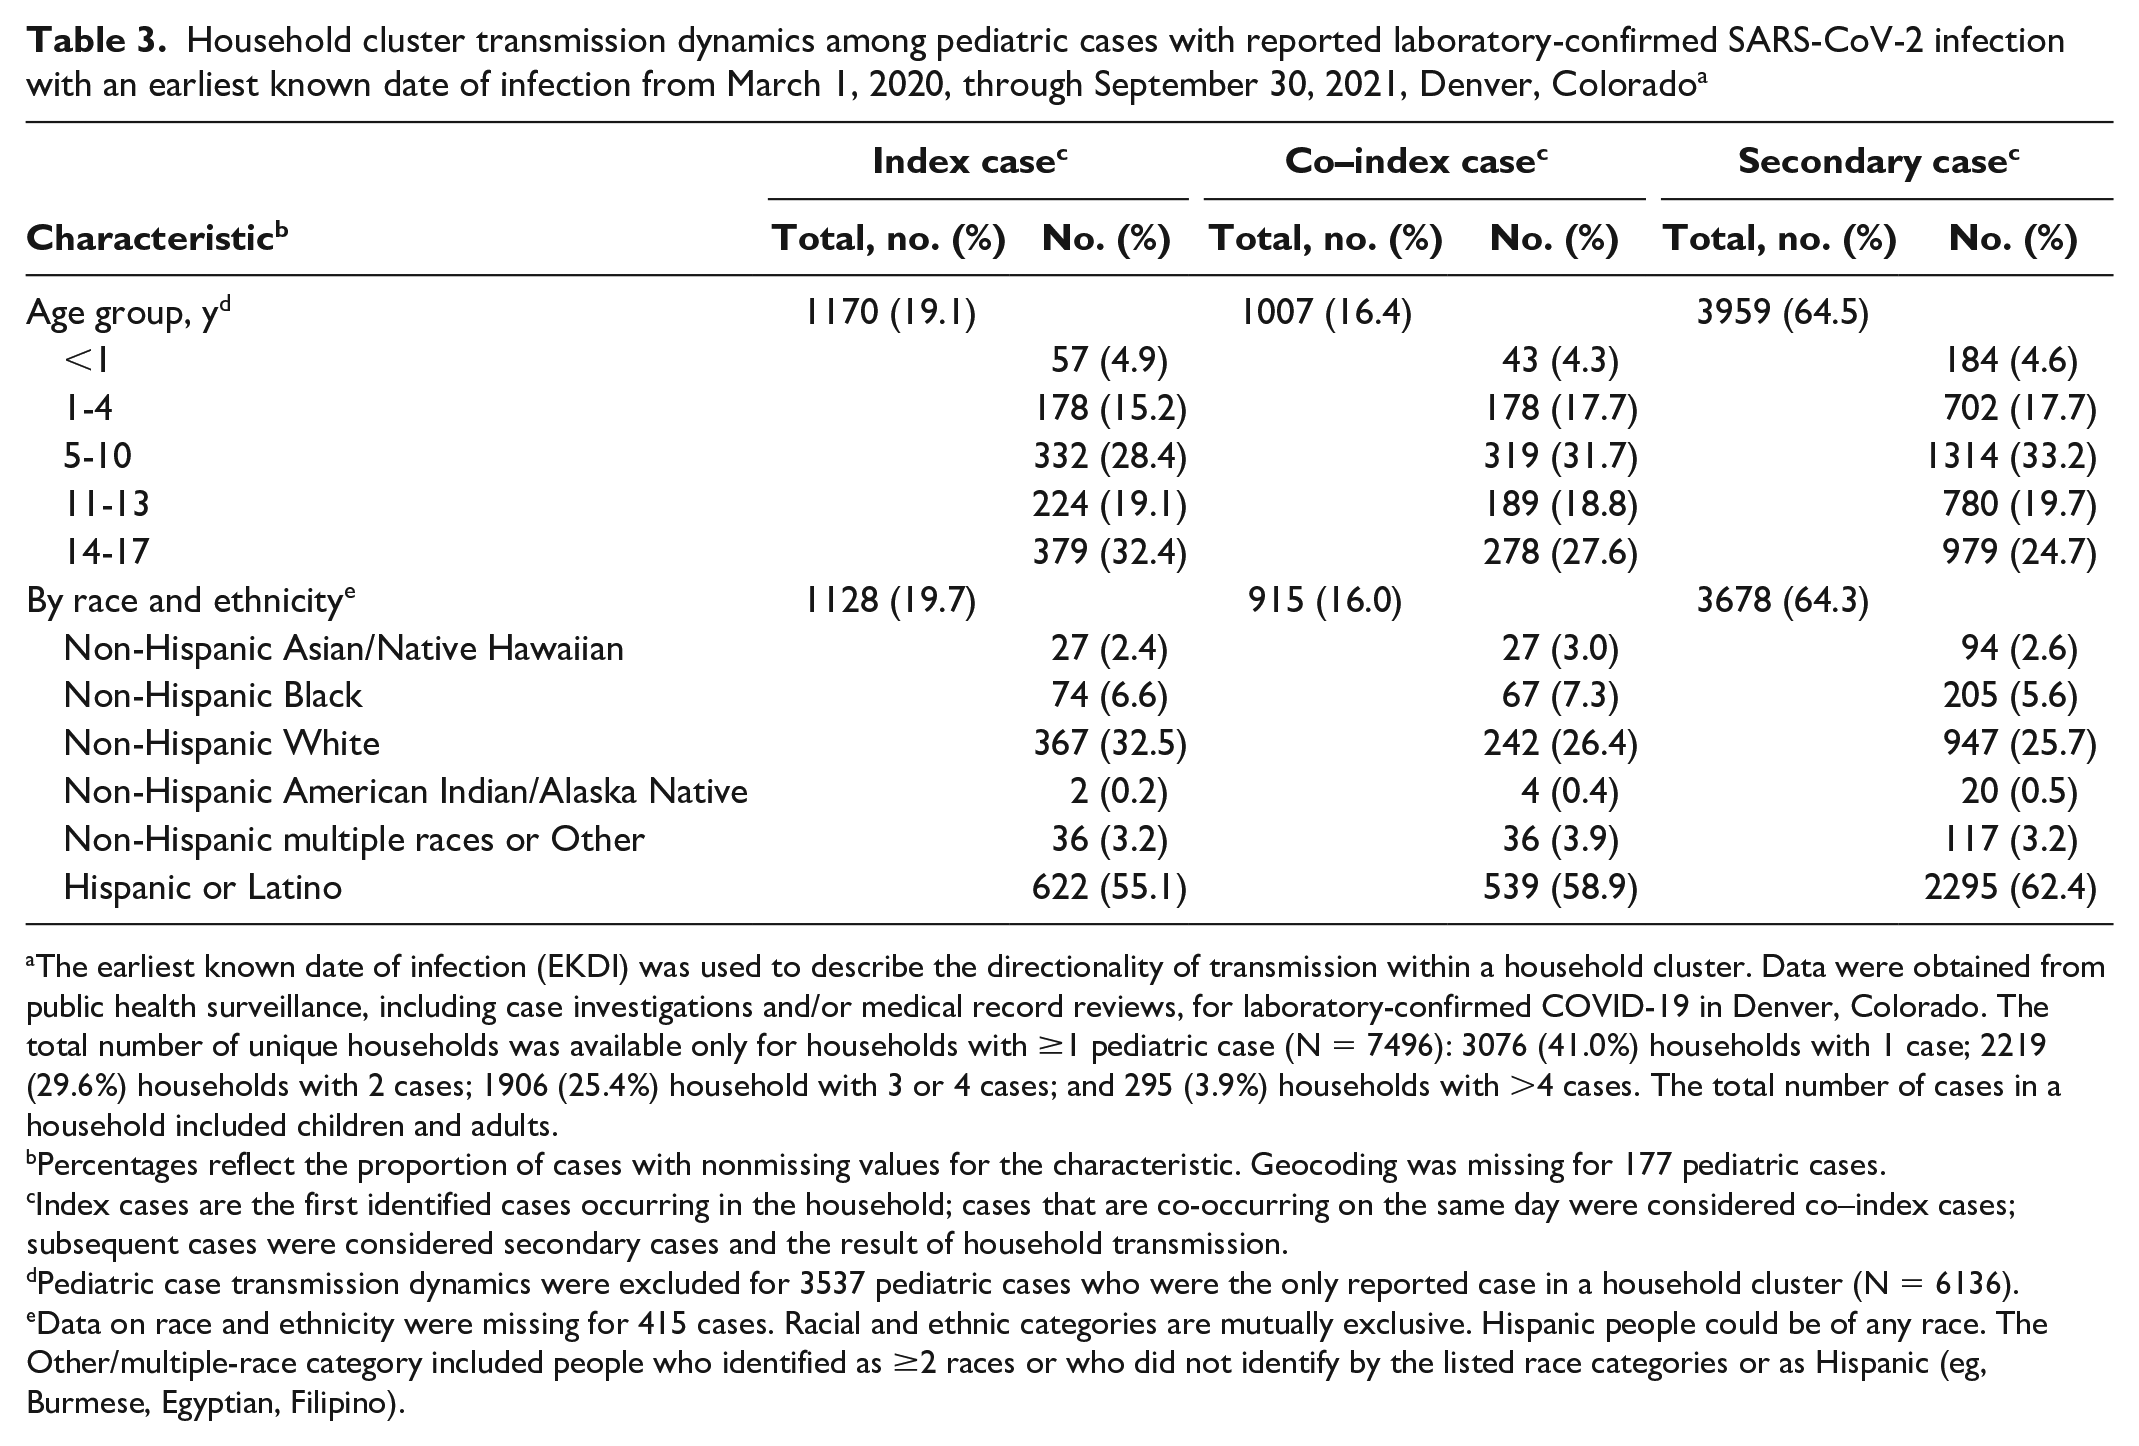
The earliest known date of infection (EKDI) was used to describe the directionality of transmission within a household cluster. Data were obtained from public health surveillance, including case investigations and/or medical record reviews, for laboratory-confirmed COVID-19 in Denver, Colorado. The total number of unique households was available only for households with ≥1 pediatric case (N = 7496): 3076 (41.0%) households with 1 case; 2219 (29.6%) households with 2 cases; 1906 (25.4%) household with 3 or 4 cases; and 295 (3.9%) households with >4 cases. The total number of cases in a household included children and adults.
Percentages reflect the proportion of cases with nonmissing values for the characteristic. Geocoding was missing for 177 pediatric cases.
Index cases are the first identified cases occurring in the household; cases that are co-occurring on the same day were considered co–index cases; subsequent cases were considered secondary cases and the result of household transmission.
Pediatric case transmission dynamics were excluded for 3537 pediatric cases who were the only reported case in a household cluster (N = 6136).
Data on race and ethnicity were missing for 415 cases. Racial and ethnic categories are mutually exclusive. Hispanic people could be of any race. The Other/multiple-race category included people who identified as ≥2 races or who did not identify by the listed race categories or as Hispanic (eg, Burmese, Egyptian, Filipino).
Community-Level Indicators
We found overlap between the geographic distribution of pediatric case rates, proportion of households ≤150% of the federal poverty level, and proportion of households with ≥3 people (Figure 2). These indicators had notable shifts from 2020 to 2021. In 2020, neighborhoods above the median percentage of families ≤150% of the federal poverty level (>6.4%) had a 35.1% higher pediatric case rate per 1000 population than neighborhoods in the lowest quartile (quartile 4: RR = 1.35 [95% CI, 1.21-1.50; P < .001]; quartile 3: RR = 1.27 [95% CI, 1.14-1.41; P < .001]). Similarly, in 2020, pediatric case rates in neighborhoods with the highest quartile percentage of households with ≥3 people (≥39.0%) were 35.4% higher per 1000 population than rates in neighborhoods with the lowest quartile (RR = 1.35; 95% CI, 1.22-1.50; P < .001). Cumulative 2020-2021 pediatric case rates in neighborhoods in the highest quartile of households with ≥3 people were 16.7% higher per 1000 population than the lowest quartile (RR = 1.17; 95% CI, 1.08-1.26; P < .001). We found no association between poverty and cumulative 2020-2021 pediatric COVID-19 case rates.
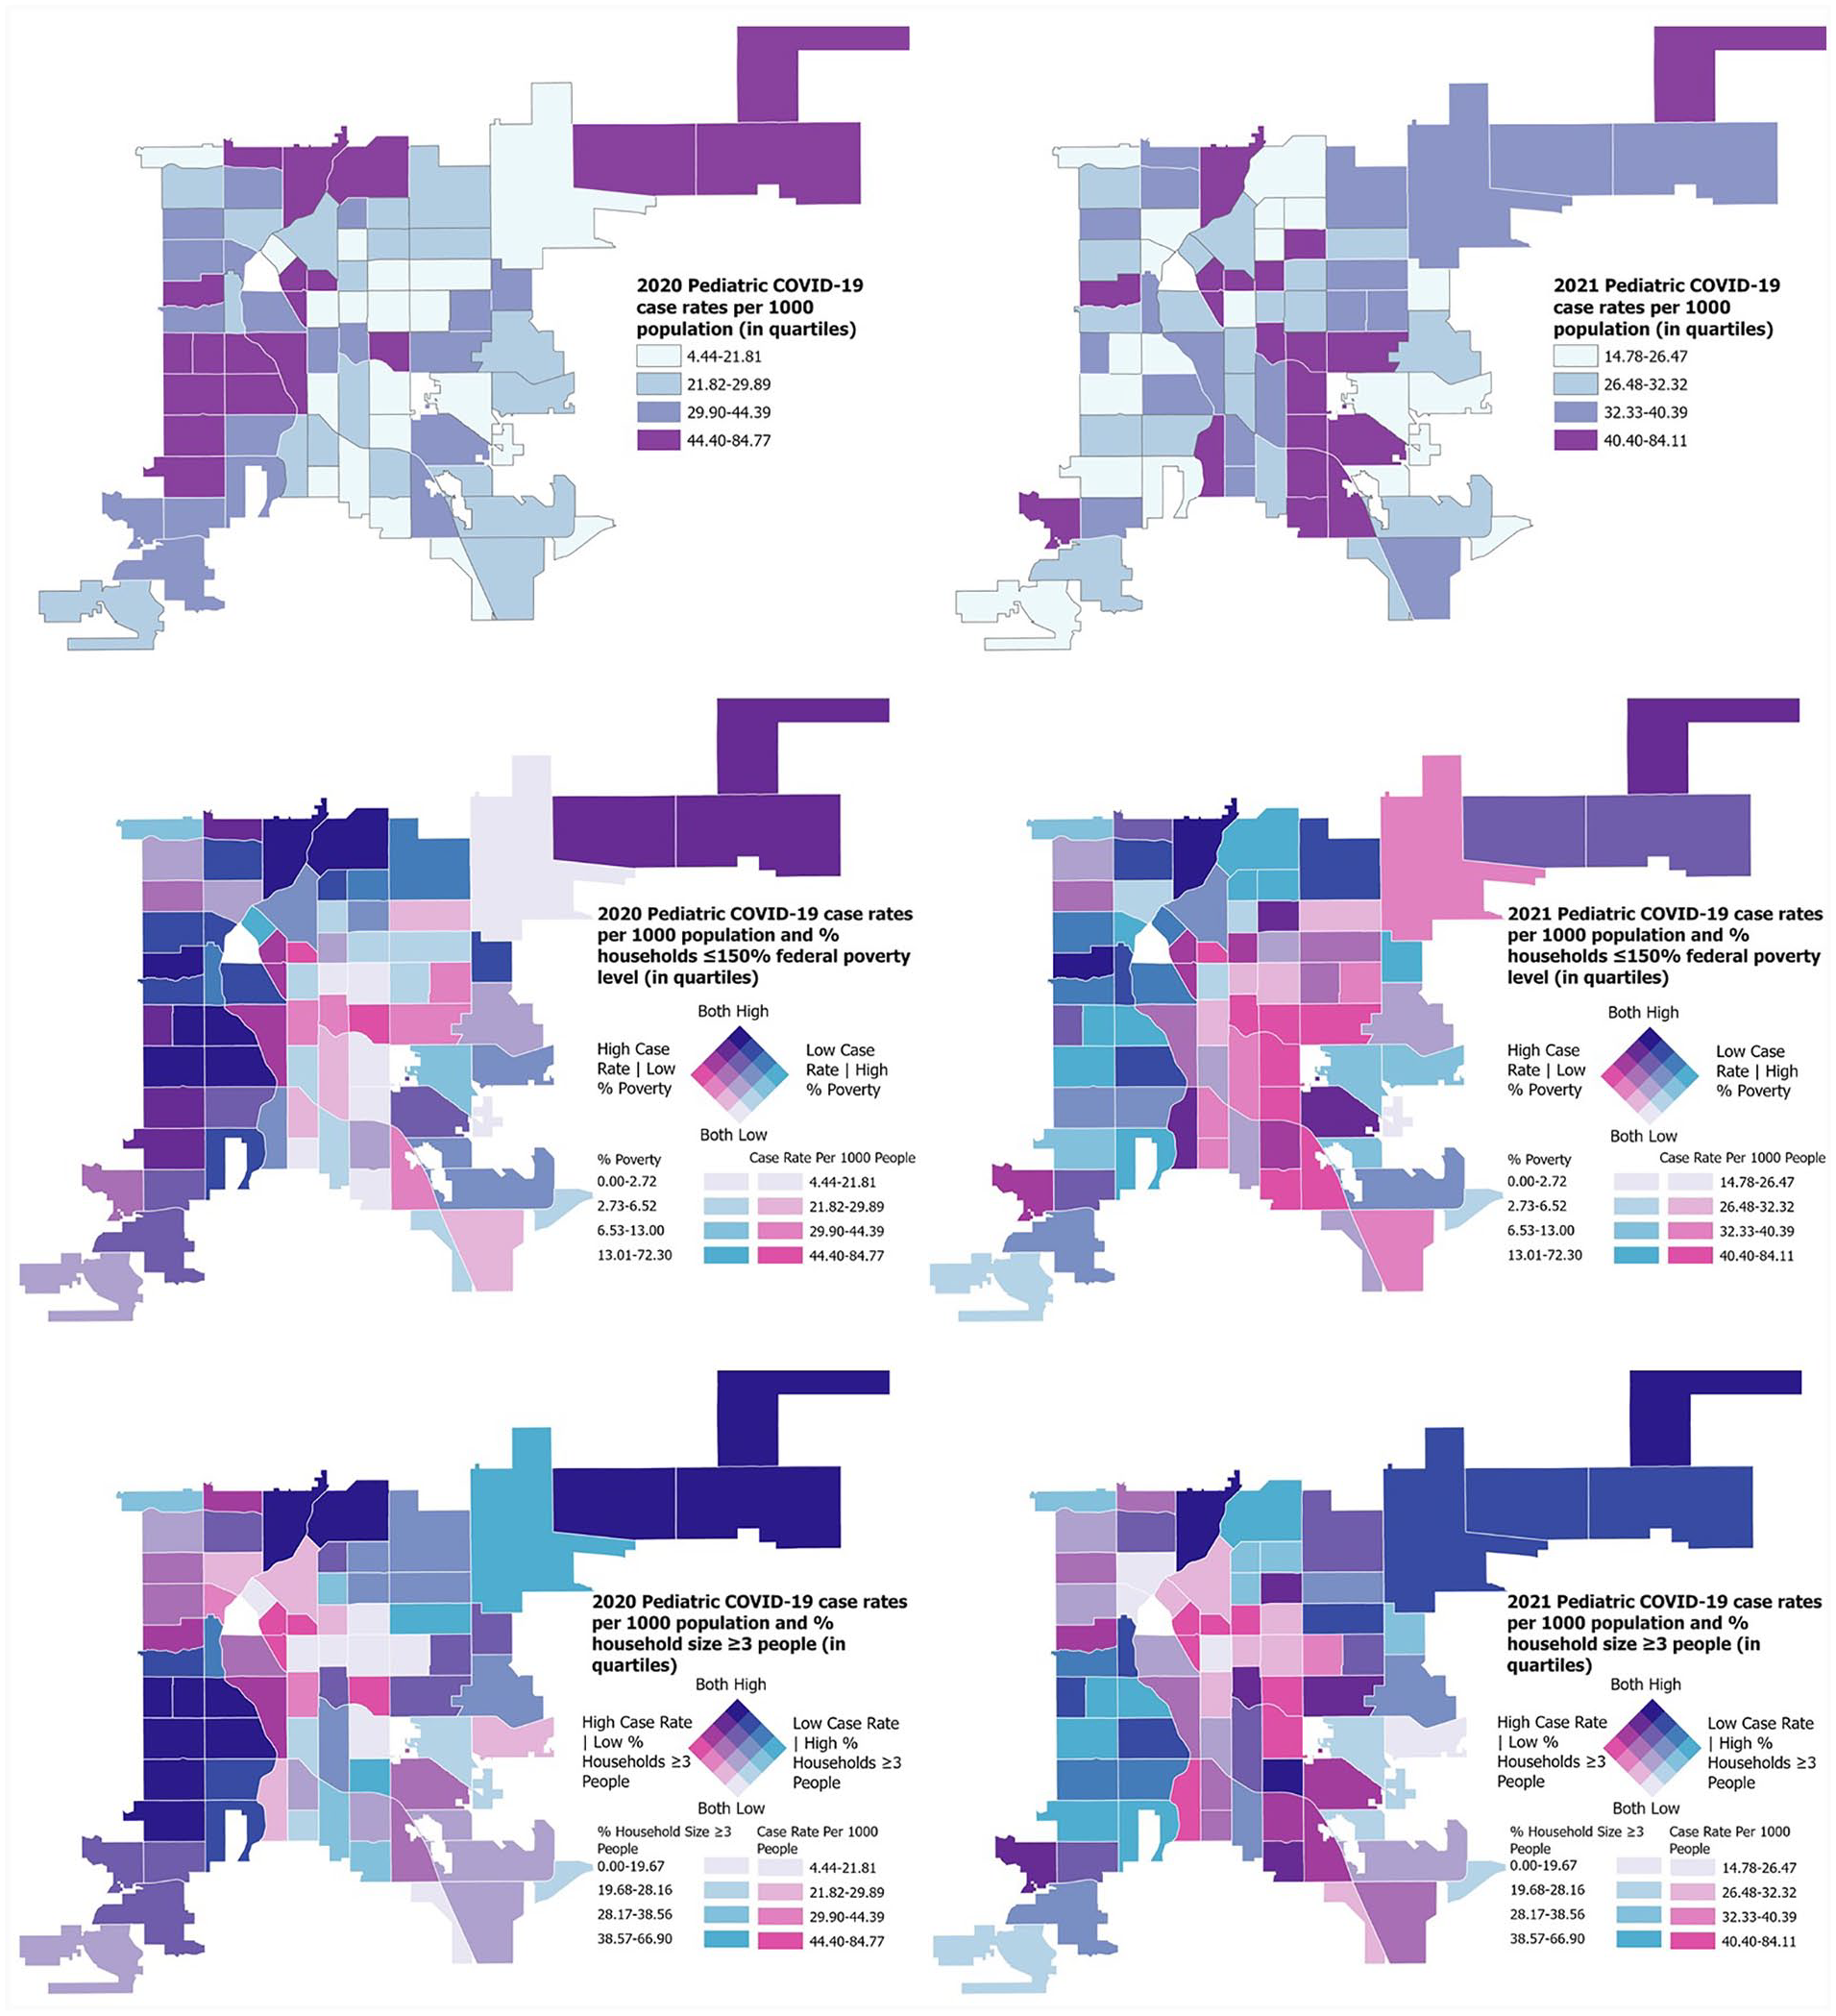
Pediatric COVID-19 case rates per 1000 population by neighborhood, proportion of households living at ≤150% of the federal poverty level (in quartiles) within neighborhoods, and proportion of households with ≥3 people (in quartiles) within neighborhoods, Denver County, Colorado, 2020 and 2021. Data were obtained from public health surveillance, including case investigations and/or medical record reviews, for laboratory-confirmed COVID-19 in Denver.
Discussion
This retrospective analysis offers unique insight into the demographic and clinical characteristics, transmission dynamics, and selected ecological associations of 9815 children who had COVID-19 in Denver. Consistent with previous research and national trends, we found that children and adolescents aged 11-17 years have higher case rates than younger children.32-34 Our study found that most children had mild symptoms consistent with respiratory tract infection and that COVID-19–related death, hospitalizations, reinfection, and postvaccination infections were rare.
Hispanic/Latino children were 1.6 times more likely to have had COVID-19 than non-Hispanic White children, similar to reports among adults in Denver. 35 Hispanic adults who had COVID-19 were more likely than non-Hispanic adults to be members of larger households, to have had known exposure to people with COVID-19, to work in essential industries, and to face financial constraints that compelled them to work when ill.35-38 Variations in case rates by race and ethnicity may be the result of limited access to testing sites, vaccinations, and adequate prevention support. 39
During July 1–September 30, 2021, the proportion of COVID-19 cases among Hispanic/Latino children and adolescents decreased while the proportion of cases among non-Hispanic White children and adolescents increased. Previous research indicated that racial and ethnic disparities decreased as the case incidence increased among non-Hispanic White people. 40 Furthermore, in 2020, higher pediatric case rates were found in neighborhoods associated with higher proportions of households living at ≤150% of the federal poverty level and households with ≥3 people; in 2021, this association changed as higher case rates shifted to neighborhoods with smaller proportions of poverty and larger household size. This shift may be the result of increased cases among non-Hispanic children in 2021 and the protective feature of prior infection. 41
Within household clusters, most pediatric cases were considered the result of household transmission (64.5%), consistent with previous studies. 42 More than one-third of pediatric cases were either an index case or co–index case, whereas other studies have indicated children compose 8% to 22% of index cases.43,44 Household transmission and increased secondary attack rates are associated with indoor exposure to the SARS-CoV-2 virus, an amplified viral load among index cases and other household members, and increased household density.43,45 Hispanic/Latino children had an increased risk of being a secondary case. This finding aligns with previously discussed sociodemographic indicators associated with Hispanic/Latino households contributing to increased household transmission (larger household size and essential industry employment).35-38
Trends in the number of pediatric cases were similar to trends among adults, with some exceptions. During April 1–June 30, 2021, the number of pediatric cases increased while the number of adult cases decreased. This divergent increase in pediatric cases may have been a by-product of higher rates of COVID-19 vaccinations among adults than among children and adolescents, along with the increased circulation of the more transmissible Alpha variant.30,46 By April 1, 2021, 23.3% of adult Denver residents were fully vaccinated. 47 At that time, only people aged ≥16 years were eligible for vaccination under a US Food and Drug Administration Emergency Use Authorization, later amended on May 12, 2021, to include people aged ≥12 years, and again on November 2, 2021, to include people aged ≥5 years.48-50 We observed a similar divergent increase in pediatric cases during July 1–September 30, 2021. This second divergence may have been a by-product of the Delta variant becoming the dominant VOC, 30 with a 10% to 20% higher transmissibility than the Alpha variant, 51 and the start of Denver Public Schools’ in-person learning on August 23, 2021. 52 Secondary transmission of SARS-CoV-2 in schools and childcare programs depends on the background rate of community infection and the use of prevention strategies.21,22 During 2021, we found that the proportion of cases among children aged 5-10 years increased while the proportion of cases among adolescents aged 14-17 years decreased; this increased proportion was most dramatic between the second and third periods with the peak of fully vaccinated children and adolescents aged 12-17 years.
As evidenced by this shift in disease incidence from vaccine-eligible to vaccine-ineligible cohorts, the COVID-19 vaccine is one of the most robust strategies to combat transmission and disease.53,54 Although vaccine hesitancy was initially high among Hispanic/Latino people, this racial and ethnic disparity subsequently narrowed and, as of early 2022, non-Hispanic White people accounted for the largest proportion of unvaccinated people.55,56 Efforts to reduce the number of pediatric cases will require the promotion of pediatric vaccination and vaccination of the entire household, as shown by the extent of index and co–index transmission within households. Until nearly all eligible community members are vaccinated, sustained community education and prevention strategies (eg, wearing face masks indoors, social distancing, routine testing) are paramount, especially when the risk of emerging VOCs, such as Omicron, B.1.1.529, looms. Future efforts are required to address vaccine hesitancy and the inclusion of children as critical in prevention and therapeutic strategies to curtail the COVID-19 pandemic.
Limitations
This study had several limitations. First, the primary source of data was public health surveillance data, with most epidemiologic information being self-reported. Information was not available for patients who could not be contacted or were not hospitalized. Second, the case interview was conducted at the time of reporting and did not include symptoms that emerged after the interview. Third, guidance on SARS-CoV-2 testing varied throughout the study period, where initially only those who were symptomatic were eligible for testing, introducing a reporting bias. By 2021, testing accessibility had increased, including the debut of home testing, the results of which may not have been reported. Variations in testing prevented the comparison of testing practices between children and adults. Fourth, data collection errors may have resulted in incorrect addresses or last names, leading to incomplete accounting of household clusters. The method for linking cases could not account for split households (ie, children who split their time between households), which could have underestimated household transmission. Fifth, determining whether a pediatric case was an index, co–index, or secondary case was dependent on the EKDI; information on onset of symptoms was subject to recall bias. However, within a given household it is unlikely that the accuracy of recall varied greatly. Finally, interpretations of community-level associations should be restricted to a neighborhood level.
Conclusion
In Denver, COVID-19 disproportionately affected adolescents aged 14-17 years, children and adolescents who identified as Hispanic/Latino, and children and adolescents who resided in neighborhoods with ≥3 people. A targeted public health approach that emphasizes culturally appropriate and proven prevention strategies, addresses vaccine hesitancy, focuses on increasing vaccination access for all household members, and promotes community education is vital. The focus of ongoing pandemic response must also include children to ultimately ensure disease control.
Footnotes
Acknowledgements
The authors thank the Public Health Institute at Denver Health (formerly Denver Public Health) COVID-19 Response Team, including the team leads, case managers, case investigators, and data management team for their tireless work in supporting the COVID-19 response. The authors also thank Christie Mettenbrink, MPH, of the Public Health Institute at Denver Health, for geocoding all cases. Finally, the authors acknowledge the willingness of all individuals and families affected by COVID-19 who completed case interviews, which allowed us to characterize and understand the disease and transmission in our community.
Authors’ Note
Thresia Sebastian and Jesse Carlson contributed equally to this work as co–first authors.
Declaration of Conflicting interests:
The authors declared no potential conflicts of interest with respect to the research, authorship, and/or publication of this article.
Funding
The authors received no financial support for the research, authorship, and/or publication of this article.
Prior Presentation of Results
We presented the results of this study at the Children’s Hospital of Colorado Winter Research Poster Session in Aurora, Colorado, in February 2021 and at the Pediatric Academic Societies 2021 Virtual Meeting Poster Session in May 2021.