
Abstract
Objectives:
Although influenza vaccinations are widely accessible, many people in the United States do not receive them as recommended by the Centers for Disease Control and Prevention. This study examined the relationship between income and receiving the influenza vaccination among US adults.
Methods:
We used 2014-2018 National Health Interview Survey data (N = 138 697). Adults self-reported whether they received a shot or nasal spray vaccine within the previous 12 months and their total family income. We used multivariable logistic regression to obtain odds ratios and 95% CIs.
Results:
Approximately 43% of adults reported receiving the influenza vaccine in the previous 12 months. After adjustment, adults in lower-income-level categories had decreased odds of influenza vaccine receipt compared with adults with a total family income ≥$100 000. Specifically, adults with a total family income <$35 000 had 21% decreased odds of receiving the influenza vaccine (adjusted odds ratio = 0.79; 95% CI, 0.75-0.83).
Conclusions:
In this population of US adults, lower income levels were associated with decreased odds of influenza vaccine receipt. The relationship between income and receipt of the influenza vaccine may have important implications for future influenza vaccination efforts. Increasing influenza vaccination coverage among lower-income adults should be considered a public health priority.
The Centers for Disease Control and Prevention (CDC) recommends that all people aged 6 months or older receive influenza vaccination each year. 1 Although influenza vaccinations are readily available and cost-effective, barriers to influenza vaccination coverage exist.1-3 Influenza vaccination coverage rates in the United States are only 62.6% among children and adolescents aged 6 months to 17 years and 45.3% among adults aged ≥18 years. 1 Among adults, rates of influenza vaccination coverage vary. For example, in 2018-2019, influenza vaccination coverage among adults aged ≥65 years was 68.1%, whereas the percentage for adults aged 18-49 years was 34.9%. 1 In addition to these observed differences among age groups, disparities in influenza vaccination coverage were also seen among races and ethnicities during the same period. 1 Influenza vaccination coverage rates were 48.7% for non-Hispanic White adults and 44.0% for Asian adults compared with 37.1% and 39.4% for Hispanic and non-Hispanic Black adults, respectively. 1
Although previous studies found age, race, and health insurance coverage to be associated with influenza vaccination coverage, the literature that examines the relationship between income and influenza vaccination is limited for adults living in the United States.4-12 Furthermore, the manner in which income was measured and categorized in previous studies varied in many ways.9,13-15 In some studies,9,13-15 income was measured at national, state, county, and community levels. Such geographic comparisons do not allow for analyses of individual-level associations.9,13,14
However, some studies that examined the relationship between influenza vaccination coverage and income among adults living in the United States measured income in a manner that allowed for individual-level analysis.8,10-12 Three of these studies found that adults with higher incomes were more likely than adults with lower incomes to receive their recommended influenza vaccinations.8,10,12 In the article by Fox et al, adults with an income >200% above the federal poverty level (FPL) had a higher prevalence of influenza vaccination within the past 12 months than adults with an income ≤200% above the FPL (prevalence ratio = 1.3; 95% CI, 1.3-1.3). 8 The study by Lau et al found no significant associations between influenza vaccination coverage for adults with a household income 100%-199% above the FPL or >300% above the FPL. 10 However, adults with a household income 200%-299% above the FPL were 57% more likely to receive their influenza vaccine than adults with a household income 0%-99% above the FPL. 10 Similarly, Villarroel and Vahratian 12 found that the percentage of adults with diagnosed diabetes who had an influenza vaccine in the past year increased as poverty status, based on FPL, improved. Nearly 51% of adults with family incomes below the FPL had received their influenza vaccine in the past year, whereas 57.8% of adults with family incomes 100% of the FPL to <200% above the FPL and 65.9% of adults with family incomes ≥200% above the FPL had received their influenza vaccine in the past year. 12
The studies that found an association between influenza vaccination coverage and income used the FPL to measure income.8,10,12 However, the FPL, which was designed more than 50 years ago for temporary emergency use, no longer accurately captures data on all people experiencing poverty. 16 Lu et al 11 measured income using annual household income and found that influenza vaccination coverage did not correspond with a rise in annual income level. That study found no significant associations among individuals who made $35 000-$49 999 (odds ratio [OR] = 1.02; 95% CI, 0.85-1.21), $50 000-$74 999 (OR = 1.13; 95% CI, 0.97-1.31), or ≥$75 000 (OR = 1.03; 95% CI, 0.89-1.18) compared with those who made <$35 000 for the year. 11
The fundamental cause theory states that health inequalities result from an unequal distribution of resources. 17 People with high income levels are better positioned than people with low income levels to follow the vaccination recommendations set forth by CDC and prevent subsequent diseases from occurring. 17 The objective of this study was to explore how total family income is associated with receipt of influenza vaccination using data from the National Health Interview Survey (NHIS). Further analysis of annual family income is important to aid in identifying populations of US adults who are unlikely to receive their recommended influenza vaccinations. Our study approach is novel because it categorizes multiple levels of family income, without using the FPL, which may not adequately reflect all people experiencing poverty.8,10-12 Thus, our study may provide a more accurate and in-depth comparison of various income levels than previous studies have. Our findings may be used to assist in addressing the income-related barriers that challenge influenza vaccination interventions in the United States.
Methods
The NHIS is a continuous population-based cross-sectional survey. Since 1963, the NHIS has supported and provided measures for the National Center for Health Statistics to monitor the health and behaviors of the US population. 18 The NHIS provides our study the ability to analyze household variables while considering the health behaviors of people in a residence. Trained interviewers administered the in-person survey through a series of questionnaires to an adult living in a residence. Survey information was collected on the household overall, 1 sample adult, and, when applicable, 1 sample child. Our study team obtained the data from the Integrated Public Use Microdata Series, a platform that collects and integrates databases. 19
Sample Population
The NHIS uses a geographical cluster sampling design to sample households throughout the United States. 20 The sample population of the NHIS consists of noninstitutionalized citizens residing in the United States in households and noninstitutional group quarters. Noninstitutional group quarters include homeless shelters, rooming houses, and group homes. The NHIS excludes adults living in long-term care facilities, people living in correctional facilities, active-duty military personnel, and US citizens living abroad.
From 2014 through 2018, a total of 155 556 adults and 53 892 children completed the survey. For this analysis, we considered only data on adults. The 5-year average total sample adult response rate was 54.9%. 18 This study excluded people who did not provide information on the questions on total family income (n = 14 150) and influenza vaccination (n = 2709). The total sample size after excluding missing data was 138 697. Because this was a secondary data analysis of de-identified NHIS data, the institutional review board at the University of North Carolina at Charlotte did not require approval.
Exposure Assessment
The primary exposure of interest was total family income. Total family income is the unadjusted gross income a family receives before taxes for a given year. In a series of closed-ended questions, respondents self-reported the numeric value range of the family income from the previous calendar year (2013-2017). Sources of income for the family included Supplemental Security Income, child support payments, Veterans Affairs payments, workers’ compensation, and other supplemental incomes. 20 We categorized income values into the following groups: <$35 000, $35 000-$49 999, $50 000-$74 999, $75 000-$99 999, and ≥$100 000. We chose the ≥$100 000 category as the referent group because the mean household income in the United States is approximately $100 000. 21
Outcome Assessment
The outcome variable was whether the person had received the influenza vaccine in the past 12 months. For this analysis, we considered participants who reported receiving the influenza vaccine (via shot or nasal spray) in the past 12 months to have the outcome.
Covariate Assessments
Based on the existing literature on income and influenza vaccination coverage, the covariates included were age, sex, race and ethnicity, marital status, educational attainment, region (Northeast, North Central/Midwest, South, and West), employment status, and status of health insurance coverage.4-15
Statistical Analysis
We used frequencies and percentages to describe the study sample and logistic regression to model the association between income and receipt of the influenza vaccine and determine other factors associated with receipt of the influenza vaccine. Given that several of the variables might be highly interrelated, we assessed variance inflation factors to detect the presence of multicollinearity between the independent variables. 22 Testing for multicollinearity detected no issues. We used multivariable logistic regression to obtain the final model by computing adjusted ORs (aORs) and 95% CIs. We used a backward elimination approach to determine which confounders met the threshold to be included in the final model. We included in the final model only variables with P < .20. 23 We set the significance level at P < .05 and used 95% CIs to test significance. Because of the complex sampling design used by NHIS, we conducted weighted analyses using Stata version 16.1 (StataCorp LLC).
Results
From 2014 to 2018, 42.9% of the study population had received the influenza vaccine in the previous 12 months, and 57.1% of participants had not (Table 1). Approximately 29.4% of the sample had a total family income <$35 000, and another 28.8% of the study population reported a total family income ≥$100 000. Of the study participants, 51.4% were women and 87.0% had obtained at least a high school education. Most of the study population was non-Hispanic White (65.5%), and 37.8% were unemployed.
Descriptive characteristics of the study population (N = 138 697), 2014-2018 National Health Interview Survey a
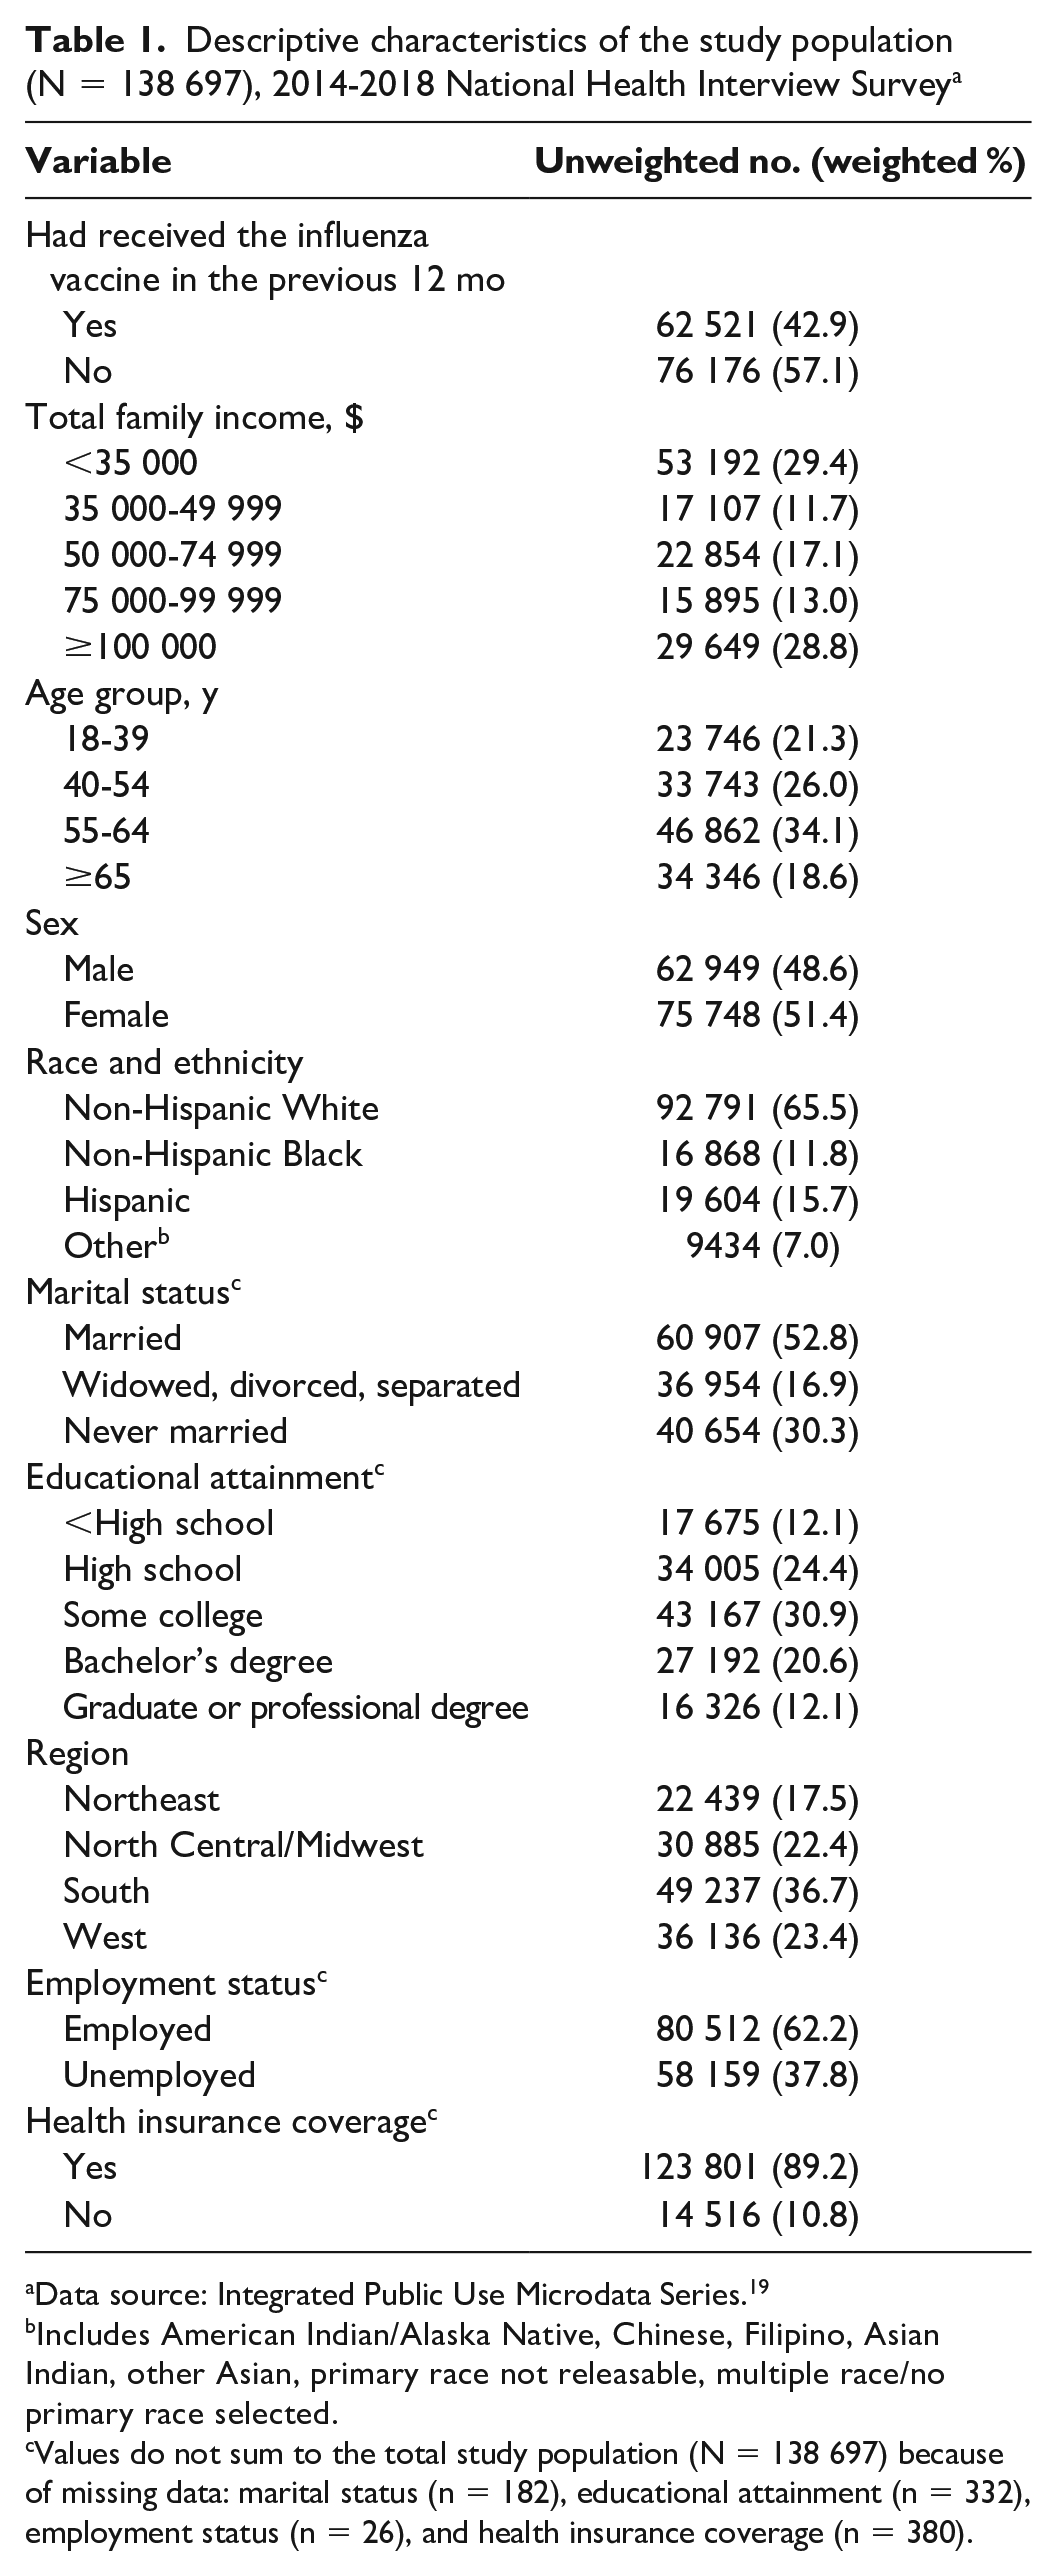
Data source: Integrated Public Use Microdata Series. 19
Includes American Indian/Alaska Native, Chinese, Filipino, Asian Indian, other Asian, primary race not releasable, multiple race/no primary race selected.
Values do not sum to the total study population (N = 138 697) because of missing data: marital status (n = 182), educational attainment (n = 332), employment status (n = 26), and health insurance coverage (n = 380).
Before adjustment for confounders, study participants who had a total family income <$50 000 had approximately 30% decreased odds of receiving the influenza vaccine within the past 12 months compared with study participants with a total family income ≥$100 000 (<$35 000: OR = 0.66 [95% CI, 0.64-0.69]; $35 000-$49 999: OR = 0.67 [95% CI, 0.64-0.71]; Table 2). Study participants with a total family income of $50 000-$74 999 had 0.74 (95% CI, 0.70-0.77) times the odds of receiving the influenza vaccine, and study participants in the second-highest income-level group ($75 000-$99 999) had approximately 20% decreased odds of receiving the vaccine compared with study participants with a total family income ≥$100 000 (OR = 0.81; 95% CI, 0.77-0.85). All findings were significant.
Association between total family income and demographic characteristics and influenza vaccination coverage, 2014-2018 National Health Interview Survey a
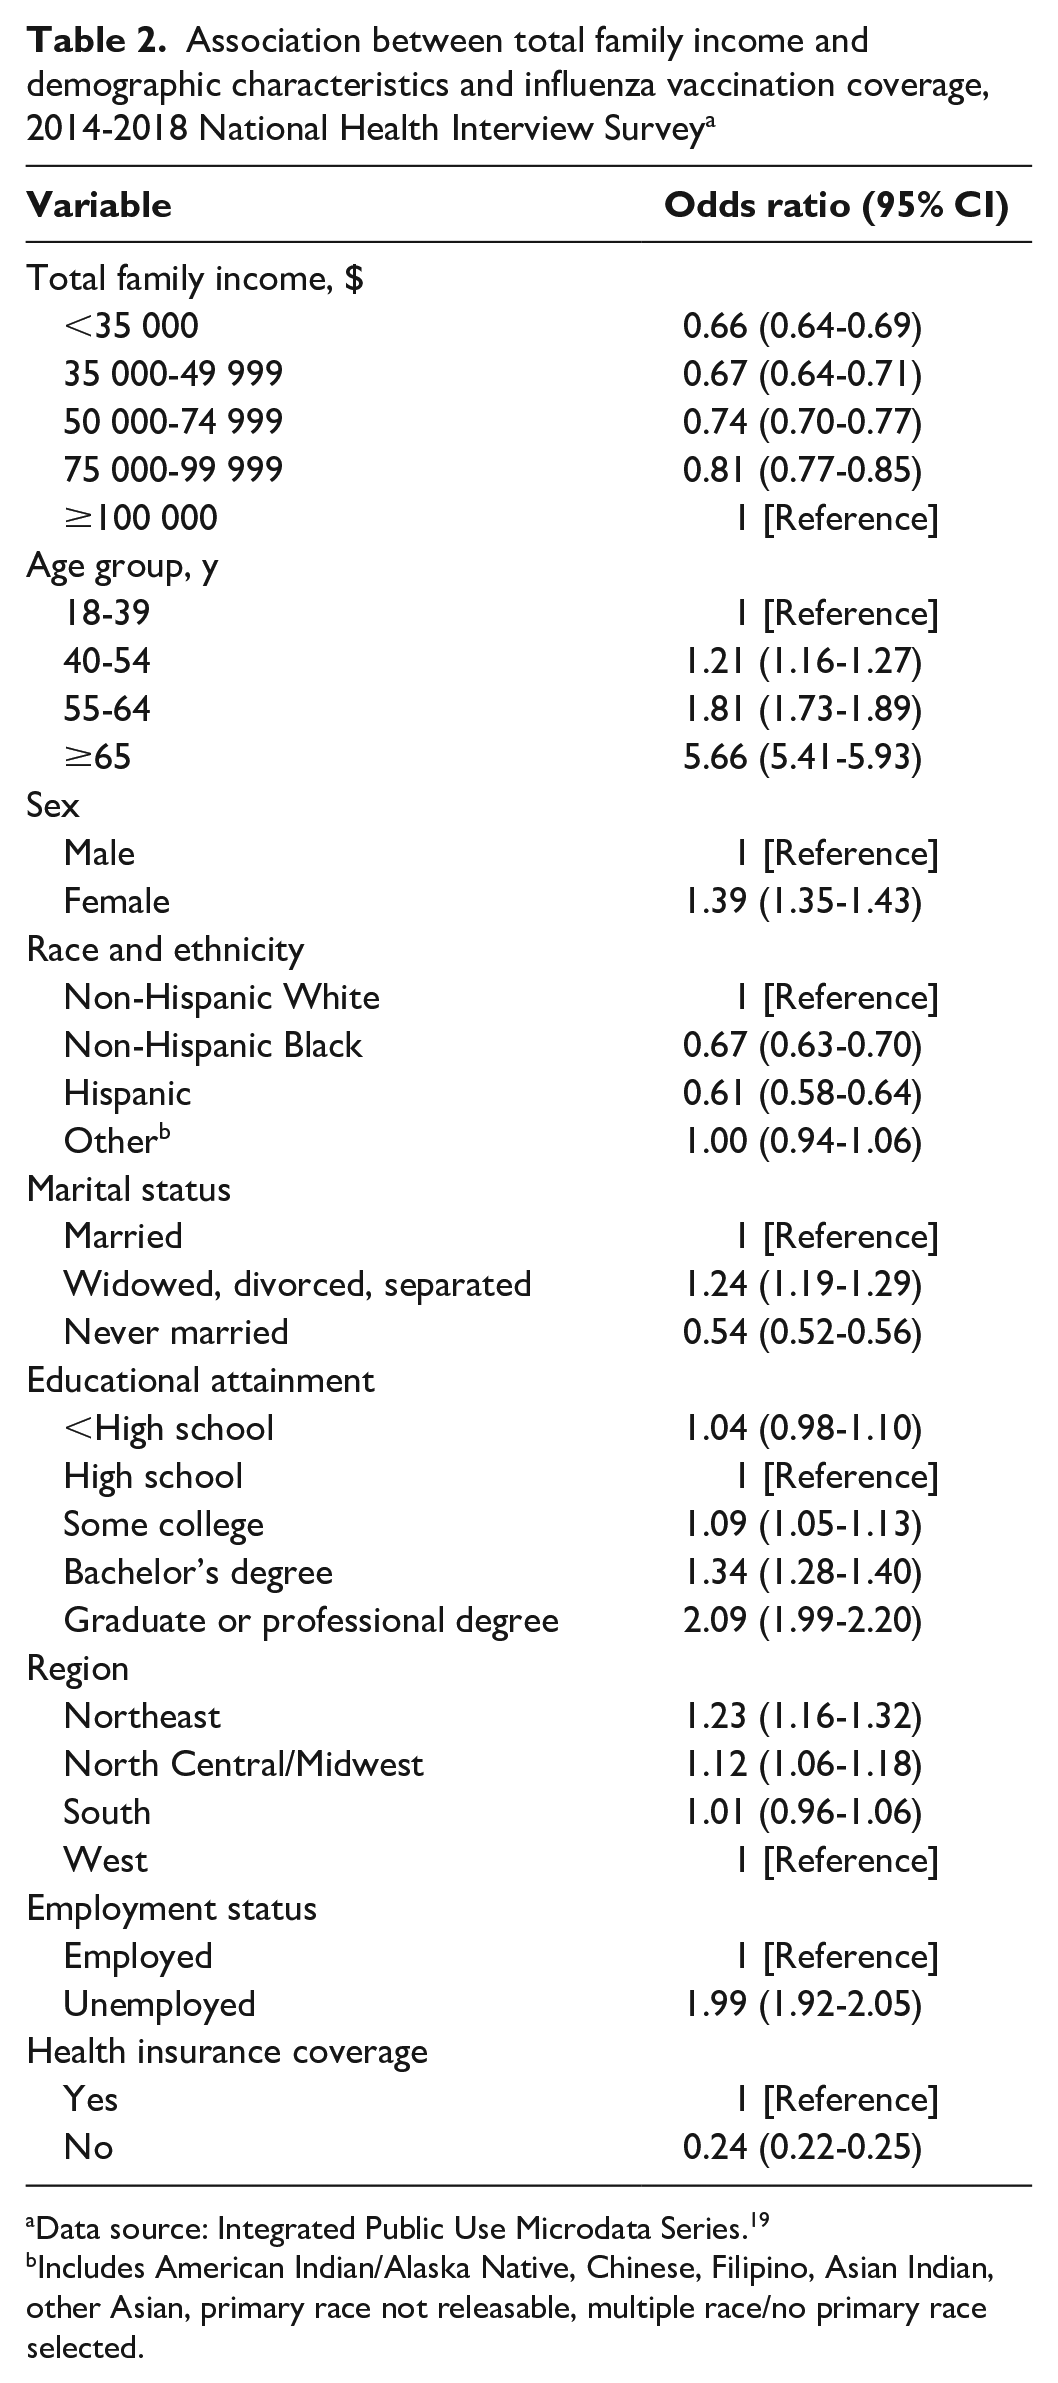
Data source: Integrated Public Use Microdata Series. 19
Includes American Indian/Alaska Native, Chinese, Filipino, Asian Indian, other Asian, primary race not releasable, multiple race/no primary race selected.
Study participants aged ≥65 years had more than a 5-fold increase in odds of receiving the influenza vaccine compared with study participants aged 18-39 years (OR = 5.66; 95% CI, 5.41-5.93). Female respondents also had increased odds of receiving the influenza vaccine compared with male respondents (OR = 1.39; 95% CI, 1.35-1.43).
After adjusting for sex, age, race and ethnicity, marital status, educational attainment, region, employment status, and health insurance coverage, the results were slightly attenuated but remained significant. When compared with study participants with a total family income ≥$100 000, the 2 lowest family income levels had approximately 20% decreased odds of receiving the influenza vaccine (<$35 000: aOR = 0.79 [95% CI, 0.75-0.83]; $35 000-$49 999: aOR = 0.80 [95% CI, 0.76-0.85]; Table 3). Study participants with a family income level of $50 000-$74 999 or $75 000-$99 999 also had significantly decreased odds of receiving the influenza vaccine ($50 000-$74 999: aOR = 0.83 [95% CI, 0.79-0.87]; $75 000-$99 999: aOR = 0.83 [95% CI, 0.79-0.87]).
Association between total family income and influenza vaccination coverage, 2014-2018 National Health Interview Survey a
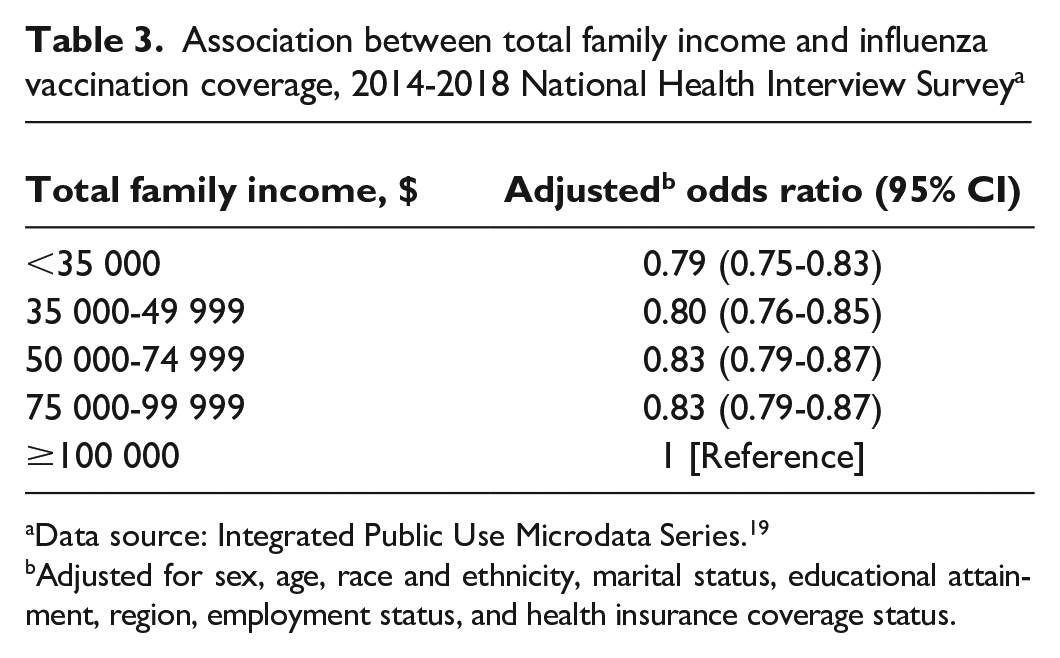
Data source: Integrated Public Use Microdata Series. 19
Adjusted for sex, age, race and ethnicity, marital status, educational attainment, region, employment status, and health insurance coverage status.
Discussion
In this population-based study of US adults, study participants with a total family income <$100 000 had significantly decreased odds, compared with participants with a total family income ≥$100 000, of receiving the influenza vaccine after adjustment for confounders. Existing literature examining the relationship between income and influenza vaccination for adults living in the United States is limited.8,10-12 Studies that measured income using the FPL found significant associations between influenza vaccination coverage and income, which is consistent with the findings of our study.8,10,12 However, our findings were inconsistent with results of the study by Lu et al. 11 That study measured income using similar methods to those used in our study, but it did not find any significant associations between influenza vaccination coverage and income. 11 This discrepancy could be due to differences in the categorization of income. For example, our study used total family income ≥$100 000 as the referent group, whereas Lu et al considered <$35 000 to be the referent group. 11 Furthermore, Lu et al designated >$75 000 as their highest income category, whereas we further granulated income categories. 11 Regardless, the fundamental cause theory supports the findings of our study. As a result, an unequal distribution of influenza vaccinations would likely favor individuals with the highest income levels. 17
Limitations and Strengths
This study had several limitations. First, although many potential confounders were included in this research, the study was limited to the questions asked in NHIS. Thus, uncontrolled confounding cannot be ruled out. Second, selection bias was possible because not all eligible individuals participated in the survey; response rates for the years included in the study ranged from 53.1% to 58.9%. However, selection bias is not generally a concern for large, population-based cross-sectional studies such as the NHIS. Third, given that study participants self-reported whether they had received the influenza vaccine, nondifferential misclassification of the outcome may have occurred. Participants may have forgotten the exact timing of their influenza vaccine or responded affirmatively because of social desirability bias. Fourth, nondifferential misclassification of the exposure was also possible because participants may have misreported their income. Because NHIS interviewers are well trained and use standardized procedures, information bias is unlikely.
Our study also had several strengths. First, it addressed a gap in the existing research by examining the relationship between income and influenza vaccination among adults in the United States. Much of the previous literature on influenza vaccination and income was either conducted outside the United States or studied children.13,14,24,25 Second, income was categorized in a way that allowed for individual-level analysis. Previous studies that examined disparities in influenza vaccination coverage at a national, state, county, or community level were not able to provide individual-level analysis.12,16-18 A few previous studies measured income and influenza vaccination coverage at the individual level, but they used the FPL to define their various income categories.8,10,12 However, the FPL is outdated and flawed. 16 Third, compared with previous literature that relied on the FPL, our study was able to better categorize various levels of income. 16 This categorization was important because the associations between influenza vaccination coverage and income vary, depending on the measure of income used in the study. 24 Fourth, because of the quality of the NHIS data and the large sample size, our findings may be generalizable to the larger US adult population. However, the findings may not be generalizable to people who are residing in long-term care institutions or correctional facilities or people who are transient or experiencing homelessness and do not live in a shelter, because the NHIS does not include these populations. 18
Conclusions
Our study found an association between income and influenza vaccination coverage. Adults with a total family income <$100 000 had nearly 20% decreased odds of receiving the influenza vaccination compared with adults with a total family income ≥$100 000. Economic stability is a key component to the social determinants of health, and income has been shown to be a factor in ensuring widespread influenza vaccination coverage throughout the nation.8,10,12,26,27 Based on the findings of the existing literature and our present study, equal distribution and receipt of influenza vaccinations across income groups needs to be considered a public health priority.8,10,12 Lower-income adults should be considered for improved and increased vaccination efforts.8,10,12
In addition to income, other determinants of health—such as education, race and ethnicity, cultural values, health literacy, and trust of the health care system—also contribute to receipt of the influenza vaccine. Health care use, perceived risk, and personal experience all provide additional barriers to influenza vaccination coverage in the United States.26,28 Influenza coverage rates can be hindered when people believe the influenza vaccine is ineffective or do not view influenza as a serious health threat.26,28 Such misconceptions about the influenza vaccine have proven to be a substantial barrier for increasing influenza vaccine uptake.26,28 Future research should explore these potential social and behavioral barriers in lower-income populations to develop effective interventions that will increase influenza vaccination coverage rates.
Footnotes
Declaration of Conflicting Interests
The authors declared no potential conflicts of interest with respect to the research, authorship, and/or publication of this article.
Funding
The authors received no financial support for the research, authorship, and/or publication of this article.