
Abstract
Objective
Understanding the pattern of population risk for coronavirus disease 2019 (COVID-19) is critically important for health systems and policy makers. The objective of this study was to describe the association between neighborhood factors and number of COVID-19 cases. We hypothesized an association between disadvantaged neighborhoods and clusters of COVID-19 cases.
Methods
We analyzed data on patients presenting to a large health care system in Boston during February 5–May 4, 2020. We used a bivariate local join-count procedure to determine colocation between census tracts with high rates of neighborhood demographic characteristics (eg, Hispanic race/ethnicity) and measures of disadvantage (eg, health insurance status) and COVID-19 cases. We used negative binomial models to assess independent associations between neighborhood factors and the incidence of COVID-19.
Results
A total of 9898 COVID-19 patients were in the cohort. The overall crude incidence in the study area was 32 cases per 10 000 population, and the adjusted incidence per census tract ranged from 2 to 405 per 10 000 population. We found significant colocation of several neighborhood factors and the top quintile of cases: percentage of population that was Hispanic, non-Hispanic Black, without health insurance, receiving Supplemental Nutrition Assistance Program benefits, and living in poverty. Factors associated with increased incidence of COVID-19 included percentage of population that is Hispanic (incidence rate ratio [IRR] = 1.25; 95% CI, 1.23-1.28) and percentage of households living in poverty (IRR = 1.25; 95% CI, 1.19-1.32).
Conclusions
We found a significant association between neighborhoods with high rates of disadvantage and COVID-19. Policy makers need to consider these health inequities when responding to the pandemic and planning for subsequent health needs.
Coronavirus disease 2019 (COVID-19) continues to spread rapidly in the United States 1 with severe consequences. 2 Evidence suggests that the pandemic has had heterogenous effects on communities and a significantly worse effect on racial/ethnic minority populations than on non–racial/ethnic minority populations. Among states and cities reporting data on race/ethnicity, the relative risks (RRs) of death for Black (RR = 3.57; 95% CI, 2.84-4.48) and Hispanic (RR = 1.88; 95% CI, 1.61-2.19) patients were significantly higher than for White patients. 3 In a large hospital system in California, African American patients were reported to have significantly higher odds of hospitalization than non-Hispanic White patients, even after adjusting for age, sex, comorbidities, and income. 4 In Louisiana, approximately one-third of the population is Black, but Black patients accounted for more than half of COVID-19 deaths as of May 2020. 5
Although these disparities are likely due to a combination of factors (including differences in health care access, ability to socially isolate, and underlying comorbidities), 6 geography is an important and understudied risk factor. Geographic or place-based data can improve our understanding of health disparities and the development of effective interventions to reduce them. 7 Geographic context can represent both protective factors 8 and neighborhood challenges. 7,9,10 The history of residential segregation and the resultant clustering of Black and Hispanic communities into neighborhoods with more crowding, higher rates of poverty, and limited transportation may help to explain part of the higher disease prevalence and mortality that have been reported for Black and Hispanic patients as compared with White patients. 6
In addition, data from New York City showed the highest rates of hospitalization and death in the Bronx, which is also the borough with the highest percentage of racial/ethnic minority groups and the most people living in poverty. 11 The associations among disease incidence, race/ethnicity, and geography are complicated by disparities in access to COVID-19 testing. For example, median travel time to testing sites is longer in counties with a higher percentage of people in racial/ethnic minority groups and uninsured people, 12 potentially contributing to delays in diagnosis and treatment that may be associated with poor outcomes, including increased disease spread during delays in diagnosis.
Understanding the pattern of population risk is important for health systems and policy makers responding to the pandemic. The objective of our study was to describe the spatial colocation and association between neighborhood factors and incident cases of COVID-19. We hypothesized an association between disadvantaged neighborhoods and clusters of COVID-19 cases. As a secondary analysis, we examined how our health system data compared with state data in the identification of spatial colocation to understand the sensitivity of our results. This secondary analysis is particularly important given that historical patterns of hospital use and continuing residential segregation affect the hospital to which patients present 13 and may limit the ability of single-system data to identify neighborhoods at risk of overlapping disadvantage and COVID-19.
Methods
Data Sources
We identified cases using Massachusetts General Brigham (MGB) emergency department and inpatient data and data from the Massachusetts Department of Public Health. We abstracted neighborhood data (neighborhood composition, poverty [census definition], health insurance, and Supplemental Nutrition Assistance Program [SNAP] benefits) from the US Census Bureau 2018 American Community Survey 5-year estimates 14 and the social vulnerability index (SVI) from the Centers for Disease Control and Prevention. 15,16 The SVI measures factors that can limit a community’s ability to respond to a disaster, including poverty, lack of access to transportation, and crowded housing. 15 Higher SVI scores correspond to increased vulnerability. For the SVI, we used the overall percentile ranking for 2018 at the census-tract level and examined 4 domains (socioeconomic, household composition, racial/ethnic minority status/language, and housing type/transportation) in quartiles. 17
Study Population
We included data on all patients presenting to MGB with confirmed COVID-19 from February 5 through May 4, 2020. We included patients with a mailing address located in a 20-mile radius from the 2 largest hospitals in the MGB system, because we were interested in understanding patterns in disparities in our local community and were concerned about the ability to identify colocation in areas with a small number of patients who may have traveled long distances for specialty care.
Statistical Analyses
The self-reported home address of patients presenting to MGB were geocoded to the census-tract level and mapped against community-level measures of need and disadvantage using ArcGIS version 10.7.1 (Esri). We conducted geocoding using ArcGIS with an address locator file based on the 2019 US Census TIGER/Line shapefiles. We hand-coded addresses that did not automatically match using coordinates obtained from Google Maps. For patient addresses listed as a post office box, we geocoded the address to the census tract of that zip code (when the zip code included only 1 census tract) or randomly assigned it to a census tract within that zip code. We successfully geocoded 99% of patients with a mailing address listed, including 128 addresses with a post office box, leaving 120 addresses that could not be matched automatically or by hand and an additional 50 addresses that indicated the patient was not currently domiciled.
We calculated the crude incidence rates of COVID-19 overall and per census tract using population estimates from the US Census Bureau. We also calculated adjusted incidence rates by using spatial empirical Bayes smoothing to account for small area estimation. 18 We identified census tracts in the top quintile of adjusted COVID-19 incidence rate and top quintile of each neighborhood factor. We then used a bivariate local join-count procedure, known as quantile local spatial autocorrelation, 19 to identify significant colocation of COVID-19 and each neighborhood factor. We determined significance by using pseudo P values using 999 permutations and a false-discovery rate correction.
To further describe the association between neighborhood factors and cases of COVID-19, we used negative binomial regression models, using the outcome of case counts per census tract and denominator of total population. Because our objective was to identify colocation—and not to present an explanatory model for COVID-19 incidence nor to assess the independent effect of 1 neighborhood factor (eg, race/ethnicity) adjusting for another (eg, poverty)—we present unadjusted incidence rate ratios (IRRs).
As a sensitivity analysis, to address potential concern about the use of single health system data undercounting cases, we repeated the analysis to identify colocation at the city/town level using both MGB data and published COVID-19 case counts from the Massachusetts Department of Public Health. We conducted analyses in ArcGIS, GeoDa 1.14 (Center for Spatial Data Science), and Stata IC version 15.1 (StataCorp). This study was approved by the MGB (formerly Partners) Institutional Review Board.
Results
A total of 11 981 COVID-19 patients were treated in the MGB system during the study period, 9898 of whom were in the study area. The mean age was 51 years, 5259 (53%) patients were female, 3537 (36%) patients were non-Hispanic White, 1473 (15%) patients were non-Hispanic Black, and 2745 (28%) patients were Hispanic (Table 1). The number of positive test results per week peaked during weeks 11 and 12 (April 12-25, 2020). The overall crude incidence of COVID-19 was 32 cases per 10 000 population; the adjusted incidence per census tract ranged from 2 to 405 per 10 000 population.
Demographic characteristics of patients who received a positive test result for COVID-19 in the study area (N = 9898), Massachusetts General Brigham, Boston, February 5–May 4, 2020 a
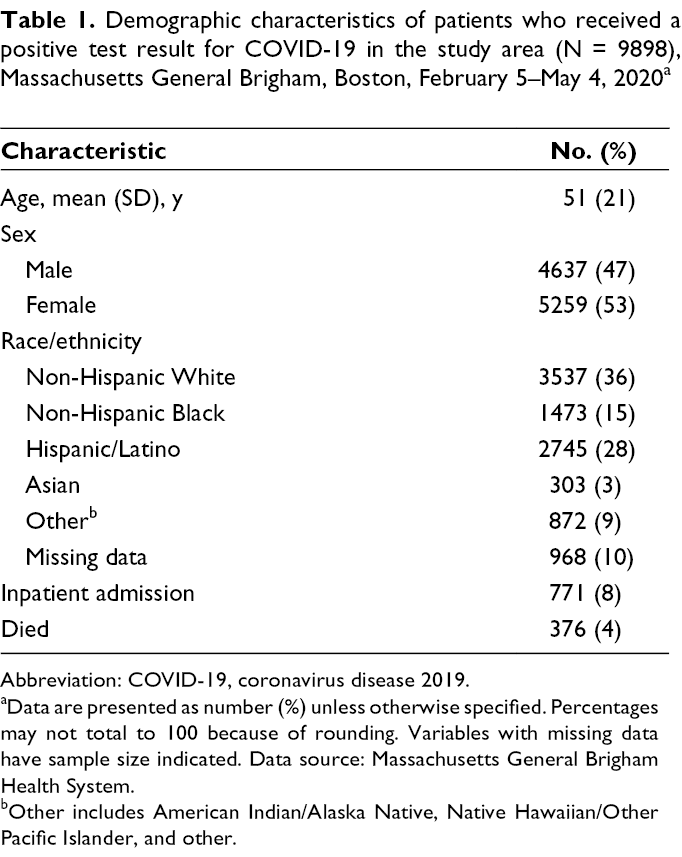
Abbreviation: COVID-19, coronavirus disease 2019.
aData are presented as number (%) unless otherwise specified. Percentages may not total to 100 because of rounding. Variables with missing data have sample size indicated. Data source: Massachusetts General Brigham Health System.
bOther includes American Indian/Alaska Native, Native Hawaiian/Other Pacific Islander, and other.
We found extensive overlap between neighborhood factors (poverty, SNAP use, non-Hispanic Black race, Hispanic ethnicity) and COVID-19 cases (Figure 1). In the MGB data at the census-tract level, we found significant colocation of several neighborhood factors and the top quintile of COVID-19 cases (all P < .05): percentage of population Hispanic (n = 72 census tracts), non-Hispanic Black (n = 36), uninsured (n = 33), receiving SNAP benefits (n = 39), and living in poverty (n = 23) (Figure 2). In the negative binomial regression models, the percentage of the population that was non-Hispanic Black, Hispanic, without health insurance, receiving SNAP benefits, or living in poverty, as well as all components of the SVI, were significantly associated with an increased incidence of COVID-19 (Table 2).
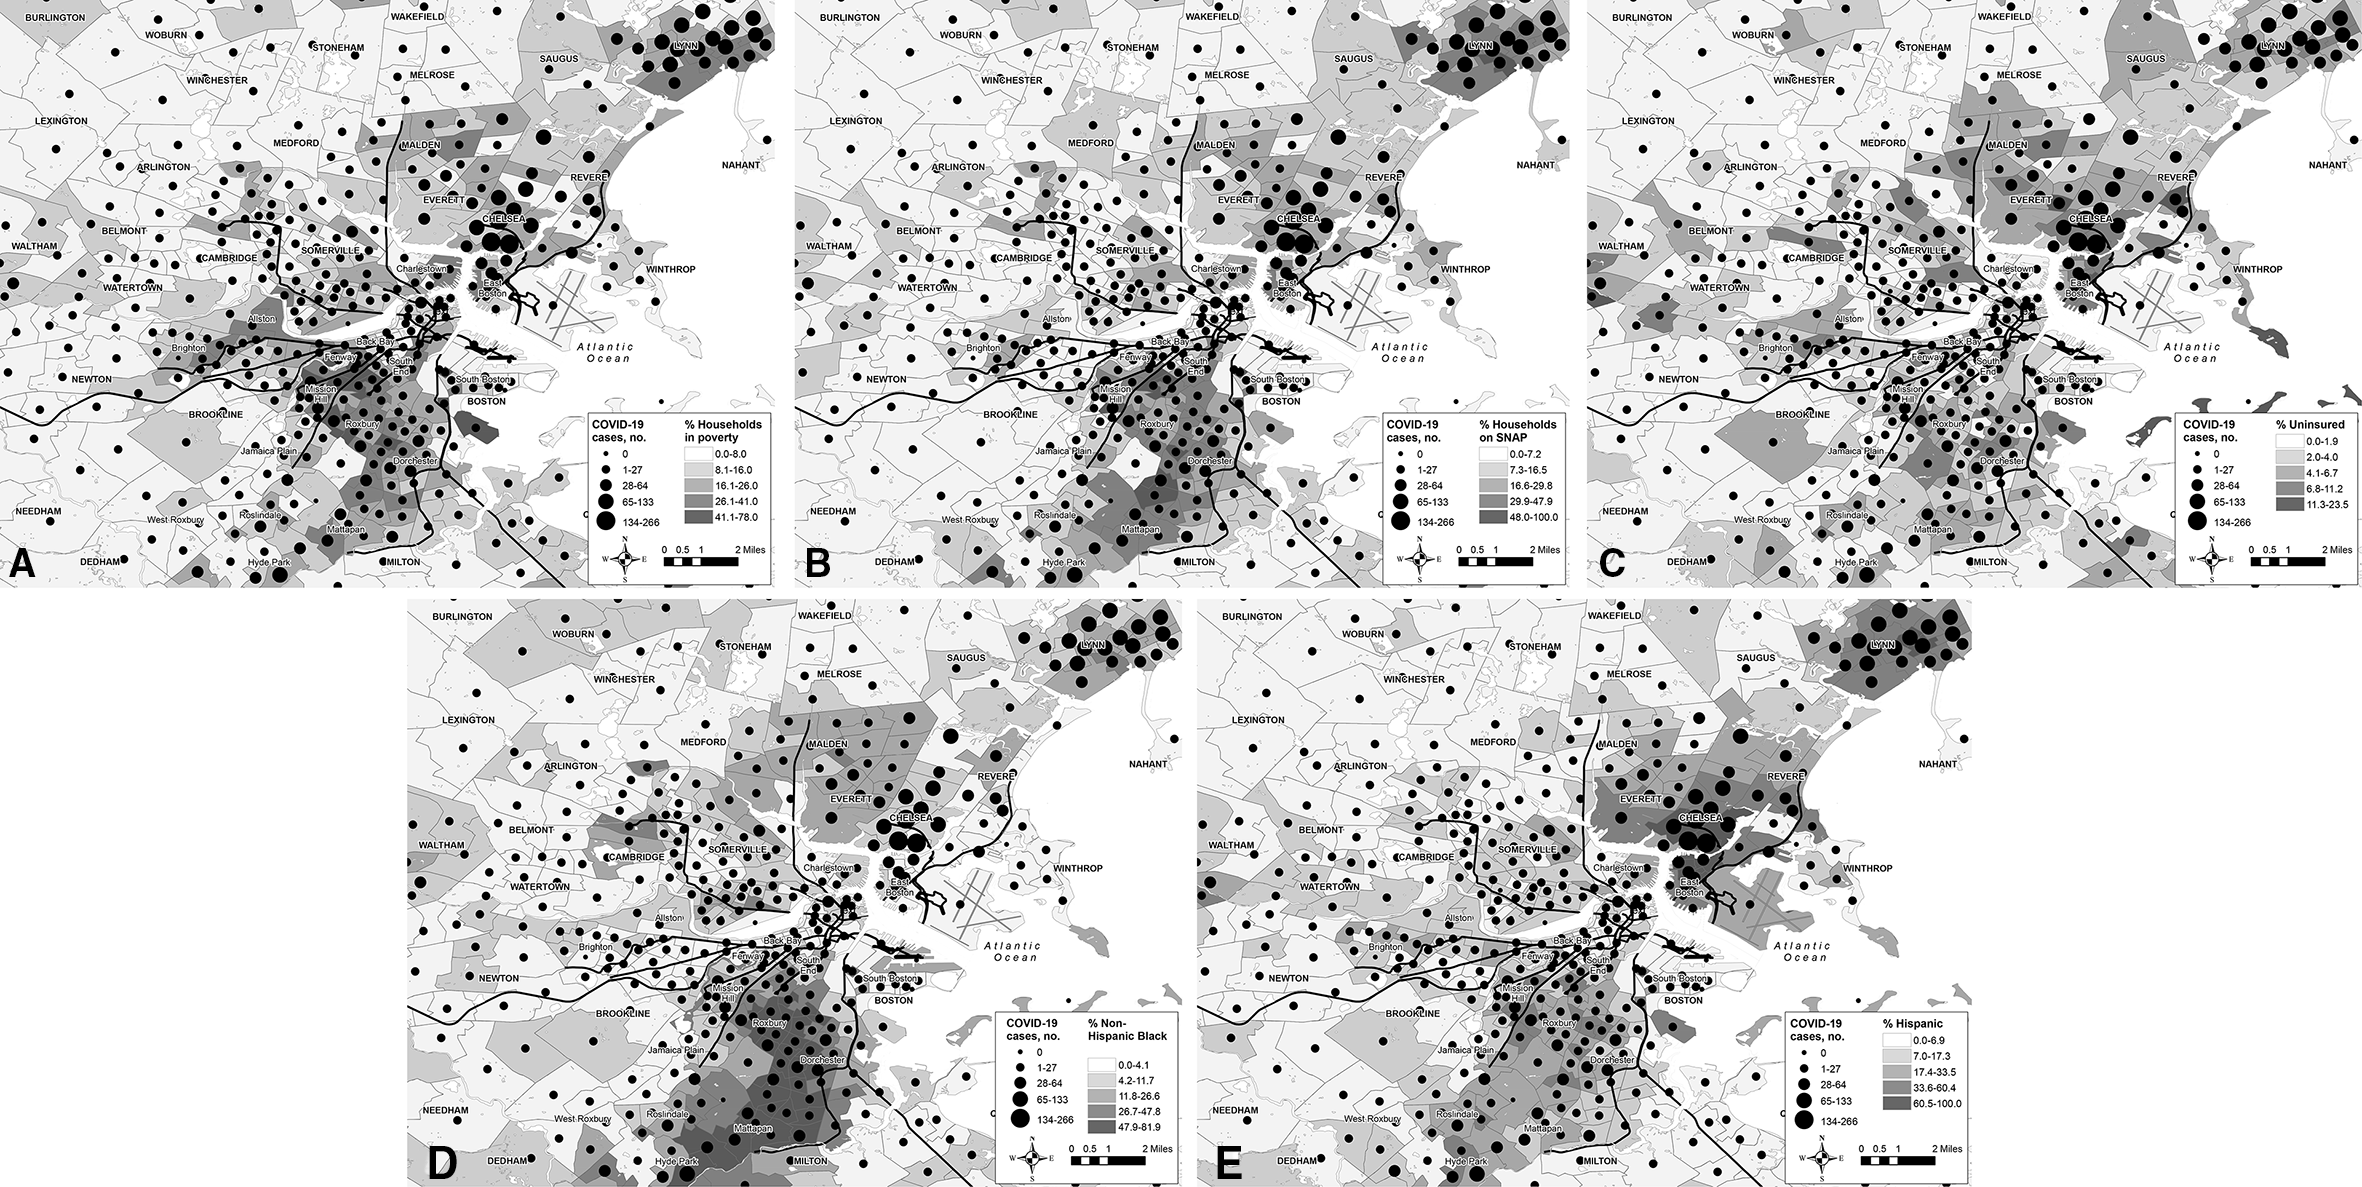
Relationship between neighborhood factors and coronavirus disease 2019 (COVID-19) cases presenting to Massachusetts General Brigham, Boston, February 5–May 4, 2020. (
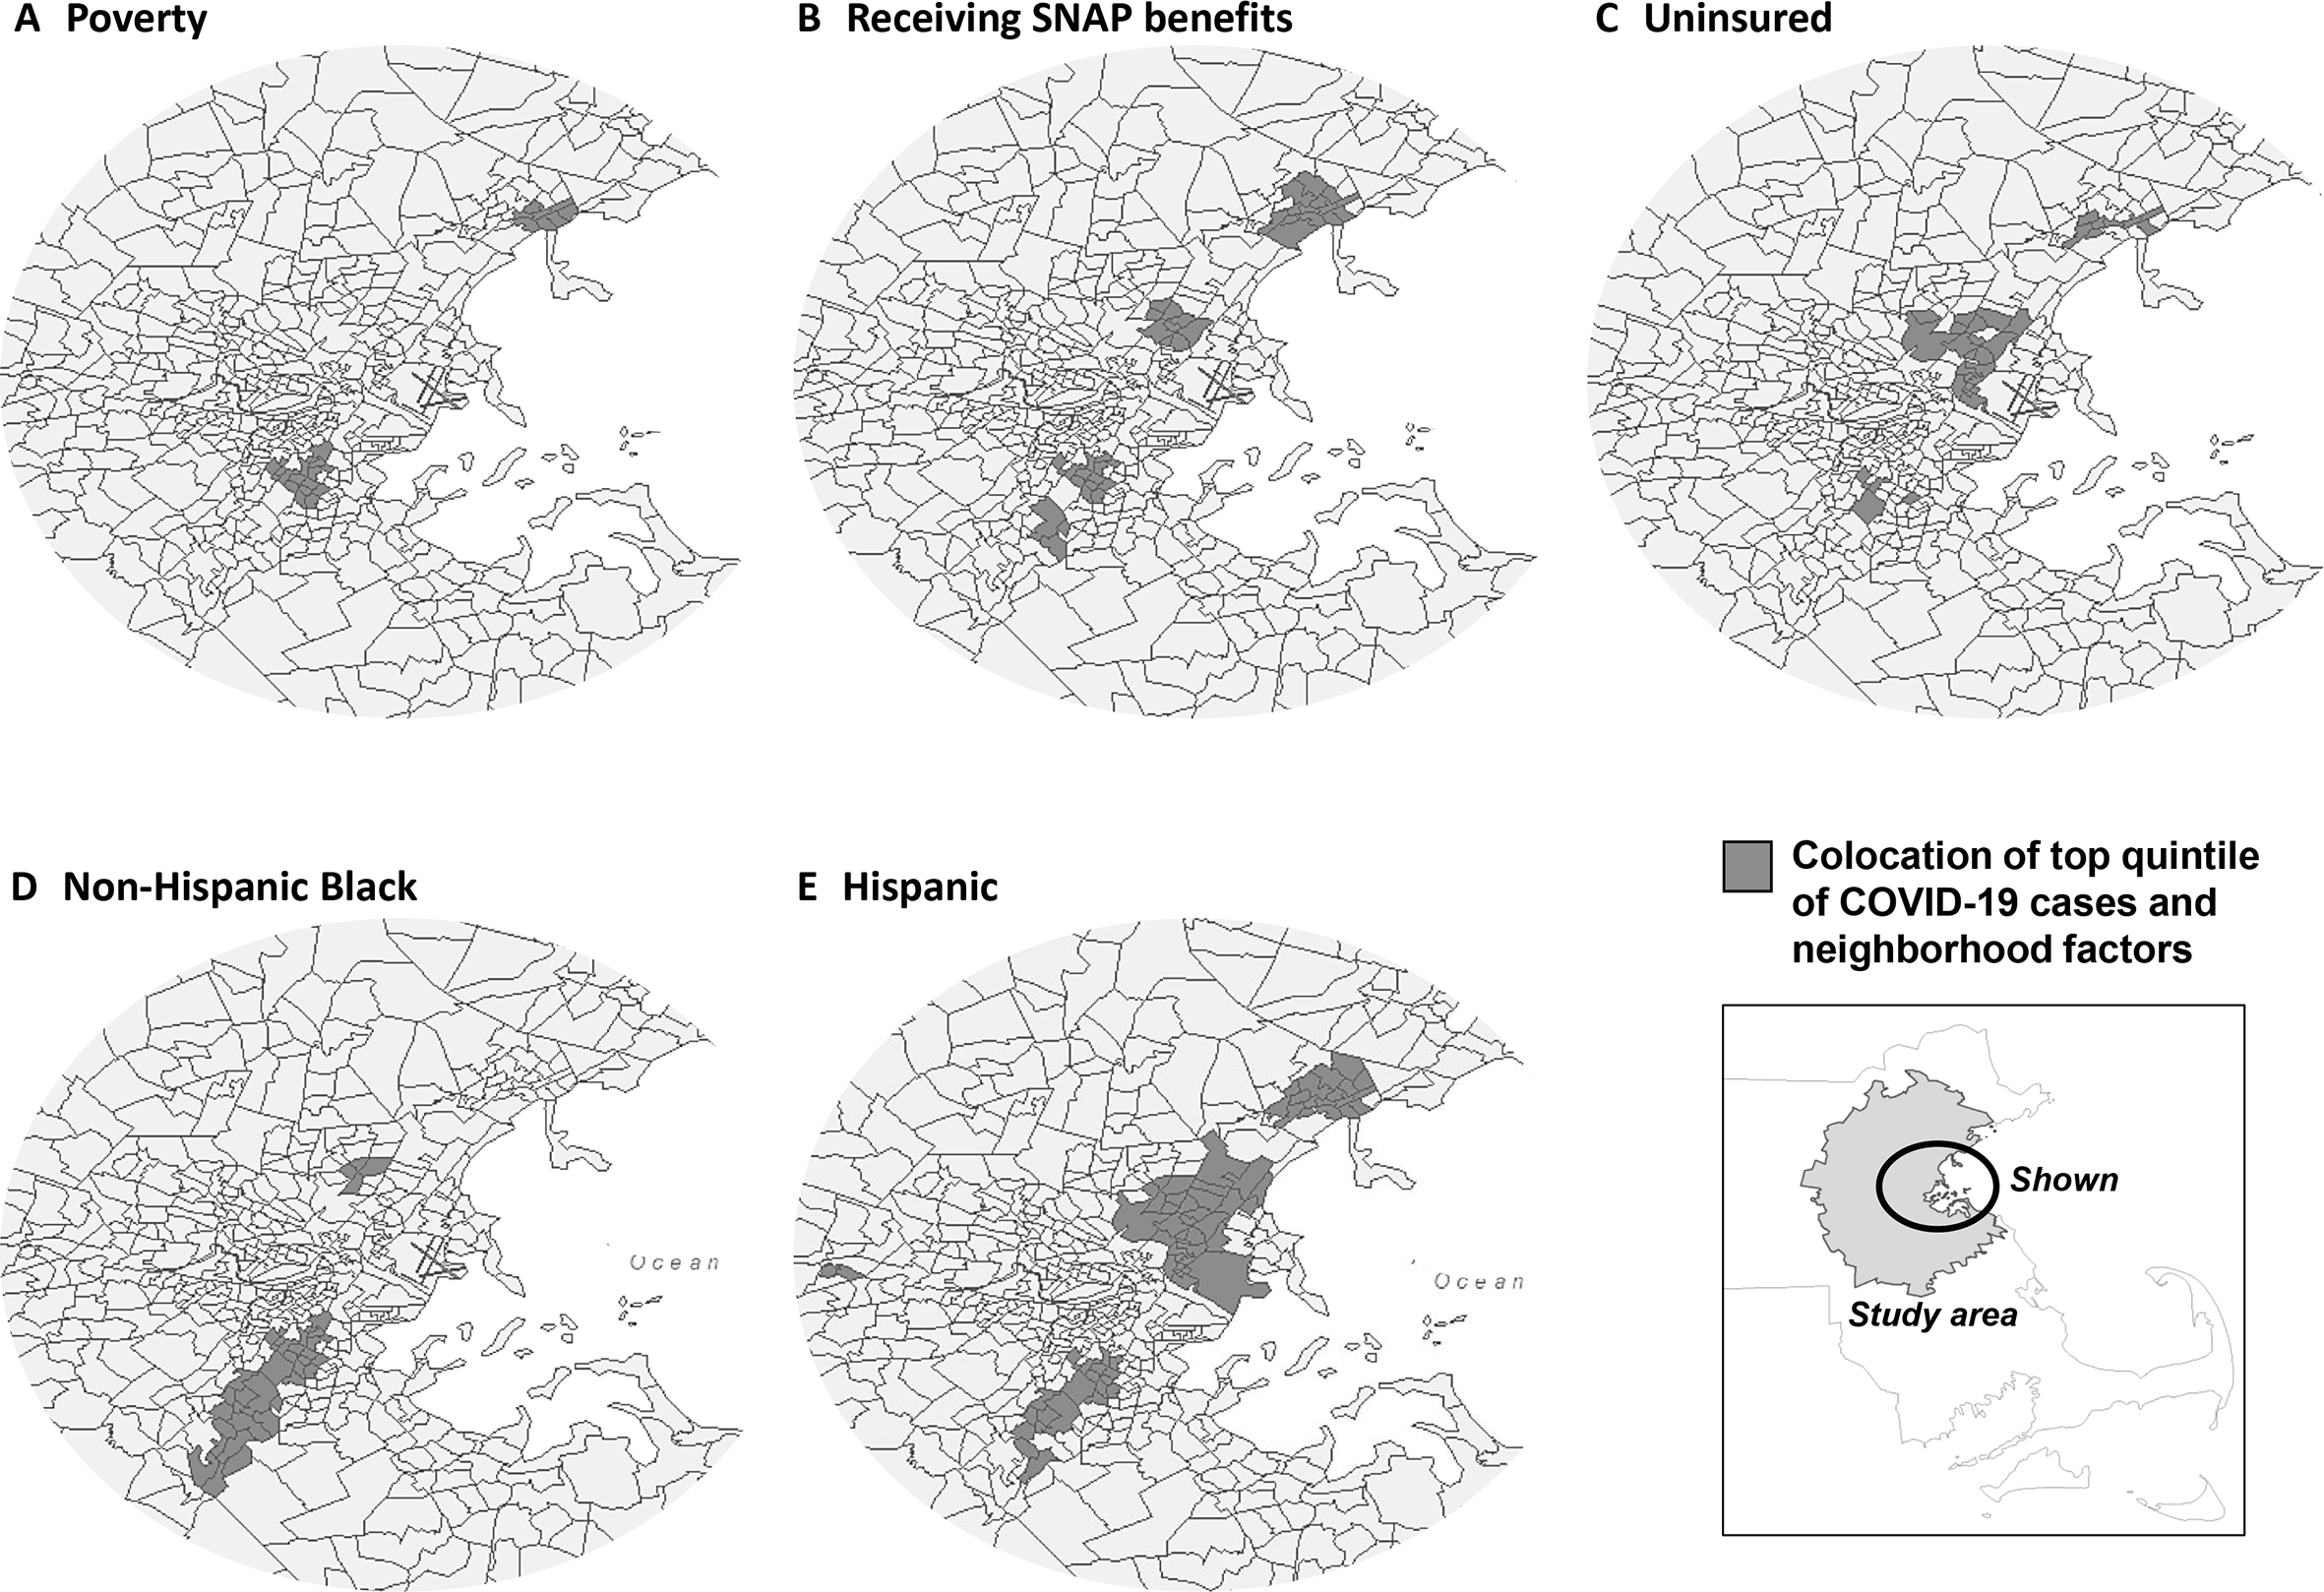
Relationship between the top quintile (highest percentage) of neighborhood factors and the top quintile (the greatest number) of COVID-19 cases presenting to Massachusetts General Brigham, Boston, February 5–May 4, 2020. Abbreviations: COVID-19, coronavirus disease 2019; SNAP, Supplemental Nutrition Assistance Program. Data sources: Massachusetts General Brigham and American Community Survey. 14
Associations between neighborhood demographic characteristics and measures of disadvantage and incidence rate ratios of COVID-19 cases presenting to Massachusetts General Brigham, Boston, February 5–May 4, 2020 a
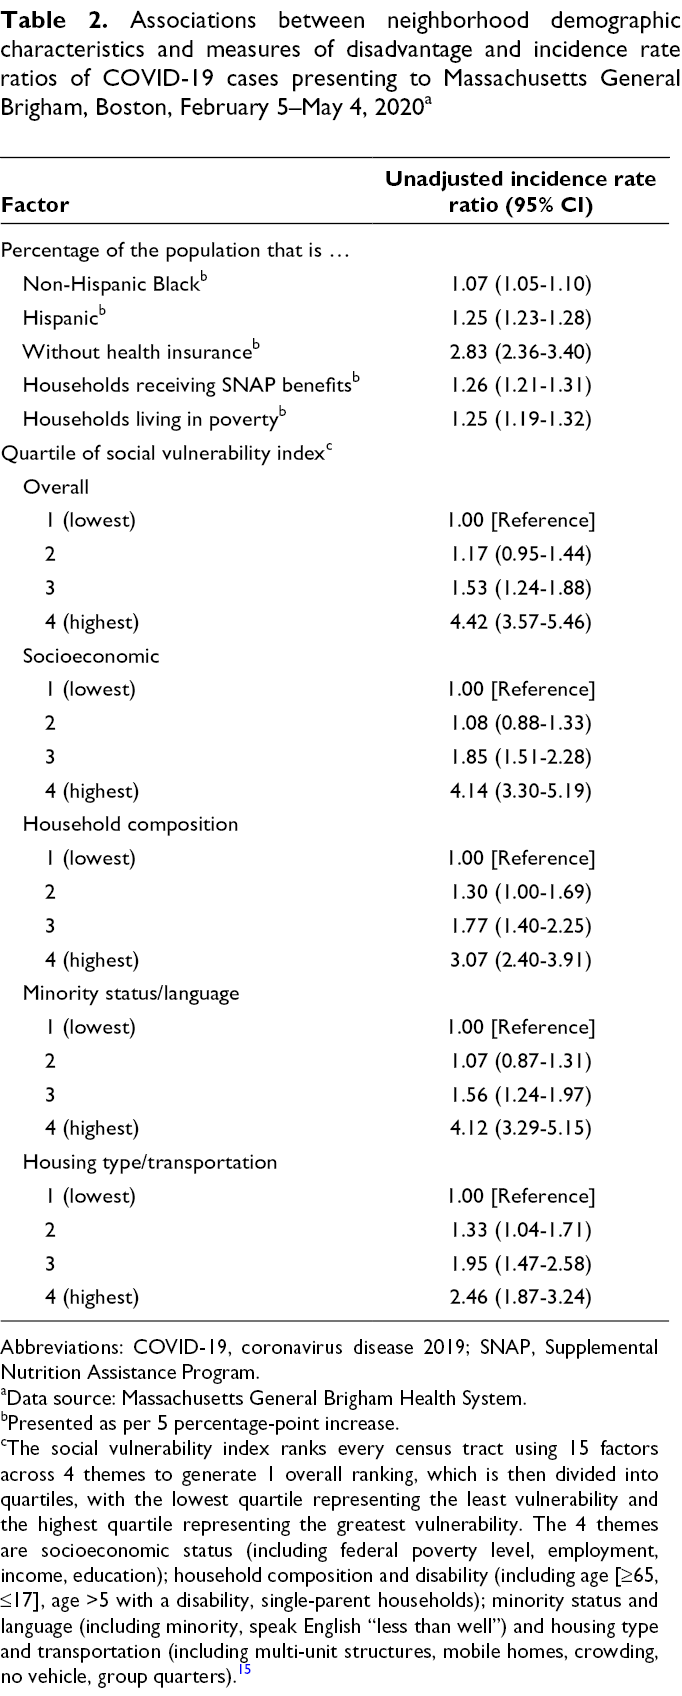
Abbreviations: COVID-19, coronavirus disease 2019; SNAP, Supplemental Nutrition Assistance Program.
aData source: Massachusetts General Brigham Health System.
bPresented as per 5 percentage-point increase.
cThe social vulnerability index ranks every census tract using 15 factors across 4 themes to generate 1 overall ranking, which is then divided into quartiles, with the lowest quartile representing the least vulnerability and the highest quartile representing the greatest vulnerability. The 4 themes are socioeconomic status (including federal poverty level, employment, income, education); household composition and disability (including age [≥65, ≤17], age >5 with a disability, single-parent households); minority status and language (including minority, speak English “less than well”) and housing type and transportation (including multi-unit structures, mobile homes, crowding, no vehicle, group quarters). 15
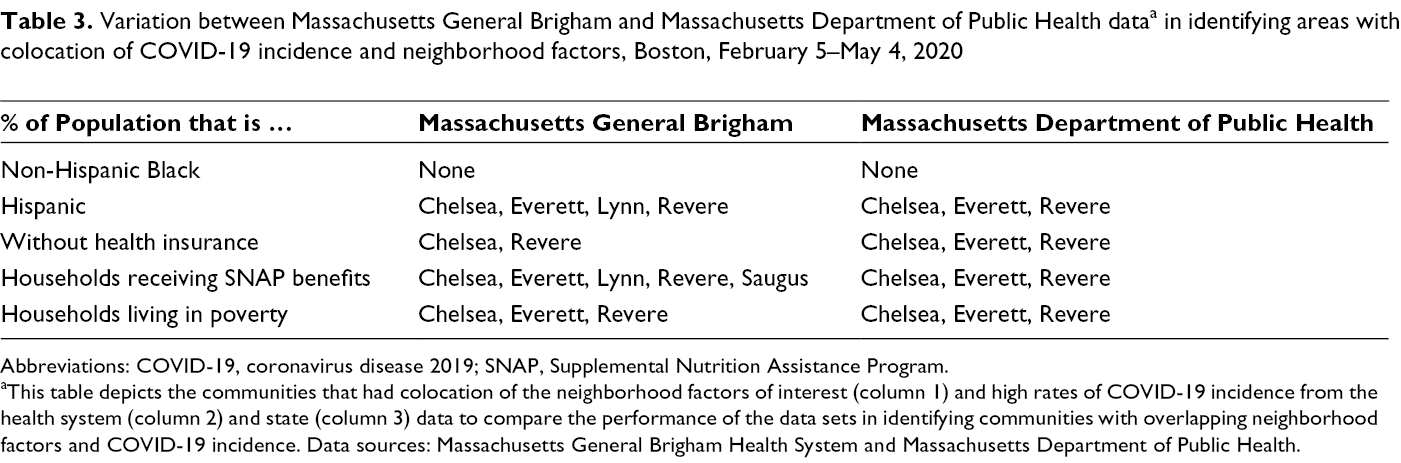
In our sensitivity analysis using both MGB and Massachusetts Department of Public Health data on COVID-19 incidence at the city/town level, we found that the MGB data identified most areas north of Boston that were also in the top quintile of Massachusetts data (Table 3). The colocation analysis of neighborhood factors and COVID-19 cases agreed for most identified areas, with a few exceptions. For example, the MGB data did not identify 1 of the colocations of uninsured that was found in the state data, but the MGB data identified additional census tracts north of Boston with significant colocation that were not seen in the state data. Notably, neither the state data nor the MGB data at the city/town level found significant colocation in any area for percentage of population that is non-Hispanic Black and COVID-19 incidence.
Variation between Massachusetts General Brigham and Massachusetts Department of Public Health data a in identifying areas with colocation of COVID-19 incidence and neighborhood factors, Boston, February 5–May 4, 2020
Abbreviations: COVID-19, coronavirus disease 2019; SNAP, Supplemental Nutrition Assistance Program.
aThis table depicts the communities that had colocation of the neighborhood factors of interest (column 1) and high rates of COVID-19 incidence from the health system (column 2) and state (column 3) data to compare the performance of the data sets in identifying communities with overlapping neighborhood factors and COVID-19 incidence. Data sources: Massachusetts General Brigham Health System and Massachusetts Department of Public Health.
Discussion
Using data from a large, integrated health system in greater Boston, we identified significant colocation of cases with certain neighborhood characteristics, including percentage Hispanic, non-Hispanic Black, without health insurance, receiving SNAP benefits, and living in poverty. The proportion of Hispanic population and households receiving SNAP benefits remained significantly associated with increased incidence of COVID-19 in the adjusted model.
Previous studies reported higher rates of hospitalization and death from COVID-19 among Black and Hispanic patients 3 -5 as compared with White patients and in communities with high percentages of racial/ethnic minority groups and the most people living in poverty. 11 Similar to our finding of high incidence of COVID-19 in Hispanic communities, data from the largest MGB hospital (Massachusetts General Hospital) demonstrated that approximately 29%-35% of patients required interpreter services (primarily for Spanish interpretation) during the height of the COVID-19 surge (ie, spring 2020), compared with 9% at baseline (pre–COVID-19). 20 Our work builds on this foundation to demonstrate these disparities across the disease spectrum among all patients who had a positive test result for COVID-19, not just people requiring hospitalization. That these differences were found despite known disparities in accessing testing 12 suggests that these results may be underestimating the disparities in COVID-19 incidence.
Of note, we were able to conduct the sensitivity analysis only at the city/town level given the available state data. However, despite the different geographic scale (city/town vs zip code), we identified similar clusters using the single-system MGB data, suggesting that our health system data can be used to identify disease clusters and communities at overlapping risk from socioeconomic factors and COVID-19. In addition, the more granular MGB data were able to identify colocation for neighborhood factors, such as percentage non-Hispanic Black, that were not able to be identified at the city/town level.
Overall, these data show significant disparities in COVID-19 incidence across census tracts. They demonstrate that even data from a single health system can help to identify communities at high risk of disease and with need for additional support during recovery. Future work will focus on identifying the interplay between individual and neighborhood factors in determining COVID-19 risk, elucidating long-term effects on neighborhoods and communities, and developing strategies to mitigate adverse outcomes from both COVID-19 and the resultant economic consequences.
Limitations
This study had several limitations. First, we report data from only 1 health care system, which may limit the generalizability of our results based on the characteristics of patients identified in our sample. However, our data are from a large, geographically dispersed health care system, and Massachusetts General Hospital, one of the MGB hospitals, took care of the largest number of admitted COVID-19 patients in the region, 21 -23 improving the generalizability and external validity of the results. Second, because of the geographic focus, we did not capture rural–urban disparities in this database, and those disparities require further investigation. 24 Third, because of historical patterns of hospital usage and ongoing residential segregation in Boston, the MGB system cares for a lower percentage of non-Hispanic Black patients than might be expected based on Boston city demographic characteristics, 13 potentially limiting our ability to identify neighborhoods with high concentrations of COVID-19 cases among patients who are non-Hispanic Black.
Fourth, the identification of patients based on test results is limited by disparities in access to testing. We have work in place to use symptom-based surveillance to better understand the population of patients with disease. In addition, we were unable to adjust for other factors that potentially contribute to COVID-19 disease and severity, including age and underlying medical conditions, 25 although it is important to note that significant disparities also exist in race/ethnicity and socioeconomic status in underlying medical conditions. 26 Fifth, the use of census data for assessment of neighborhood vulnerability may undercount populations such as undocumented immigrants and those without a permanent address. Finally, the state data were available only at the city/town level; as such, the spatial resolution was limited.
Conclusion
We found a significant association between measures of neighborhood disadvantage and high incidence rates of COVID-19. Limitations include case ascertainment challenges due to access to testing and possible limitations in generalizability from the use of a single health care system. These results suggest that policy makers need to consider these health inequities when responding to the pandemic and planning for health needs.
Footnotes
Declaration of Conflicting Interests
The authors declared no potential conflicts of interest with respect to the research, authorship, and/or publication of this article.
Funding
The authors disclosed receipt of the following financial support for the research, authorship, and/or publication of this article: Dr. Samuels-Kalow is supported by the Harvard Catalyst | The Harvard Clinical and Translational Science Center (National Center for Advancing Translational Sciences, National Institutes of Health Award UL 1TR002541) and financial contributions from Harvard University and its affiliated academic health care centers. The content of this article is solely the responsibility of the authors and does not necessarily represent the official views of Harvard Catalyst, Harvard University and its affiliated academic health care centers, or the National Institutes of Health.