
Abstract
Introduction:
Pediatric tuberculosis (TB) cases are sentinel events for Mycobacterium tuberculosis transmission in communities because children, by definition, must have been infected relatively recently. However, these events are not consistently identified by genotype-dependent surveillance alerting methods because many pediatric TB cases are not culture-positive, a prerequisite for genotyping.
Methods:
We developed 3 potential indicators of ongoing TB transmission based on identifying counties in the United States with relatively high pediatric (aged <15 years) TB incidence: (1) a case proportion indicator: an above-average proportion of pediatric TB cases among all TB cases; (2) a case rate indicator: an above-average pediatric TB case rate; and (3) a statistical model indicator: a statistical model based on a significant increase in pediatric TB cases from the previous 8-quarter moving average.
Results:
Of the 249 US counties reporting ≥2 pediatric TB cases during 2009-2017, 240 and 249 counties were identified by the case proportion and case rate indicators, respectively. The statistical model indicator identified 40 counties with a significant increase in the number of pediatric TB cases. We compared results from the 3 indicators with an independently generated list of 91 likely transmission events involving ≥2 pediatric cases (ie, known TB outbreaks or case clusters with reported epidemiologic links). All counties with likely transmission events involving multiple pediatric cases were identified by ≥1 indicator; 23 were identified by all 3 indicators.
Practice Implications:
This retrospective analysis demonstrates the feasibility of using routine TB surveillance data to identify counties where ongoing TB transmission might be occurring, even in the absence of available genotyping data.
Despite the relatively low incidence of tuberculosis (TB) in the United States, TB outbreaks produce considerable TB-associated morbidity.1 -3 TB outbreaks occur when more cases are documented in a population during a specified period than would be expected. These additional cases are presumably the result of ongoing Mycobacterium tuberculosis transmission among people in the affected community, generally within the previous 2 years, which is referred to as recent TB transmission. 4 Although fewer than 20% of TB cases in the United States are attributed to recent transmission, 5 prompt identification of cases that might be related by recent transmission can lead to rapid public health intervention to interrupt TB transmission, reduce TB-associated morbidity, and end outbreaks.
Genotyping is used to help identify temporospatial clusters of TB cases that might be the result of recent transmission.2,6 -8 Since 2004, the National Tuberculosis Genotyping Service (NTGS) has routinely genotyped at least 1 M tuberculosis isolate from each culture-confirmed case reported in the United States. 6 The Tuberculosis Genotyping Information Management System (TB GIMS), a secure, online, molecular surveillance database that integrates TB patient surveillance records with M tuberculosis genotyping results from NTGS, alerts TB control programs and the Centers for Disease Control and Prevention (CDC) to clusters of geospatially and temporally concentrated cases with matching genotypes. This molecular surveillance approach can identify potential TB outbreaks through related cases that would not otherwise be identified as related; however, this outbreak detection model requires a sufficient number of culture-positive and genotyped TB cases to successfully identify clusters that might represent outbreaks. Not all TB cases are culture-positive, however; among those that are, the time required to obtain an isolate, conduct genotyping, and link the genotyping result to the patient record in TB GIMS can sometimes add up to a months-long delay in identifying potential outbreaks. Accordingly, development of complementary approaches to outbreak detection that do not depend on genotyping is a public health priority.
TB cases diagnosed among children (pediatric TB cases) are considered sentinel events for recent TB transmission 9 because of children’s increased risk of developing TB disease relatively rapidly after infection 10 and their young age, which inherently limit periods of potential exposure. 11 However, because of the likelihood of paucibacillary disease and the difficulty in obtaining adequate diagnostic specimens from children, isolates are rarely obtained from TB cultures in pediatric cases. 12 Cases without culture isolates cannot be included in molecular surveillance because genotyping requires an isolate and cannot be conducted directly on clinical specimens. As such, these cases are not incorporated in the US genotype-dependent alerting system through TB GIMS.6,8 Accordingly, TB GIMS might fail to detect or might underestimate the size of clusters involving pediatric TB cases, resulting in missed opportunities for early outbreak detection and intervention. CDC and National Tuberculosis Controllers Association guidelines indicate that source-case investigations can be considered for all TB cases among children aged <5 years because of the likelihood that such cases represent recent transmission. 13 Detection of above-average incidence of pediatric TB cases in an area could provide an early indication of potential outbreaks.
We developed 3 indicators to identify counties with a relatively high incidence of pediatric TB cases during a defined period. To determine the feasibility of using these indicators as an alerting system, we examined the number of counties identified by each indicator and compared how many counties were identified among indicators. Finally, to determine whether the indicators identified counties with likely transmission events involving pediatric TB cases, we compared these results with an independently generated list of events that included TB outbreaks or clusters of patients with epidemiological links reported to CDC that included ≥2 pediatric TB cases.
Methods
We used data from the National Tuberculosis Surveillance System (NTSS) for all cases reported from the 50 states and Washington, DC, during 2009-2017. 14 This data set includes all pediatric TB cases, defined as TB disease reported in patients aged <15 years, regardless of culture status. NTSS captures data on demographic, clinical, and laboratory characteristics of all patients, as well as risk factor data and reported epidemiologic linkages to other patients. We included counties and county-equivalents, consisting of parishes and census areas, 14 that reported ≥1 pediatric TB case during the study period; we excluded from the analysis pediatric TB cases for which no county of residence was reported. For each county and year included, we defined a county-year as the unit of eligibility for being identified by an indicator. We obtained pediatric population data for each county from the US Census Bureau’s American Community Survey public-use microdata sample as an estimate during 5 years (2011-2015). 15
We developed 3 indicators that looked for a high incidence of pediatric TB cases relative to predefined thresholds for each year during the study period and reported results as county-years. We calculated the case proportion indicator as the proportion of TB cases occurring in pediatric patients of the total number of TB cases reported in a county. We identified each county that had a calendar year when the proportion of pediatric cases exceeded the national average of 5% during 2011-2017, the 7-year study period. 14 We calculated the case rate indicator as the pediatric TB case rate per 100 000 people aged <15 years. We identified each county that had a year when the pediatric case rate exceeded the average national rate of 0.74 per 100 000 people aged <15 years during 2011-2017. 14 We calculated the national rate of pediatric TB using US Census population estimates by year for each state. However, because these data are not available at the county level, we used the American Community Survey estimates. To increase the specificity of our indicators, we restricted the eligibility for the case proportion and case rate indicators to counties that reported ≥2 pediatric TB cases in a calendar year.
The statistical model indicator identified a significant increase in the expected number of pediatric TB cases reported per quarter in a county using a negative binomial hurdle model. Other studies used this type of model to identify an unexpected increase above a baseline average number of cases.16,17 Briefly, the negative binomial model accommodates over-dispersion, which frequently occurs in count data. The hurdle model also accounts for excess zero counts, 17 which occur when modeling a rare event, such as pediatric TB. We aggregated pediatric TB case counts for each county by quarter during 2009-2017 and calculated a baseline quarterly case count averaged during the previous 8 quarters. We defined a significant increase in case counts as a quarter with a case count above the 95th percentile of the previous 8 quarters. We recalculated the baseline and threshold as subsequent data were reported, resulting in a moving average of pediatric TB cases and a corresponding threshold of unexpected pediatric TB cases for each quarter. We identified counties where the pediatric TB case count exceeded this threshold in ≥1 quarter in a given year as having an unexpected increase in the number of pediatric TB cases in that year.
After calculating county-year instances where indicator values exceeded thresholds, we determined the extent of overlap between the indicators for identifying each instance. We then compared county-year instances with likely transmission events involving pediatric TB cases as represented by an independently generated list of counties with a cluster of patients who had reported epidemiologic links to each other and included ≥2 pediatric TB cases. We identified these clusters during CDC-assisted TB outbreak investigations, 2 reported to CDC as part of a national large outbreak surveillance system, or after review of epidemiologic links reported to NTSS. To improve confidence in NTSS-reported links, we confirmed that these links were consistent with recent transmission by comparing genotypes when available. We excluded reported epidemiologic links between patients if genotyping was available for both cases and results differed substantially, 6 suggesting that transmission between the 2 cases was unlikely despite the reported epidemiologic link. We could not verify transmission events involving pediatric TB cases that were not included in CDC-assisted investigations or lacked epidemiologic links reported to NTSS.
We performed analyses using SAS version 9.4 (SAS Institute, Inc). This project involved a secondary analysis of existing de-identified surveillance data. CDC determined this activity to be research that does not involve identifiable human subjects, and institutional review board approval was not required.
Results
During 2011-2017, a total of 3261 pediatric TB cases with available data on county of residence were reported to NTSS: 1865 cases were among children aged <5 years, and 1396 cases were among children and adolescents aged 5-14 years. Of the 3261 pediatric TB cases, 989 (30.3%) were culture-positive and 925 (28.4%) were genotyped. Overall, 2342 counties reported ≥1 TB case; of these, 615 (26.3%) counties reported ≥1 pediatric TB case and 249 (10.6%) counties reported ≥2 pediatric TB cases in at least 1 calendar year during the 7-year study period, representing 1743 county-year observations (249 counties multiplied by 7 years).
The case proportion indicator identified 655 county-years that exceeded the national average proportion of all TB cases occurring among pediatric patients (ie, 5%) (Table). These county-years denoted an average of 93.6 instances of above-average pediatric TB case proportions per year and represented 240 unique counties during the study period. The case rate indicator identified 744 county-years in which county pediatric TB rates exceeded the national average pediatric TB rate in 1 calendar year (ie, 0.74 pediatric TB cases per 100 000 population) during the study period, denoting an average of 106.3 instances of above-average rates of pediatric TB cases per year and representing 249 unique counties. The statistical model identified 47 county-years with an unexpected increase in the number of pediatric TB cases, denoting an average of 6.7 instances of a significant increase in pediatric TB cases per year and representing 40 unique counties.
Description and results of indicators for identifying higher-than-expected incidence of pediatric tuberculosis (TB) cases, United States, 2011-2017
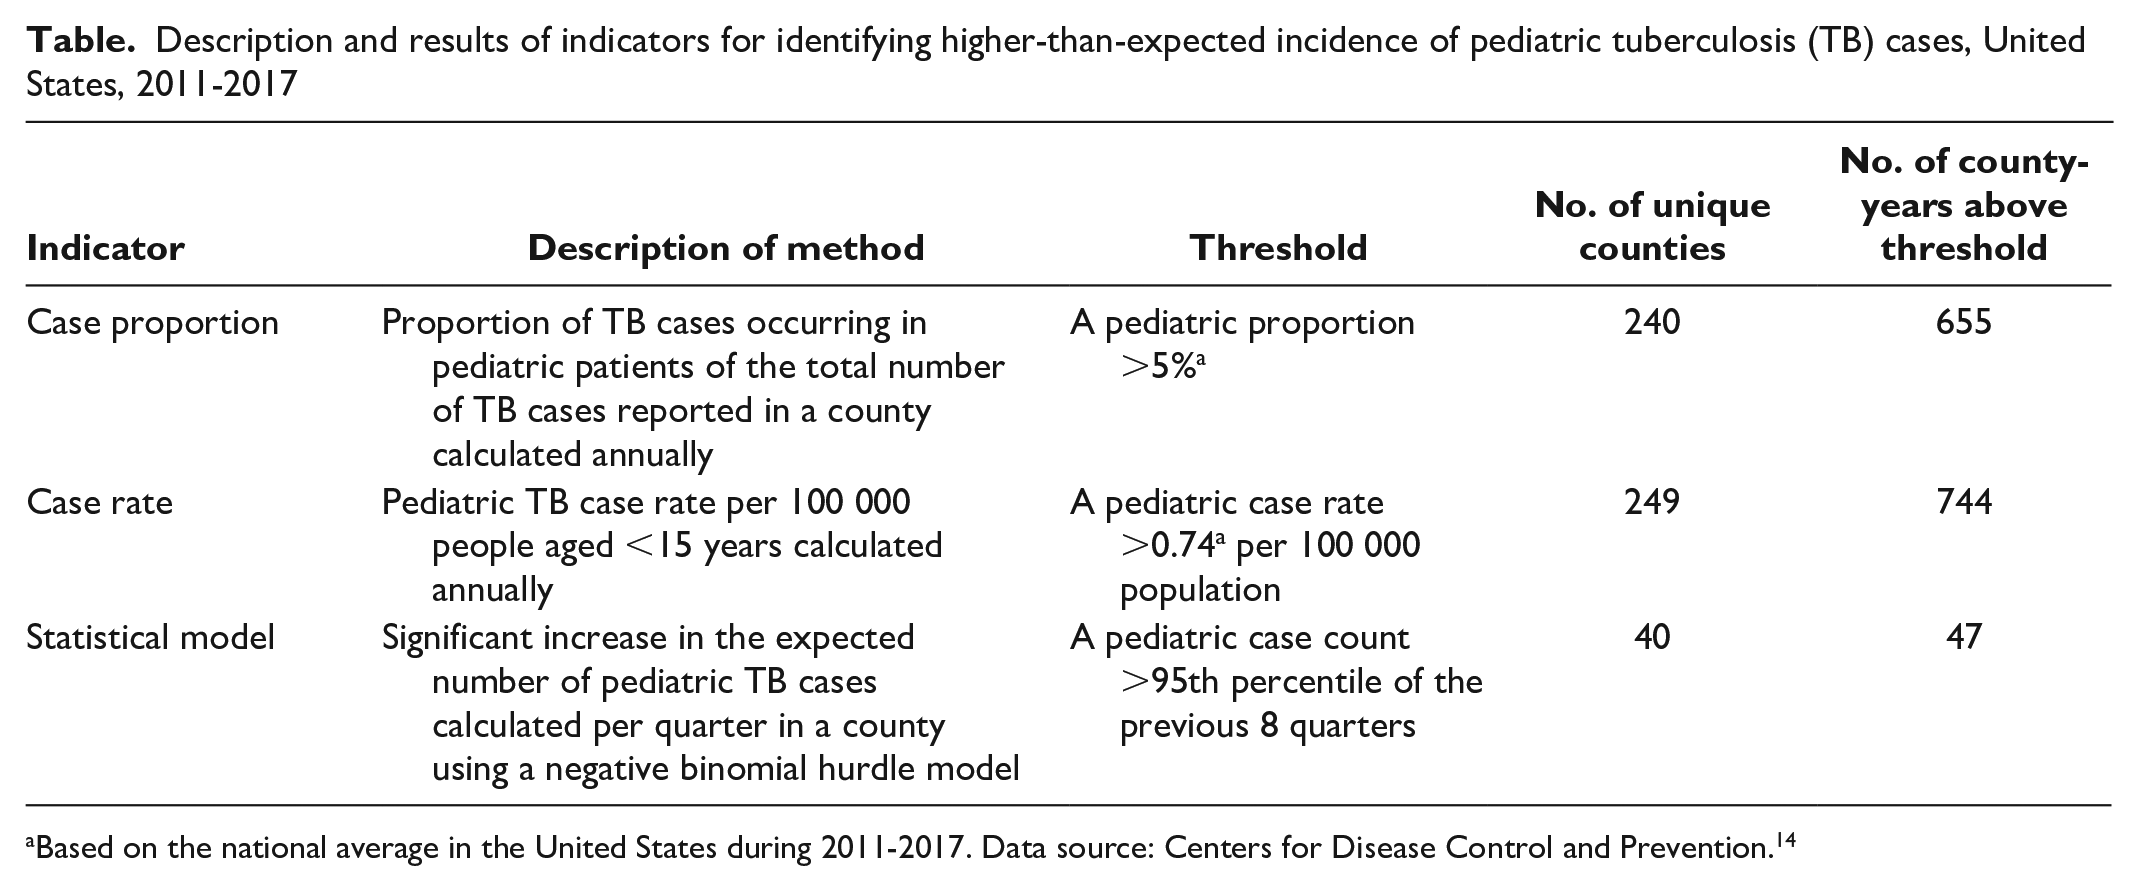
Based on the national average in the United States during 2011-2017. Data source: Centers for Disease Control and Prevention. 14
Of the 1743 county-years of observation eligible for inclusion, 786 (45%) crossed at least 1 threshold among the 3 indicators (Figure). All 3 indicators exceeded respective thresholds during 38 county-years. In addition, both the case proportion and case rate indicators identified 576 county-years with elevated pediatric TB incidence, and the case proportion and statistical method indicators identified 8 instances of elevated pediatric TB incidence. The case proportion and statistical method indicators did not identify any additional county-years with elevated pediatric TB incidence. Of the 164 county-years identified by only 1 indicator as having an above-average number of pediatric TB cases, the case proportion indicator identified 41 (25.0%), the case rate indicator identified 122 (74.4%), and the statistical method indicator identified 1 (0.6%) additional instance of unexpected pediatric TB cases reported in a county.
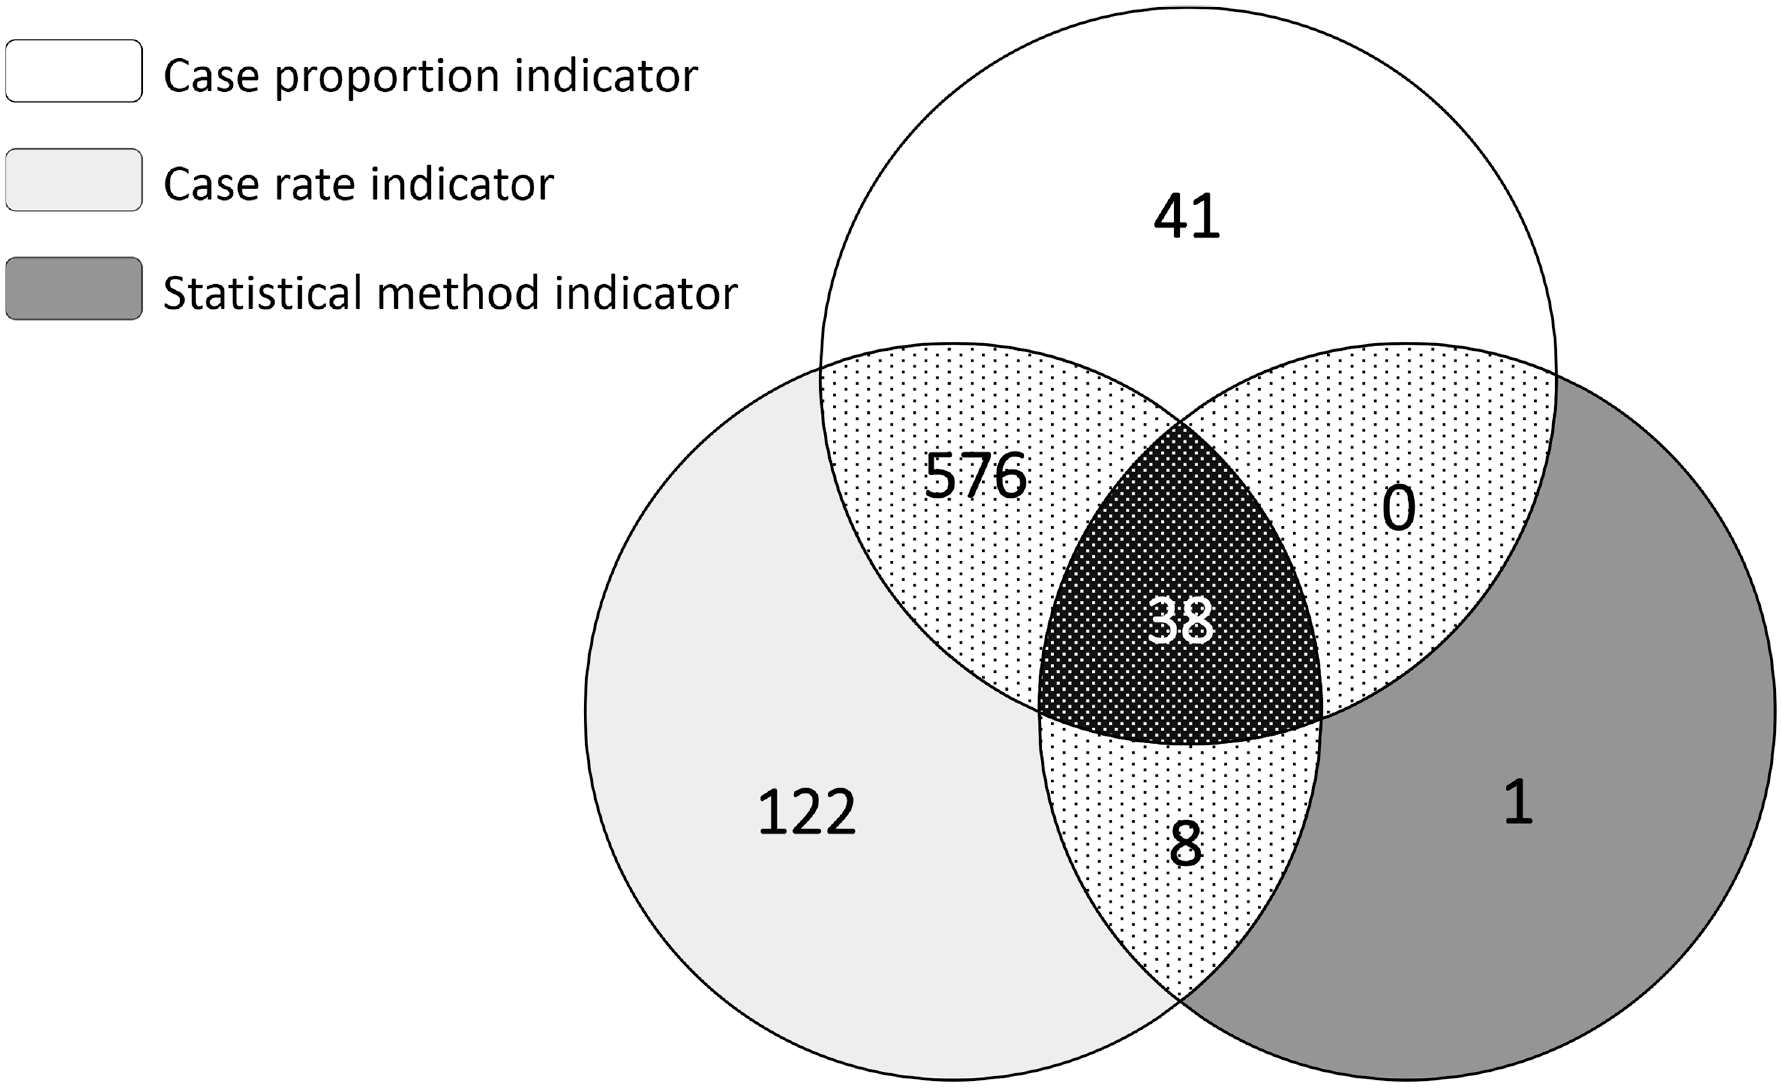
Number of county-years with unexpected frequencies of pediatric tuberculosis (TB) cases identified by 3 surveillance indicators, United States, 2011-2017. A total of 1743 county-year observations were eligible for inclusion based on 249 counties identified as having ≥2 pediatric TB cases reported in any calendar year during the 7-year study period. Case proportion indicator based on national average of 5% of TB cases reported among pediatric patients; case rate indicator based on national average rate of 0.74 per 100 000 TB cases reported among pediatric patients; statistical method indicator based on an expected number of pediatric TB cases per quarter, as calculated by the 95th percentile of a negative binomial hurdle model.
We independently identified 91 counties that had likely TB transmission events involving ≥2 pediatric TB cases during the study period, including 8 events based on CDC-assisted outbreak investigations or reported as a large outbreak and 86 events based on epidemiologically linked pediatric TB cases reported to NTSS. We identified 3 events as outbreaks and from epidemiologically linked cases. Of these 91 counties, the case proportion indicator identified 87 (95.6%) counties, the case rate indicator identified 91 (100.0%) counties, and the statistical method indicator identified 25 (27.5%) counties. At least 1 indicator identified all 91 counties with likely transmission events, with 23 (25.3%) counties identified by all 3 indicators.
Discussion
We developed indicators based on surveillance data to identify counties and years with reported higher-than-expected incidence of pediatric TB cases. In the absence of genotyping data, these indicators might help identify recent transmission events that warrant further review as possible outbreaks. We based the 3 indicators on proportions of pediatric TB cases, rates of pediatric TB cases, and changes in numbers of pediatric TB cases over time in relation to predefined thresholds (eg, national averages). We found partial overlap among the indicators that identified counties with higher-than-expected numbers of pediatric TB cases. Each indicator also independently identified verified likely transmission events involving pediatric TB cases.
We expect that the occurrence of groups of pediatric TB cases in an unrecognized chain of transmission was a rare event based on the small proportion of pediatric TB cases reported each year in the United States. 14 As with the current US genotype-based cluster alerting system, each possible transmission event detected by a pediatric TB indicator would be evaluated locally by public health officials. Therefore, to improve the ability to detect M tuberculosis transmission without overburdening surveillance personnel, the number of potential alerts generated for review must be manageable. The current, genotype-based cluster alerting system generated approximately 2000 alerts during the 7-year study period. The pediatric case proportion and case rate indicators resulted in 655 and 744 alerts, respectively, during the 7-year study period, which is approximately 100 alerts per year among 250 counties. This number of alerts would represent approximately 8 additional reviews per month nationally and fewer at the county level given that few counties will have an alert. Therefore, the effort of reviewing 8 alerts offers the potential to intervene and stop transmission that otherwise might go undetected. The statistical model indicator generated 47 alerts during the study period, resulting in a negligible number of additional reviews.
The case proportion and case rate indicators identified substantially higher numbers of county-years that exceeded national average thresholds for pediatric TB cases than the number of times the statistical model indicator detected an unexpected increase in the number of pediatric TB cases. Furthermore, most county-years identified by the case proportion and case rate indicators were detected by both indicators; this concordance is expected because a higher number of pediatric TB cases in a county would often be reflected in both the proportion and the rate. However, 171 county-years were detected only by either the case rate or case proportion indicator; further investigation is needed to understand the public health importance of a higher-than-average pediatric TB proportion or rate alone. The statistical model indicator detected only 1 county-year that was not detected by at least 1 of the 2 other indicators, suggesting that the statistical model indicator may not identify as many instances of relatively high incidence as the other 2 indicators. Yet, unlike the case proportion and case rate indicators, which do not indicate changes over time, the statistical model indicator detected unexpected increases in a given jurisdiction compared with a previous period, or baseline.
The case proportion and case rate indicators detected almost all and all, respectively, of the 91 known likely transmission events involving pediatric TB cases, signifying that these indicators may identify more of the likely transmission events than the statistical model indicator. The statistical model indicator, however, detected about only one-quarter of the 91 events. Although the statistical model indicator seems less inclusive than the other 2 indicators, it could help stratify detected events into a more urgent priority group for investigation when used in combination with 1 or both of the other indicators. For example, the case proportion and case rate indicators might repeatedly identify counties with higher frequencies of pediatric TB cases than the national average. The statistical model indicator could assist in identifying unexpected increases in the number of pediatric TB cases in these counties that should be investigated because they exceed a county’s historic baseline.
Prospective validation and refinement of the 3 indicators are needed to determine whether 1 indicator or a combination of indicators could augment the current genotype-based alerting system before implementing any indicator nationally. Implementation would include using the indicators to generate alerts and then gathering epidemiologic and presumed source case data for pediatric TB patients to determine which alerts represent recent or ongoing transmission. Conversely, investigations into counties with reported transmission events that did not alert could characterize false negatives. In addition, evaluating thresholds and intervals for indicator calculations and varying combinations of indicators could optimize the sensitivity and specificity of a composite or final indicator. Finally, we will need to know how many additional clusters would be identified using these pediatric indicators to assess whether implementing these indicators would be worthwhile. Our goal is to develop an indicator to be used along with the genotype-based cluster alerting system to (1) provide alerts for counties that report TB cases not identified as being part of likely transmission events because of a lack of genotyping data or (2) precede a genotype-based alert. Ideally, the final indicator will enhance efforts to detect and control ongoing M tuberculosis transmission.
Limitations
This study had several limitations. First, the case proportion and case rate indicators are limited to calculations for a fixed time frame (ie, indicating only whether a county exceeded the defined thresholds in a given calendar year), unlike the statistical method indicator, which is calculated on a rolling basis. However, calculating the case proportion and case rate indicators periodically would allow us to identify instances when a county’s pediatric TB case incidence crossed indicator thresholds; this approach would offer a similar advantage as the statistical method. Second, not all epidemiologic links or transmission events are reported to NTSS; therefore, the number of clusters identified as likely transmission events might be an underestimate. Without a gold standard of known transmission events, we were unable to calculate performance metrics of these indicators. Although we could determine if our indicators positively identified likely recent TB transmission events involving ≥2 pediatric cases, we did not have comprehensive reporting of all such events. Therefore, we were unable to calculate sensitivity, specificity, or predictive values for our indicators of pediatric TB cases in association with transmission. Third, we used counties (and county equivalents) as the geographic unit of measure to align with existing genotype-based methods and because county health departments are responsible for case management. However, this approach may not identify cross-jurisdictional transmission events, which are challenging to recognize at a national level. State and county health departments should work together to identify and coordinate cross-jurisdictional investigations.
Practice Implications
We demonstrated the feasibility of developing national indicators based on genotype-independent surveillance data to identify counties with high numbers of pediatric TB cases, which may represent ongoing transmission events. Given that TB disease among pediatric patients is often a sentinel event for recent M tuberculosis transmission, and culture confirmation of pediatric TB cases is relatively rare, implementing a supplemental national alerting mechanism in parallel with current genotype-based methods could improve TB outbreak detection and response. Further evaluation and refinement of the alerting mechanism are required before implementation.
Footnotes
Acknowledgements
The authors acknowledge the state and local health department personnel who collect and report the data used for these analyses and Benjamin Silk for his thoughtful review. The findings and conclusions in this article are those of the authors and do not necessarily represent the official position of the Centers for Disease Control and Prevention (CDC).
Authors’ Note
Alexia Harrist, MD, PhD, is now affiliated with the Wyoming Department of Health.
Declaration of Conflicting Interests
The authors declared no potential conflicts of interest with respect to the research, authorship, and/or publication of this article.
Funding
The authors disclosed receipt of the following financial support for the research, authorship, and/or publication of this article: The study was funded by the CDC Division of Tuberculosis Elimination.