
Abstract
Objective
HIV disproportionately affects Hispanic/Latino people in the United States, and factors other than individual attributes may be contributing to these differences. We examined differences in the distribution of HIV diagnosis and social determinants of health (SDH) among US-born and non–US-born Hispanic/Latino adults in the United States and Puerto Rico.
Methods
We used data reported to the Centers for Disease Control and Prevention’s National HIV Surveillance System (NHSS) to determine US census tract–level HIV diagnosis rates and percentages among US-born and non–US-born Hispanic/Latino adults aged ≥18 for 2017. We merged data from the US Census Bureau’s American Community Survey with NHSS data to examine regional differences in federal poverty level, education, median household income, employment, and health insurance coverage among 8648 US-born (n = 3328) and non–US-born (n = 5320) Hispanic/Latino adults.
Results
A comparison of US-born and non–US-born men by region showed similar distributions of HIV diagnoses. The largest percentages occurred in census tracts where ≥19% of residents lived below the federal poverty level, ≥18% did not finish high school, the median household income was <$40 000 per year, ≥6% were unemployed, and ≥16% did not have health insurance. A comparison of US-born and non–US-born women by region showed similar distributions.
Conclusion
The findings of higher numbers of HIV diagnoses among non–US-born Hispanic/Latino adults than among US-born Hispanic/Latino adults, regional similarities in patterns of SDH and HIV percentages and rates, and Hispanic/Latino adults faring poorly in each SDH category are important for understanding SDH barriers that may be affecting Hispanic/Latino adults with HIV in the United States.
Keywords
HIV disproportionately affects Hispanic/Latino people in the United States. In 2017, Hispanic/Latino people composed 18% of the US population (about 59 million people) but accounted for 25% (1 in 4) of HIV diagnoses among adolescents and adults aged ≥13. 1,2 In 2017, the rate of HIV diagnoses among Hispanic/Latino females was 5.0 per 100 000 population and nearly 3 times as high as the rate for non-Hispanic White females (1.7). 1,2 That same year, the rate of HIV diagnoses among Hispanic/Latino males was 36.4 per 100 000 population and nearly 4 times as high as the rate for non-Hispanic/Latino White males (10.2). In addition, the estimated number of new HIV infections among Hispanic/Latino males has increased in recent years. 2,3
The Hispanic/Latino population is growing rapidly in the United States. It was the second fastest-growing racial/ethnic group in 2016, with an annual average growth rate of 1.9% from 2015 to 2019. 4,5 In 2017, approximately 33% of Hispanic/Latino people residing in the United States were non–US-born, 6 and approximately 37% of HIV diagnoses among Hispanic/Latino people were among non–US-born residents of the United States. 1 Hispanic/Latino people are not a homogenous group, and differences in health outcomes exist by nativity (US-born and non–US-born) and region of residence in the United States. 7 Examining HIV-related health outcomes among Hispanic/Latino people by nativity shows that non–US-born Hispanic/Latino people are more likely than US-born Hispanic/Latino people to receive a late HIV diagnosis, 8,9 have lower survival rates after AIDS classification, 8,10 and receive care later in the course of the disease. 8,9
Factors other than sex and behavioral risks likely contribute to the disparity in HIV diagnosis rates among Hispanic/Latino people, including barriers that limit access to care. 11 -13 Social issues such as poverty, 14,15 immigration status, 16 employment characteristics, 15,17 and discrimination 18 can also affect Hispanic/Latino people’s access to and willingness to stay in care. 12 In addition, language barriers can make it difficult to navigate a complex health care system. 19 These social structures and economic systems, commonly referred to as social determinants of health (SDH), are complex, overlapping factors that can affect health outcomes. 20 A better understanding of these social determinants is key to improving the health of all populations. 19,21,22
Examining differences in HIV diagnosis percentages and rates among Hispanic/Latino people by nativity can inform effective prevention planning and resource allocation to reduce HIV transmission. We examined differences, at the US census tract level, in the distribution of HIV diagnosis and SDH among US-born and non–US-born Hispanic/Latino adults in all 50 states, the District of Columbia, and Puerto Rico.
Methods
We obtained data from the Centers for Disease Control and Prevention’s (CDC’s) National HIV Surveillance System (NHSS) 23 and the US Census Bureau’s American Community Survey (ACS). 24
National HIV Surveillance System
Numbers, percentages, and rates of diagnoses of HIV infection are based on cases reported to NHSS through December 2018 and include data on Hispanic/Latino adults aged ≥18 whose infection was diagnosed during 2017. We statistically adjusted data using multiple imputation, to account for cases with missing information on transmission category. 25,26 We geocoded HIV surveillance data to the US census tract level based on a person’s residential address at the time of diagnosis and then linked at the US census tract level to SDH indicator variable data from the ACS. Per federal guidelines, NHSS is determined a public health activity and not human subject research; therefore, our study did not require institutional review board review or approval.
NHSS uses Office of Management and Budget Standards for the Classification of Federal Data on Race and Ethnicity to define Hispanic/Latino. 27 People whose birthplace was the United States (restricted to the 50 states, District of Columbia, and Puerto Rico) were classified as US-born as defined by the US Census Bureau. 28
American Community Survey
We obtained census tract–level data for 5 SDH variables from the ACS 2013-2017 five-year estimates 24 : federal poverty status (ie, proportion of residents in the census tract living below the federal poverty level [FPL] during 12 months before survey response) (<7.0%, 7.0%-10.9%, 11.0%-18.9%, ≥19.0%); education level (ie, proportion of residents in the census tract with <high school diploma) (<6.0%, 6.0%-10.9%, 11.0%-17.9%, ≥18.0%); median household income (<$40 000, $40 000-$53 999, $54 000-$74 999, ≥$75 000); employment status (ie, proportion of residents in the census tract in the workforce without a job) (<2.0%, 2.0%-3.9%, 4.0%-5.9%, ≥6.0%); and health insurance (ie, proportion of residents in the census tract without health insurance or a health coverage plan) (<6.0%, 6.0%-9.9%, 10.0%-15.9%, ≥16.0%). We categorized these 5 SDH variables by using empirically derived quartiles, with each quartile cut-point rounded to the nearest integer and determined based on data from all census tracts in the United States and Puerto Rico.
Analysis
We used NHSS data from the 50 states, the District of Columbia, and Puerto Rico to examine distributions of HIV diagnosis in 2017 by age group (18-24, 25-34, 35-44, 45-54, 55-64, ≥65); transmission category (male-to-male sexual contact, injection drug use, male-to-male sexual contact and injection drug use, heterosexual contact [ie, with a person known to have, or to be at high risk for, HIV infection], other [ie, hemophilia, blood transfusion, perinatal exposure, and risk factor not reported or not identified]); residence at diagnosis (urban [population ≥500 000], suburban [population 50 000-499 999], rural [nonmetropolitan area], unknown); nativity (US-born, non–US-born); and SDH indicators stratified by sex at birth among Hispanic/Latino people.
We stratified this analysis by sex at birth because of higher rates of HIV diagnoses and infections among males than among females. 3 We calculated percentages and rates of HIV diagnoses per 100 000 population by region for Hispanic/Latino adults. We stratified the data by sex at birth and assessed by age group, transmission category, residence at diagnosis, and SDH indicator variables in each census tract. We used population denominators to compute rates based on the ACS 2013-2017 five-year estimates of the Hispanic/Latino population. 24 We did not calculate diagnosis rates for Hispanic/Latino adults by nativity because denominator data from the US Census were not linked to the geocoded HIV case information provided to CDC by state/local jurisdictions. Also, we did not calculate diagnosis rates by transmission category because of a lack of denominator data from the US Census. NHSS is a population-based census of all people in the United States and Puerto Rico who have a diagnosed HIV infection, with completeness of reporting estimated to be ≥85%.2 Because NHSS is a comprehensive surveillance system that contains data on nearly all people with diagnosed HIV in the United States, we did not apply statistical tests of significance to the data.
Denominator population from the ACS is based on the entire population of Hispanic/Latino adults aged ≥18. Because the ACS uses predetermined age categories and varying criteria for SDH variables, the denominators differ for some SDH variables. The numerator population is limited to Hispanic/Latino adults aged ≥18 whose HIV infection had been diagnosed and reported with complete residential address that could be geocoded to the census tract level. We excluded cases or census tracts if (1) the address was nonresidential (eg, military base, corrections facility), (2) no census tract was associated with the case, (3) no SDH information was available for the census tract, or (4) the census tract from the surveillance data could not be matched to a census tract provided by the ACS. Regional data are based on the 4 US census regions (Northeast, Midwest, South, and West) and 1 US territory (Puerto Rico). Area of residence is defined as urban (metropolitan area of ≥500 000 population), suburban (metropolitan area of 50 000-499 999 population), or rural (nonmetropolitan population). 29 We used SAS version 9.4 (SAS Institute Inc) to conduct all analyses.
Results
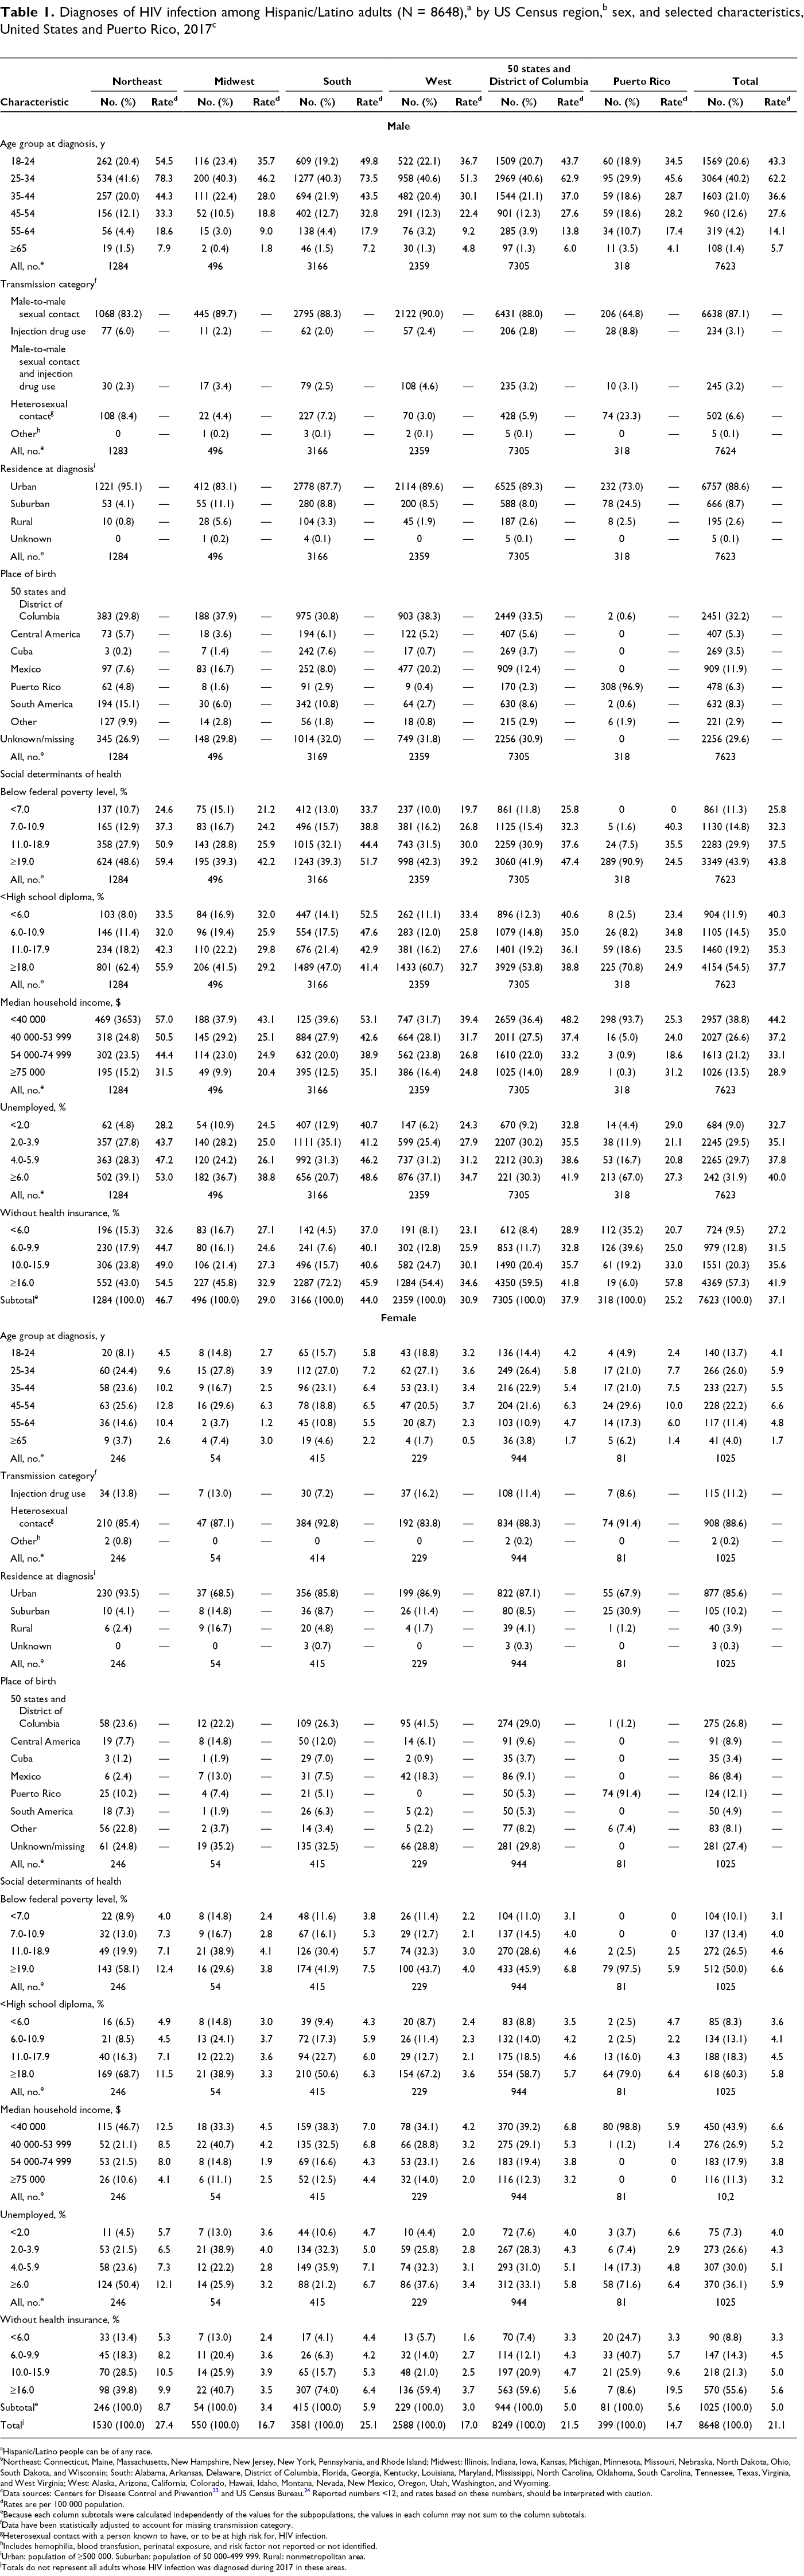
In 2017, HIV infection was diagnosed in 9948 Hispanic/Latino adults in the United States and Puerto Rico, of whom 8648 (8249 in the United States, 399 in Puerto Rico) (86.9%) had residential address information that was sufficient for geocoding to the US census tract (Table 1). The overall rate of diagnosed HIV infection per 100 000 population was 21.1 (men: 37.1; women: 5.0). Birthplace information was missing or unknown for 2537 (29.3%) Hispanic/Latino adults.
aHispanic/Latino people can be of any race.
bNortheast: Connecticut, Maine, Massachusetts, New Hampshire, New Jersey, New York, Pennsylvania, and Rhode Island; Midwest: Illinois, Indiana, Iowa, Kansas, Michigan, Minnesota, Missouri, Nebraska, North Dakota, Ohio, South Dakota, and Wisconsin; South: Alabama, Arkansas, Delaware, District of Columbia, Florida, Georgia, Kentucky, Louisiana, Maryland, Mississippi, North Carolina, Oklahoma, South Carolina, Tennessee, Texas, Virginia, and West Virginia; West: Alaska, Arizona, California, Colorado, Hawaii, Idaho, Montana, Nevada, New Mexico, Oregon, Utah, Washington, and Wyoming.
cData sources: Centers for Disease Control and Prevention 23 and US Census Bureau. 24 Reported numbers <12, and rates based on these numbers, should be interpreted with caution.
dRates are per 100 000 population.
eBecause each column subtotals were calculated independently of the values for the subpopulations, the values in each column may not sum to the column subtotals.
fData have been statistically adjusted to account for missing transmission category.
gHeterosexual contact with a person known to have, or to be at high risk for, HIV infection.
hIncludes hemophilia, blood transfusion, perinatal exposure, and risk factor not reported or not identified.
iUrban: population of ≥500 000. Suburban: population of 50 000-499 999. Rural: nonmetropolitan area.
jTotals do not represent all adults whose HIV infection was diagnosed during 2017 in these areas.
Diagnoses of HIV infection among US-born and non–US-born Hispanic/Latino adults,a by nativity status, US Census region,b sex, and selected characteristics, United States and Puerto Ricoc
aHispanic/Latino adults can be of any race.
bNortheast: Connecticut, Maine, Massachusetts, New Hampshire, New Jersey, New York, Pennsylvania, and Rhode Island; Midwest: Illinois, Indiana, Iowa, Kansas, Michigan, Minnesota, Missouri, Nebraska, North Dakota, Ohio, South Dakota, and Wisconsin; South: Alabama, Arkansas, Delaware, District of Columbia, Florida, Georgia, Kentucky, Louisiana, Maryland, Mississippi, North Carolina, Oklahoma, South Carolina, Tennessee, Texas, Virginia, and West Virginia; West: Alaska, Arizona, California, Colorado, Hawaii, Idaho, Montana, Nevada, New Mexico, Oregon, Utah, Washington, and Wyoming.
cData sources: Centers for Disease Control and Prevention 23 and US Census Bureau. 24 Reported numbers <12 should be interpreted with caution.
dBecause each column subtotals were calculated independently of the values for the subpopulations, the values in each column may not sum to the column subtotals.
eData have been statistically adjusted to account for missing transmission category.
fHeterosexual contact with a person known to have, or to be at high risk for, HIV infection.
gIncludes hemophilia, blood transfusion, perinatal exposure, and risk factor not reported or not identified.
hUrban: population of ≥500 000. Suburban: population of 50 000–499 999. Rural: nonmetropolitan area.
iTotals do not represent all adults whose HIV infection was diagnosed during 2017 in these areas. Excludes 2357 people with missing or unknown place of birth.
In the United States and Puerto Rico, Hispanic/Latino men accounted for 7623 (88.1%) of the 8648 diagnosed HIV infections among Hispanic/Latino adults, with the percentage (40.2%) and rate (62.2 per 100 000 population) highest among men aged 25-34; 87.1% of infections were attributed to male-to-male sexual contact, 88.6% were among men with an urban residence, and 32.2% were among men born in the 50 states and the District of Columbia. The distribution was similar regardless of region. By SDH, among men in the 50 states and the District of Columbia, HIV diagnosis percentages and rates were highest among those who lived in census tracts where ≥19.0% of residents lived below the FPL (percentage, 43.9%; rate, 43.8), ≥18.0% of residents did not finish high school (for percentage only, 54.5%) and <6.0% of residents did not finish high school (for rate only, 40.3), median household income was <$40 000 per year (percentage, 38.8%; rate, 44.2), ≥6.0% of residents were unemployed (percentage, 31.9%; rate, 40.0), and ≥16.0% did not have health insurance (percentage, 57.3%; rate, 41.9). Among men, by region and SDH, we observed similar patterns in percentages and rates overall across the United States. However, in the Northeast, the highest HIV infection rate was among men who lived in census tracts where ≥18.0% had <high school diploma (rate, 55.9). In addition, for each region except the Midwest, HIV rates increased as percentage below the FPL increased, percentage unemployed increased, percentage uninsured increased, or median household income decreased. We observed no clear, linear pattern among rates for people who did not finish high school except for in the South (increase in HIV diagnosis rates as percentage with <high school diploma decreased). We observed similar patterns in percentage distributions among men in Puerto Rico and men across US regions; we did not compare rates because of small cell sizes (Table 1).
Among Hispanic/Latino women in the United States and Puerto Rico, the largest percentage of HIV diagnoses was among women aged 25-34 (26.0%); 88.6% of infections were attributed to heterosexual contact, 85.6% were among women with an urban residence, and 26.8% were among women born in the 50 states and the District of Columbia (Table 1). The distribution was similar regardless of region except for age groups in the Northeast and Midwest, in which the largest percentages were among women aged 45-54 (25.6% and 29.6%, respectively). Among women in the 50 states and the District of Columbia, HIV diagnosis percentages and rates were highest among those who lived in census tracts where ≥19.0% lived below the FPL (percentage, 50.0%; rate, 6.6), ≥18.0% did not finish high school (percentage, 60.3%; rate, 5.8), median household income was <$40 000 per year (percentage, 43.9%; rate, 6.6), ≥6.0% were unemployed (percentage, 36.1%; rate, 5.9), and ≥16.0% did not have health insurance (percentage, 55.6%; rate, 5.6). Among women, patterns in HIV diagnosis rates by region and SDH were similar to patterns found for the United States overall. However, in the Midwest, HIV diagnosis rates were highest among women who lived in census tracts where 11.0%-18.9% of residents lived below the FPL (rate, 4.1), 6.0%-10.9% of residents had <high school diploma (rate, 3.7), and 2.0%-3.9% of residents were unemployed (rate, 4.0). In the Northeast and Midwest, HIV diagnosis rates were highest among women who lived in census tracts where 10.0%-15.9% of residents did not have health insurance (Northeast, 10.5; Midwest, 3.9). We observed no clear linear pattern of HIV diagnosis rates for any US region. Percentage distributions of HIV diagnoses among women residing in Puerto Rico were similar to those observed in the US regions; we did not compare rates because of small numbers.
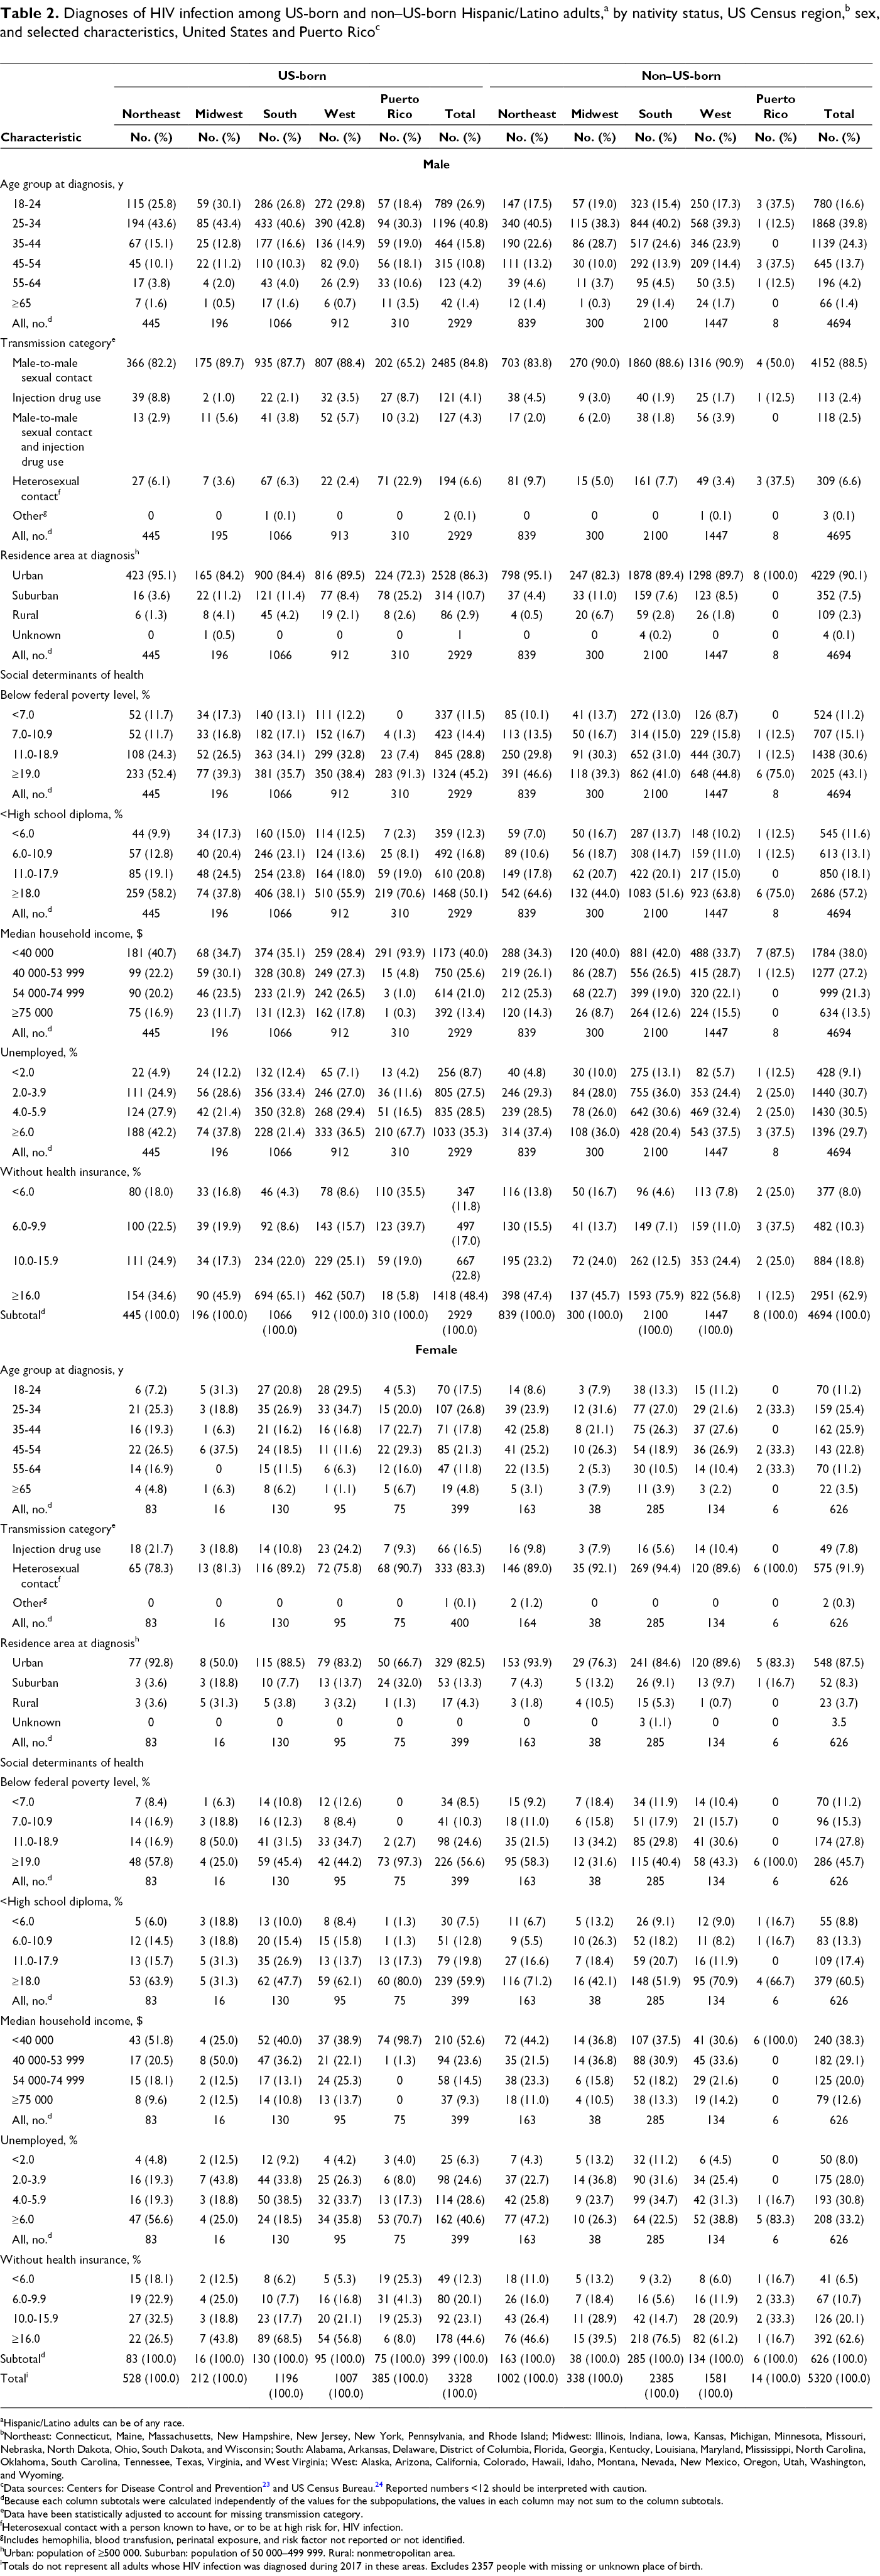
Overall, numbers of HIV diagnoses in 2017 were higher among non–US-born Hispanic/Latino adults (n = 5320) than among US-born Hispanic/Latino adults (n = 3328) residing in the United States and Puerto Rico (Table 2). The South had the highest number of cases diagnosed in 2017 (non–US-born: 2385; US-born: 1196). Among regions, non–US-born Hispanic/Latino adults had higher numbers of HIV diagnoses than US-born Hispanic/Latino adults, and the South had the highest number of cases among non–US-born and US-born Hispanic/Latino adults.
A comparison of Hispanic/Latino men, by nativity and region, showed similar patterns of HIV diagnoses, with the largest percentages among men who were aged 25-34, had male-to-male sexual contact, and had an urban residence area at diagnosis; however, non–US-born men had higher numbers in each category than their US-born counterparts. For SDH among men, we found similar patterns of HIV diagnoses, with the largest percentages among those who lived in census tracts where ≥19.0% lived below the FPL, ≥18.0% had <high school diploma, the median household income was <$40 000 a year, ≥6.0% were unemployed (except in the South: large percentages of US-born and non–US-born Hispanic/Latino adults were diagnosed with HIV where 2.0%-3.9% of residents were unemployed), and ≥16.0% did not have health insurance. US-born men in Puerto Rico followed similar patterns as men in all regions for all variables except for health insurance coverage, where the largest percentage was among Hispanic/Latino adults who lived where 6.0%-9.9% of residents did not have health insurance. We did not compare percentages between the regions and non–US-born Hispanic/Latino men with HIV infection in Puerto Rico because of small cell sizes in SDH subcategories (non–US-born, 8 men) (Table 2).
A comparison of Hispanic/Latino women, by nativity and region, showed similar patterns of HIV diagnoses, with the largest percentages of HIV diagnoses among women who had heterosexual contact and an urban residence at diagnosis (Table 2). For SDH among women, we observed similar patterns of HIV diagnoses, with the largest percentages among women who lived in census tracts where ≥19.0% lived below the FPL (except in the Midwest), ≥18.0% had <high school diploma, the median household income was <$40 000 per year (except in the Midwest), and ≥16.0% did not have health insurance (except in the Northeast). The Midwest had few HIV diagnoses among Hispanic/Latino women (US-born, 16 women; non–US-born, 38 women). Also, the percentage who were unemployed differed by region, but we observed the same pattern of percentages for US-born and non–US-born Hispanic/Latino women. US-born women in Puerto Rico had similar distributions as women in US regions except for health insurance coverage, in which the largest percentage was among women who lived where 6.0%-9.9% of residents did not have health insurance. We did not compare percentages between regions and non–US-born Hispanic/Latino females with HIV infection in Puerto Rico because of small cell sizes in SDH subcategories (non–US-born, 6 women).
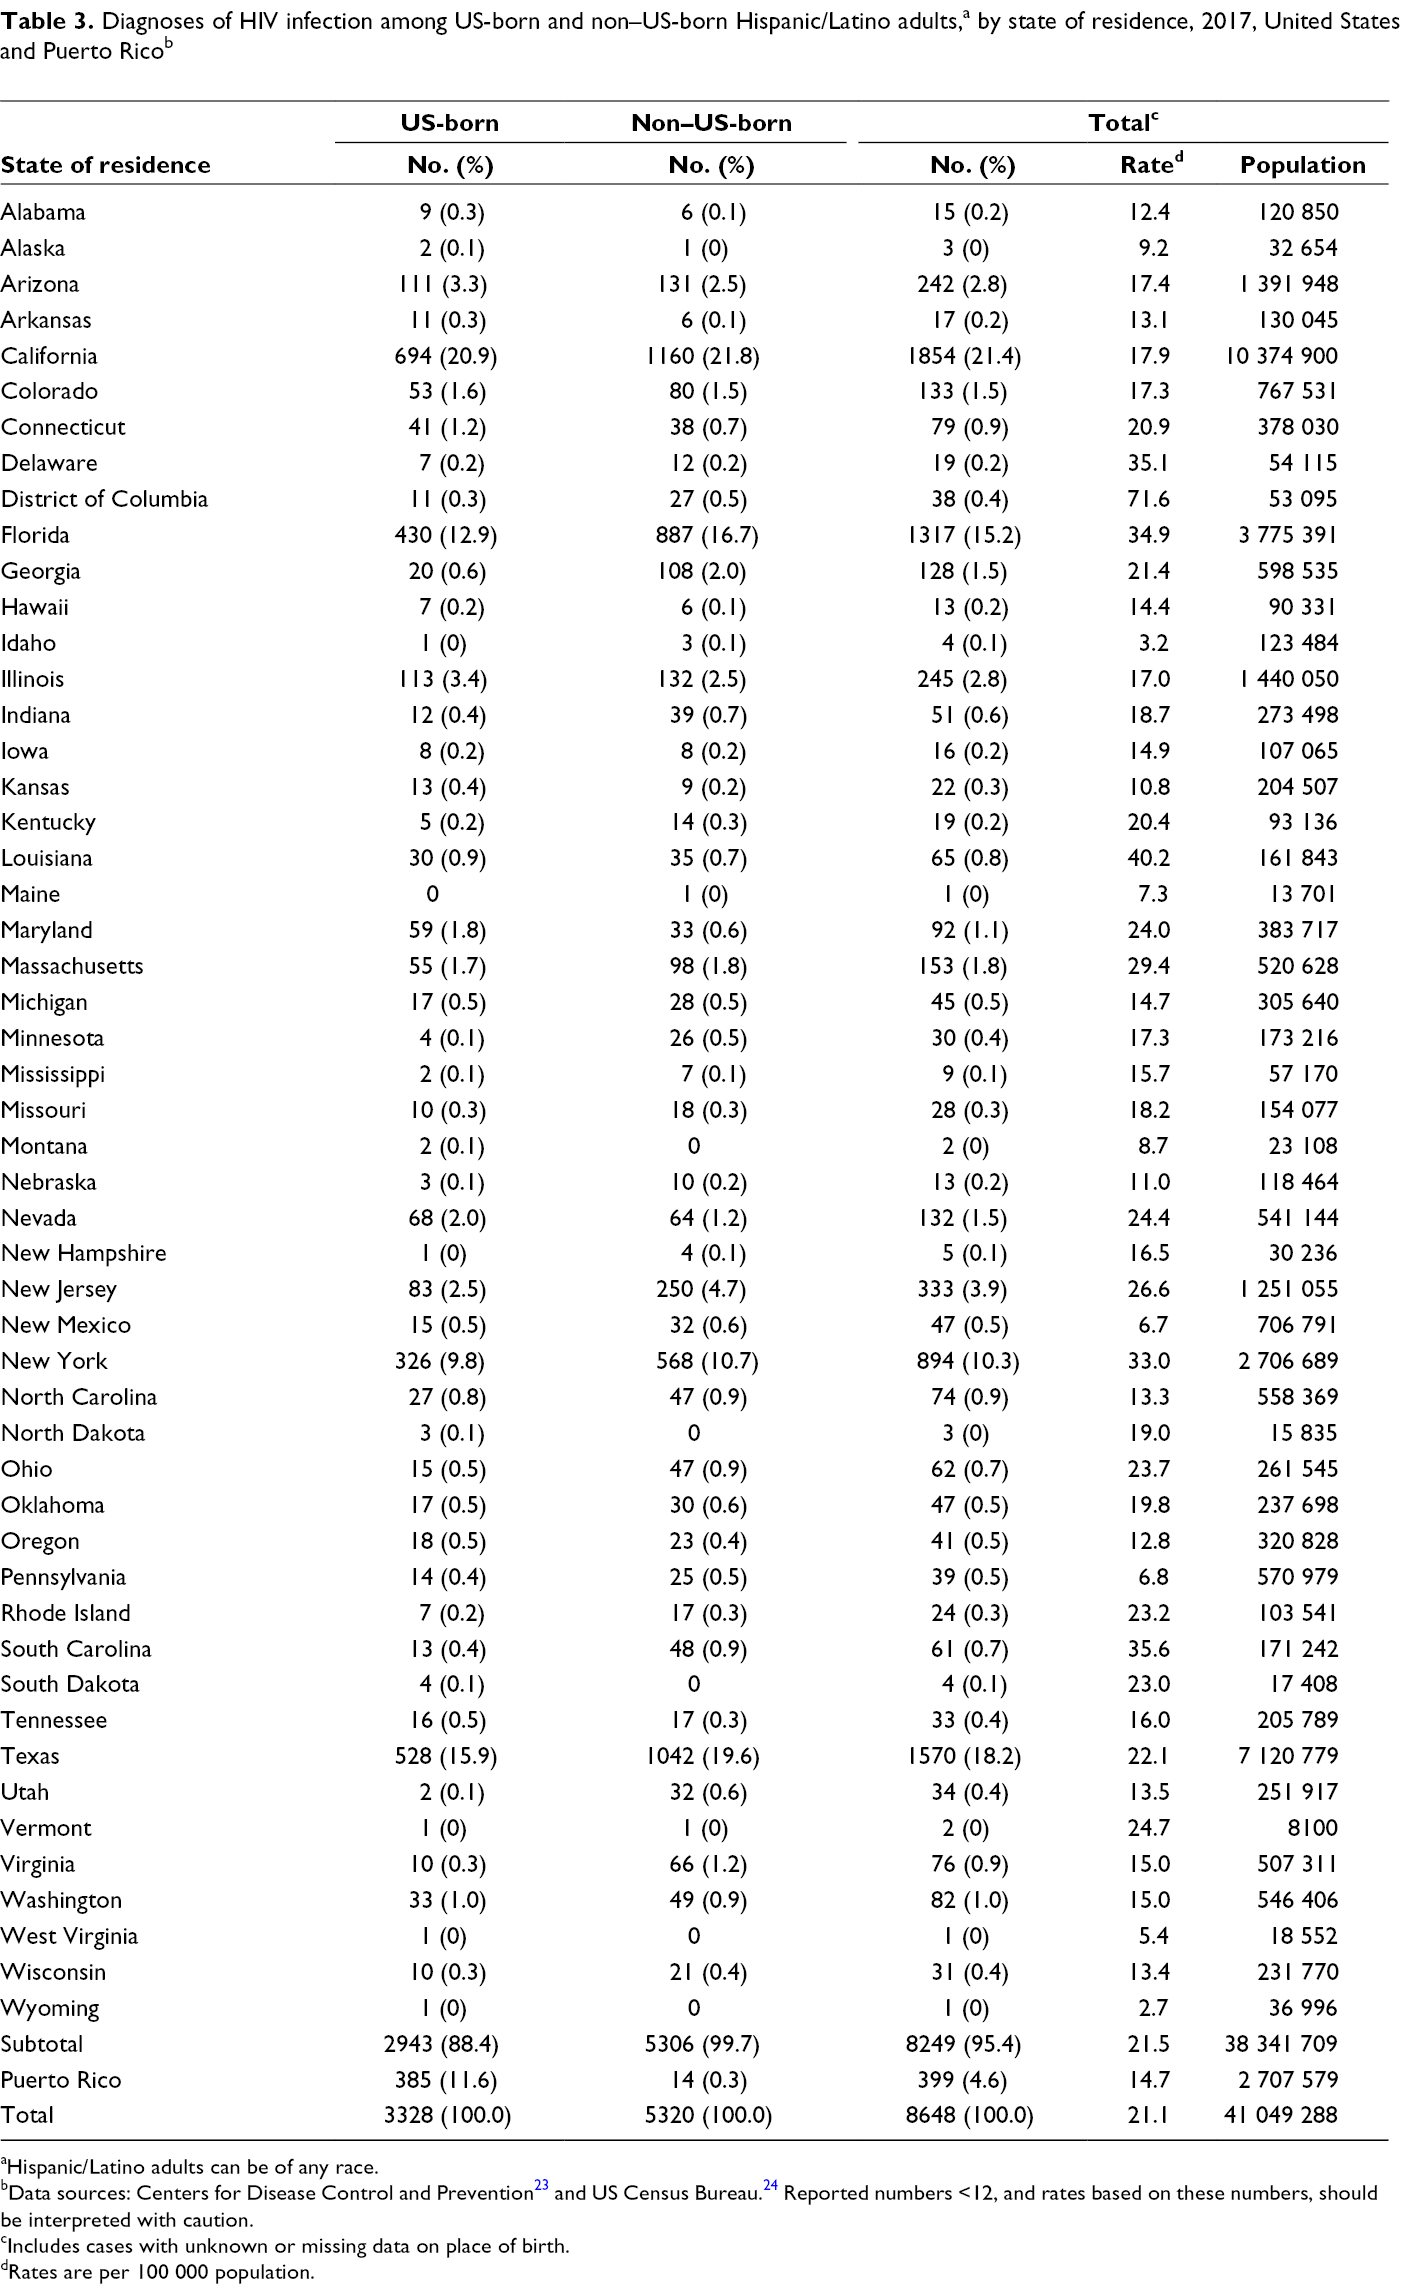
By state, the 10 states with the highest HIV diagnosis rates per 100 000 population among Hispanic/Latino adults were Louisiana (40.2), South Carolina (35.6), Delaware (35.1), Florida (34.9), New York (33.0), Massachusetts (29.4), New Jersey (26.6), Nevada (24.4), Maryland (24.0), and Ohio (23.7) (Table 3). The HIV diagnosis rate for Vermont was 24.7, but the state had only 2 cases. The HIV diagnosis rate for the District of Columbia was 71.6 and for Puerto Rico was 14.7.
Diagnoses of HIV infection among US-born and non–US-born Hispanic/Latino adults,a by state of residence, 2017, United States and Puerto Ricob
aHispanic/Latino adults can be of any race.
bData sources: Centers for Disease Control and Prevention 23 and US Census Bureau. 24 Reported numbers <12, and rates based on these numbers, should be interpreted with caution.
cIncludes cases with unknown or missing data on place of birth.
dRates are per 100 000 population.
The states with the highest percentages of HIV diagnoses among US-born and non–US-born Hispanic/Latino adults in the United States in 2017 were Arizona, California, Colorado, Florida, Georgia, Illinois, Maryland, Massachusetts, Nevada, New Jersey, New York, and Texas (Figure). The largest percentages of HIV diagnoses were in California, where Hispanic/Latino adults composed 25.3% of adults: US-born Hispanic/Latino adults accounted for 20.9% of HIV diagnoses, and non–US-born Hispanic/Latino adults accounted for 21.8% of HIV diagnoses.
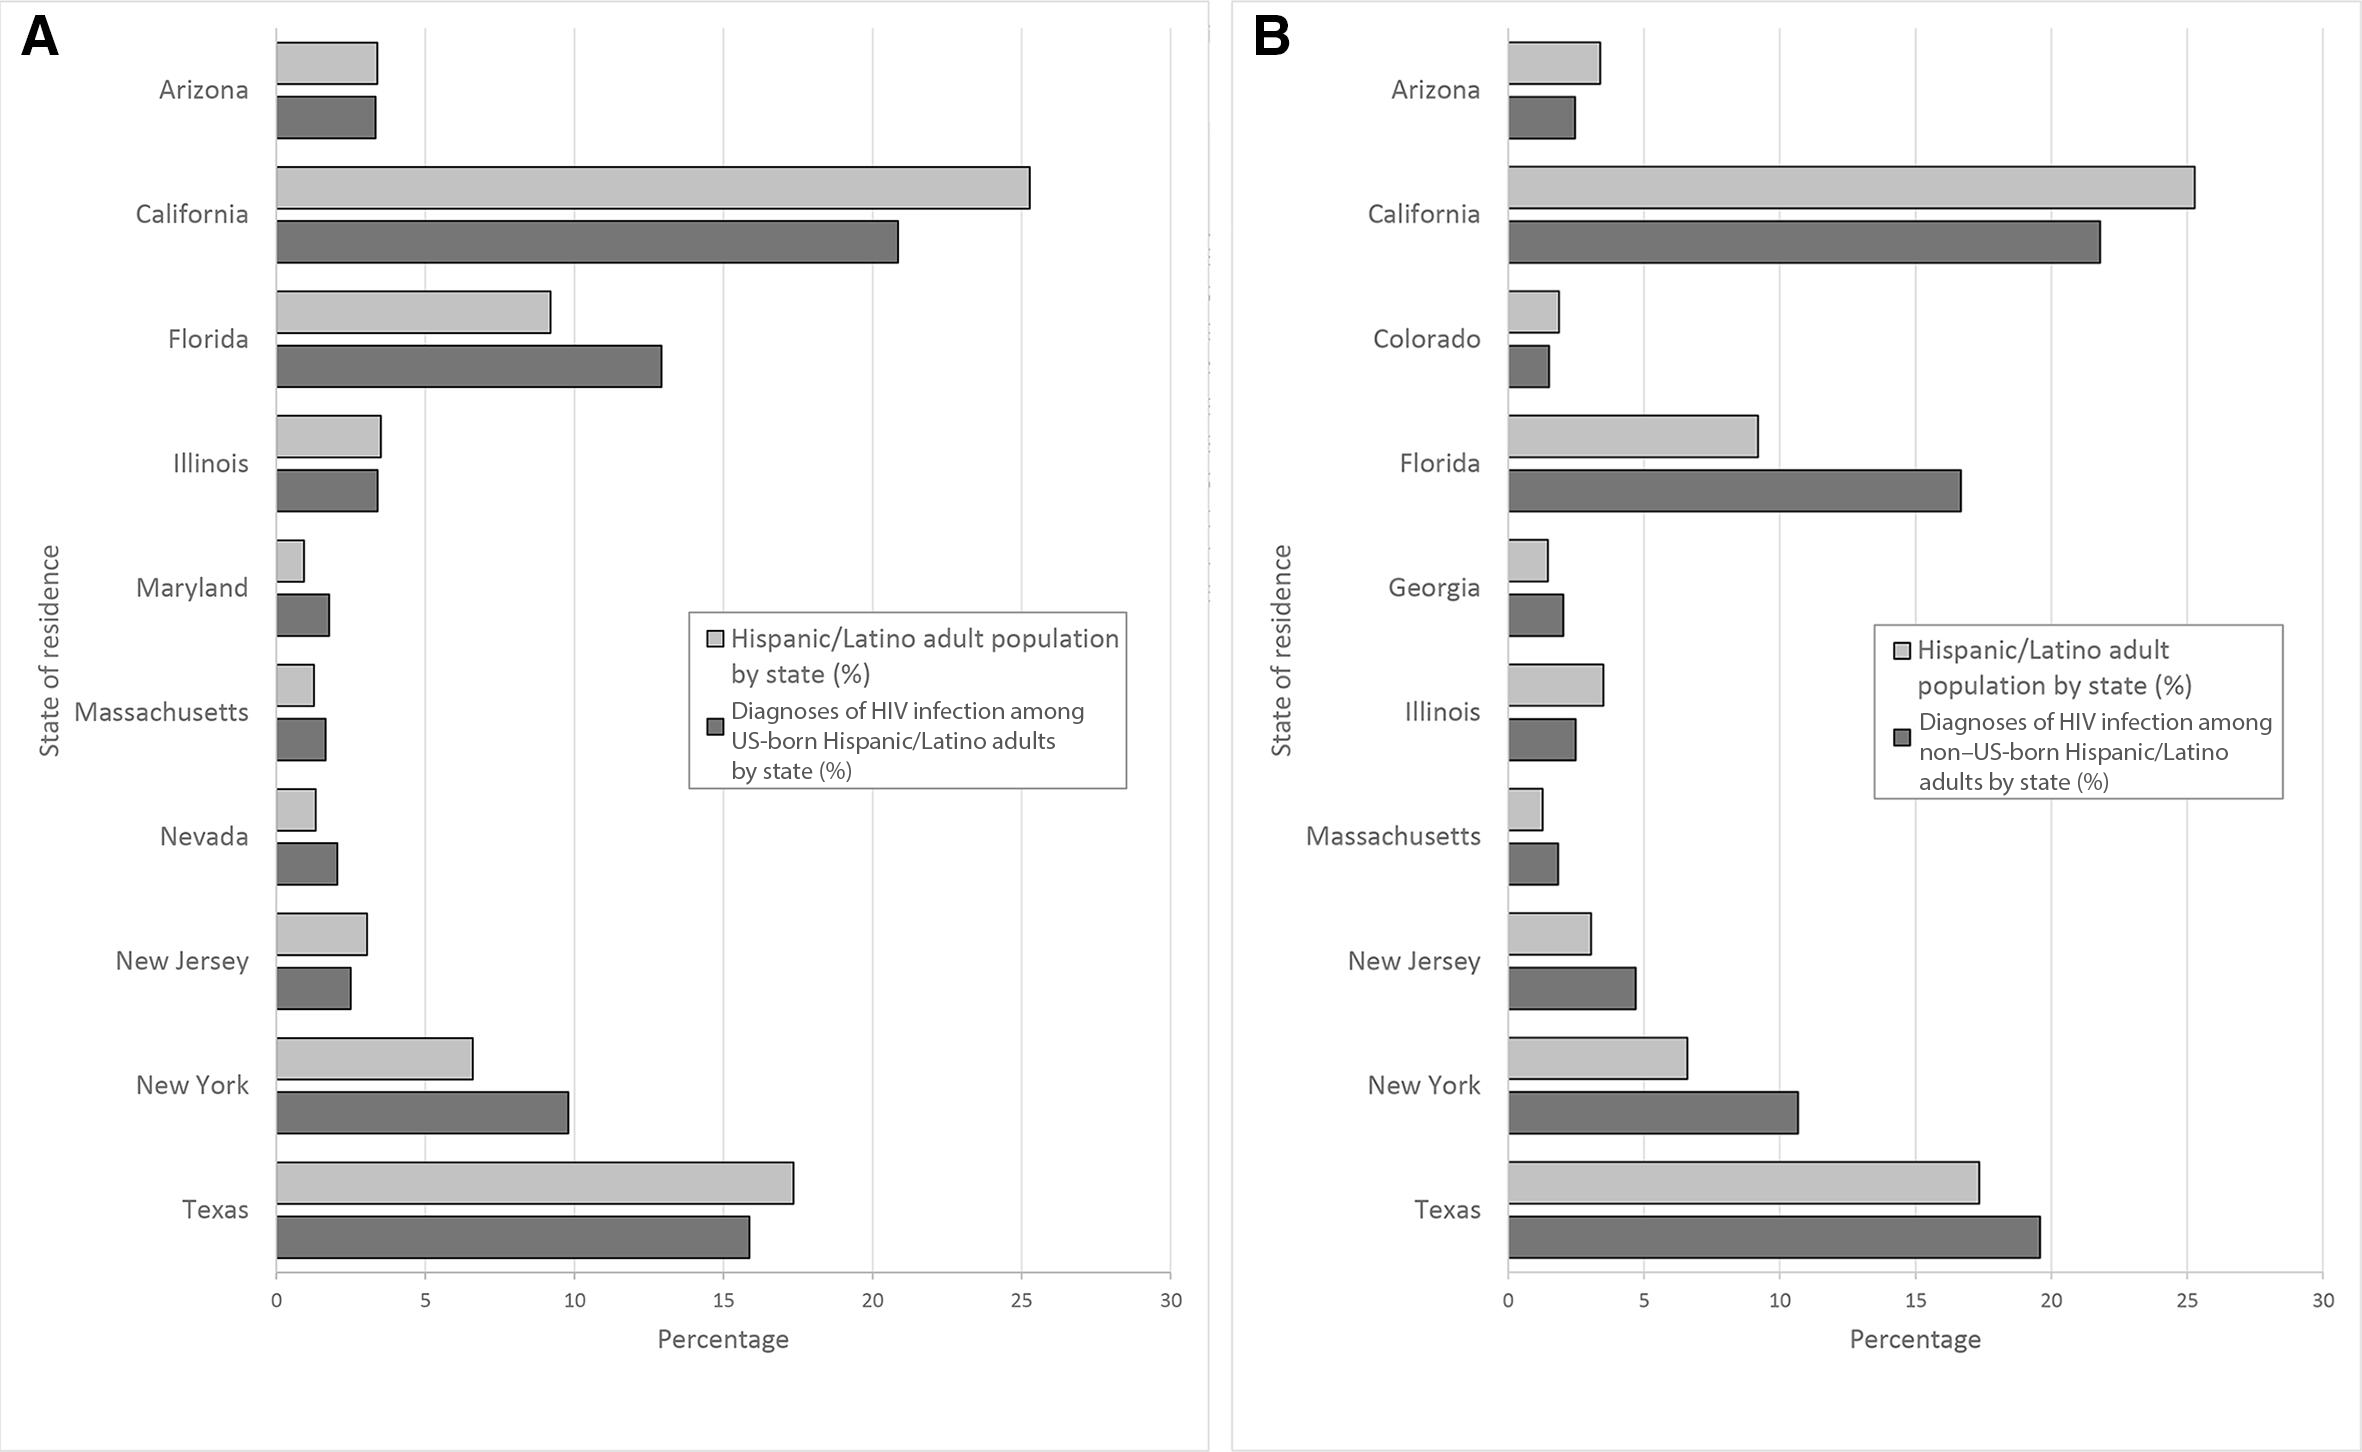
Diagnoses of HIV infection among US-born (A) and non–US-born (B) Hispanic/Latino adults, in the 10 US states with the highest percentages of HIV diagnoses, 2017.
Discussion
To our knowledge, this analysis is the first large-scale census tract–level study to examine SDH among Hispanic/Latino adults with HIV in the United States based on nativity. The findings of higher numbers of HIV diagnoses among non–US-born than among US-born Hispanic/Latino adults, regional similarities in patterns of SDH and HIV percentages and rates, and Hispanic/Latino adults faring poorly in each SDH variable category are important for understanding the SDH barriers that may be affecting Hispanic/Latino people. Overall, we found similar patterns of distributions of HIV diagnoses among US-born and non–US-born Hispanic/Latino adults when examining various SDH variables, such as higher percentages in areas with lowest education level and lowest health insurance coverage. Also, some US regions (eg, the South) stood out for their higher numbers of HIV diagnoses and varying patterns of SDH distributions. For example, the Midwest and South did not have the same distribution of HIV diagnoses as other regions when examining federal poverty status (for women), unemployment (for men and women), and median household income (for women).
Five of 10 states with the highest rates of HIV infection among Hispanic/Latino adults were in the South. Hispanic/Latino people tend to be of Mexican and Central American descent in the South and West and of Puerto Rican descent in the Northeast. 30 Regional differences may be partly due to Hispanic/Latino people of Mexican and Central American descent migrating to the South for job opportunities such as construction, meat packing, and other service industries, which are typically available in the region. 26 The South has the largest percentage of undiagnosed cases, which can increase HIV transmission. 31 In addition, geographic differences in testing could be partly due to the lack of Medicaid expansion in certain states, many of which are in the South. 26,32,33
An issue for Hispanic/Latino people regardless of nativity and region is health insurance coverage; Hispanic/Latino people are the largest uninsured racial/ethnic group in the United States, with the largest percentage being among non–US-born Hispanic/Latino people. 34,35 In our study, as percentages of HIV diagnoses increased, health insurance coverage decreased. Being the largest uninsured racial/ethnic group in the United States and non–US-born is further compounded by immigration status. Undocumented immigrants have additional barriers to health care as a result of ineligibility, stigma, and fear of deportation. 16,36 In addition, limited Medicaid coverage likely creates a challenge for the uninsured, because Medicaid is a primary source of health coverage among people with diagnosed HIV infection. 34 These barriers are multifaceted factors that can influence HIV outcomes among Hispanic/Latino people.
Our finding that the number of HIV diagnoses was higher among non–US-born than among US-born Hispanic/Latino people could be partially explained by migration. Research has found a correlation between SDH factors and economic challenges that increase the risk of HIV infection because of a delay in access to care, increased substance abuse, barriers to health care services, and language barriers. 37 -39 In addition, a substantial proportion of non–US-born Hispanic/Latino people are undocumented, 37 which can create additional barriers to HIV testing and care. Undocumented Hispanic/Latino people tend to enter care at a later rather than earlier stage of disease. 40 -42 These issues can be compounded by a lack of health insurance coverage, fear of legal ramifications, and fear of societal perception. 9,40 -42
Our analysis found that Hispanic/Latino people typically are at the negative end of the spectrum of each SDH variable, regardless of nativity. Income and education play an important role in health, 43 -45 which directly and indirectly affects poverty, health insurance, and employment status. Furthermore, non–US-born Hispanic/Latino people may have greater disadvantages, such as limited access to health care and language barriers, than US-born Hispanic/Latino people because of challenges in migrating from a different culture and changes in social norms. 11,46 These disadvantages can be exacerbated for undocumented Hispanic/Latino people. An increase in education and income results in better health outcomes, longer lifespan, and practice of healthy behaviors, such as HIV prevention (eg, condom use and testing). 43,44
Limitations
Our study had several limitations. First, diagnoses of HIV infection do not represent new infections. The time from infection to diagnosis varies by individual, and residence at the time of HIV diagnosis may not be the residence at the time infection was acquired. Second, data were limited to people whose residential addresses were complete and could be geocoded (87%); therefore, results may not reflect the entire population of Hispanic/Latino adults with diagnosed HIV in those areas. Third, we used census tract–level data as a surrogate to represent the environment in which people with diagnosed HIV infection lived at the time of diagnosis. Conclusions and findings should be interpreted with caution and not inferred at the individual level. Fourth, some SDH indicators may be correlated (eg, lack of education has been associated with both poverty and low income in the United States), 47,48 but we did not analyze correlations. Finally, data on place of birth were missing for 29% of Hispanic/Latino adults, and data on HIV diagnoses may be lacking in NHSS for undocumented immigrants. The distribution of these likely missing cases may have affected the numbers in certain subgroups, thereby resulting in larger or smaller numbers. However, NHSS data are the most comprehensive source of HIV data on Hispanic/Latino people.
Conclusion
Examining SDH factors that may influence HIV outcomes among Hispanic/Latino people by nativity and geography is important for identifying the steps needed to reduce rates of HIV infection and HIV disparities in the United States. More data are needed on non–US-born Hispanic/Latino people to better understand existing challenges and future mechanisms needed to improve HIV outcomes. HIV intervention strategies should be tailored to the characteristics of the Hispanic/Latino population in different geographic areas 21,49 and based on country of birth, 8,50 and a further breakdown and understanding of non–US-born Hispanic/Latino people are needed to fully understand the overall impact of HIV among Hispanic/Latino people. Because federal initiatives emphasize the need to address SDH as it relates to vulnerable areas and unexpected increases of HIV in selected subgroups, 51 future work should examine HIV diagnoses and linkage to medical care among subpopulations by nativity for Hispanic/Latino people.
Footnotes
Acknowledgments
Publication of this article was made possible with the contributions of the state and territorial health departments and the HIV surveillance programs that provided surveillance data to CDC. The authors thank CDC colleagues for their review of and feedback on this article.
Authors’ Note
The findings and conclusions in this article are those of the authors and do not necessarily represent the official position of CDC.
Declaration of Conflicting Interests
The authors declared no potential conflicts of interest with respect to the research, authorship, and/or publication of this article.
Funding
The authors received no financial support for the research, authorship, and/or publication of this article.