
Abstract
Objectives:
We used area-level indicators of poverty to describe economic disparities in the incidence rate of infectious syphilis in Massachusetts to (1) determine whether methods developed in earlier AIDS analyses in Massachusetts could be applied to syphilis and (2) characterize syphilis trends during a time of increased rates of syphilis incidence.
Methods:
Using census tract data and population counts from the US Census Bureau and Massachusetts data on syphilis, we analyzed the incidence rate of syphilis infection from 2001 to 2013 by the poverty level of the census tract in which people with syphilis resided, stratified by age, sex, and race/ethnicity.
Results:
The syphilis incidence rate increased in all census tract groups in Massachusetts from 2001 to 2013, and disparities in incidence rates by area poverty level persisted over time. The overall incidence rate of syphilis increased 6.9-fold from 2001 to 2013 in all census tract poverty-level groupings (from 1.5 to 10.3 per 100 000 population), but the rise in rate was especially high in the poorest census tracts (from 5.6 to 31.0 per 100 000 population) and among men (from 2.2 to 19.4 per 100 000 population). The highest syphilis incidence rate was among non-Hispanic black people. The largest changes in incidence rate occurred after 2010. One region had a disproportionate increase in incidence rates and a disproportionate impact on the statewide trend.
Conclusions:
Census tract poverty analyses can inform the targeting of interventions that make progress toward reducing disparities in rates of syphilis incidence possible.
Syphilis epidemiology in the United States has changed during the last century, from reductions in incidence rates after World War II with the introduction of penicillin therapy to an increase in the late 1980s, which was associated in some jurisdictions with cocaine use and sex for money or drugs. 1 –5 The incidence rate of primary and secondary syphilis in the United States declined 90% from 1990 (20.3 per 100 000 population) to 2000 (2.1 per 100 000 population), at which point it stood at the lowest rate since national data collection began in 1941. This decline prompted the Centers for Disease Control and Prevention to launch a campaign to eliminate syphilis nationally. 6 However, the syphilis incidence rate in the United States increased from 2001 to 2013, with the largest increases reported among men, particularly men who have sex with men. 7,8 Massachusetts reported parallel increases, with 7 times as many primary, secondary, and early latent syphilis cases in 2013 (n = 701) than in 2001 (n = 105). This increase in syphilis cases in Massachusetts was attributable primarily to an increase in syphilis incidence rates among men who have sex with men (unpublished data, Massachusetts Department of Public Health).
To quantify syphilis incidence rates in relation to socioeconomic factors, we focused on the recent increase in rates of syphilis incidence in Massachusetts, from 2001 to 2013. Although health department staff members routinely analyze data on risk to assess disparities by race/ethnicity and sex, we had not previously examined economic disparities in syphilis incidence rates. Surveillance databases for sexually transmitted diseases (STDs) do not include individual-level socioeconomic information, but neighborhood-level socioeconomic information is available from the US Census Bureau, and postal addresses in the surveillance databases can be geocoded to assess the correlation of surveillance data with area-level indicators of socioeconomic status. Census tract-level analyses, as opposed to census block- or ZIP code-level analyses, have yielded the most consistent and most geocodable results with maximal geocoding linkage. Measures of socioeconomic gradients based on the percentage of the population living below the federal poverty level (FPL) perform as well as more complex, composite measures of economic deprivation. 9,10 Our analysis of economic disparities in syphilis incidence rates builds on the methods developed in earlier analyses of AIDS in Massachusetts. 11 The objective of this study was to describe economic disparities in the incidence rates of infectious syphilis in Massachusetts from 2001 to 2013 by using area-level indicators of poverty.
Methods
Study Population
The data set included 4472 records of primary, secondary, and early latent syphilis reported as diagnosed between January 1, 2001, and December 31, 2013, and classified according to the Centers for Disease Control and Prevention surveillance case definition in place through the period (1996 case definition). 12 State law mandates that laboratories and health care providers report positive syphilis laboratory reports and diagnoses to the state health department, and these reports are subsequently entered into a surveillance database at the health department. The database used in Massachusetts during this time was STD*MIS. After the state health department is notified of a syphilis case, a disease intervention specialist investigates the case through provider telephone calls, patient interviews, and interviews with sexual partners of patients. Staff members investigate early latent cases of syphilis in addition to primary and secondary cases of syphilis because early latent cases in Massachusetts are considered potentially infectious. Early latent cases may be diagnosed by using blood test results without a physical examination at the time of testing. Massachusetts does not have a traditional STD clinic system as do other jurisdictions, and patients in Massachusetts may be less likely than patients in other jurisdictions to have a full examination. Some people with early latent syphilis report recent symptoms, but without further detail from a provider, they cannot be classified as having primary or secondary syphilis.
Variables extracted from STD*MIS for this analysis included year of syphilis diagnosis and person’s age in years, sex, race/ethnicity, and postal address. We used ESRI ArcGIS batch geocoding software 13 to geocode the patient’s postal address to identify the census tract of residence for each syphilis case. Area-based socioeconomic measures were derived from census information about the socioeconomic characteristics of the aggregate population of a geographic area, and we used these measures as a proxy for people who resided in the area. 14
Area-based socioeconomic measures are considered more reliable in urban areas than in nonurban areas because they are more homogeneous. 14 Massachusetts is 92% urban, 15 and people with syphilis are predominantly located in urban centers. The geocoding process added geocoding status and census tract identification. We identified and removed from the analysis records without postal address information and records with addresses of known congregate living facilities (eg, shelters, prisons, jails, college/university dormitories) to eliminate spurious geographic clusters. We assigned the economic characteristics of the census tracts of residence at the time of disease report to each case of syphilis. We downloaded data on Massachusetts population demographic characteristics, census tract population estimates, and poverty from the US Census Bureau American FactFinder website for the 2000 and 2010 decennial censuses. 16 These data included counts for the resident population for all Massachusetts census tracts by age group (5-year increments), sex, and race/ethnicity. We included FPL by census tract for the total population. We merged census data with the data on Massachusetts syphilis cases by census tract identification. We grouped census tract FPLs into 5 categories of populations living below the FPL: 0.0%-4.9%, 5.0%-9.9%, 10.0%-19.9%, 20.0%-39.9%, and 40.0%-100.0%. We selected these 5 groups to include sufficient numbers of cases and to closely parallel FPL conventions. The FPL for a family of 4 was defined as $17 603 in 2000 and $22 315 in 2010. 17
As a routine public health surveillance project, this analysis was exempt from institutional review board review.
Statistical Analysis
We used SAS version 9.3 and R version 3.1 for statistical analysis. 18,19 The initial analytic process consisted of building the numerators and denominators used for calculations. We computed numerators for each FPL group by summing the total number of syphilis cases geocoded to census tracts of the same FPL. We further stratified these data by sex, race/ethnicity, and age for each year of diagnosis (eg, men living in census tracts in 2004 in which <5% of residents were below the FPL). We calculated denominators for each FPL group and stratification (sex, race/ethnicity, age) by summing population estimates (by sex, race/ethnicity, and age) of residents living in census tracts of the same FPL. 16 We calculated annual intercensal population estimates and poverty indices through simple linear regression by using 2000 and 2010 decennial estimates for the 2001-2010 period. Because we were unable to calculate annual estimates for the years 2011-2013 using this method, we substituted with 2010 estimates.
We calculated annual and cumulative incidence rates for each FPL overall and stratified the rates within poverty levels using a standard crude incidence calculation: incidence rate = (cases/population) × 100 000. We calculated age-standardized incidence rates using the National Center for Health Statistics master list of population projections and age-adjustment weights 20 to account for syphilis risk having an age structure different from the census tract group population. Finally, we calculated a ratio for disparity as the rate in census tracts with the highest poverty (40.0%-100.0% of the population living below the FPL) divided by the rate in census tracts with the lowest poverty (0.0%-4.9% of the population living below the FPL).
Massachusetts Demographic Characteristics
Of 6.3 million Massachusetts residents in the 2000 US Census, 7% were Hispanic (of any race), 85% white, 5% black, 4% Asian, and 6% other or multiple races. 21 Of 6.5 million state residents in the 2010 US Census, 10% were Hispanic (of any race), 80% white, 7% black, 5% Asian, and 8% other or multiple races. 22
Results
Trends in Syphilis Incidence Rates in Massachusetts
We found an overall 6.9-fold increase in age-adjusted syphilis incidence rates in Massachusetts from 2001 to 2013 (1.5 to 10.3 per 100 000 population), with the greatest increase among men (2.2 to 19.4 per 100 000 population). The syphilis incidence rate among women increased 2.0-fold during the period (0.8 to 1.6 per 100 000 population). Of 4472 reported cases of syphilis from 2001 to 2013, 244 records (5%) had unknown race/ethnicity. Compared with non-Hispanic white people, Hispanic and non-Hispanic black people had disproportionately higher incidence rates of syphilis throughout the period but lower rate increases over time. Hispanic residents had a 5.7-fold increase in syphilis incidence rates (4.3 to 24.4 per 100 000 population), and non-Hispanic black residents had a 5.3-fold increase in syphilis incidence rates (4.4 to 23.3 per 100 000 population). Non-Hispanic white residents had the largest increase in syphilis incidence rates, from 0.7 to 6.6 per 100 000 population. Several other racial/ethnic groups had unstable rates because of a small number of diagnoses. Case numbers and crude rates (not age-adjusted) in each poverty group and racial/ethnic group for each year are presented in Table 1. Overall age-adjusted rates are presented in Table 2.
Number of geocoded cases of syphilis (incidence rate per 100 000 population), by census-tract poverty levela and racial/ethnic group, Massachusetts, 2001-2013b
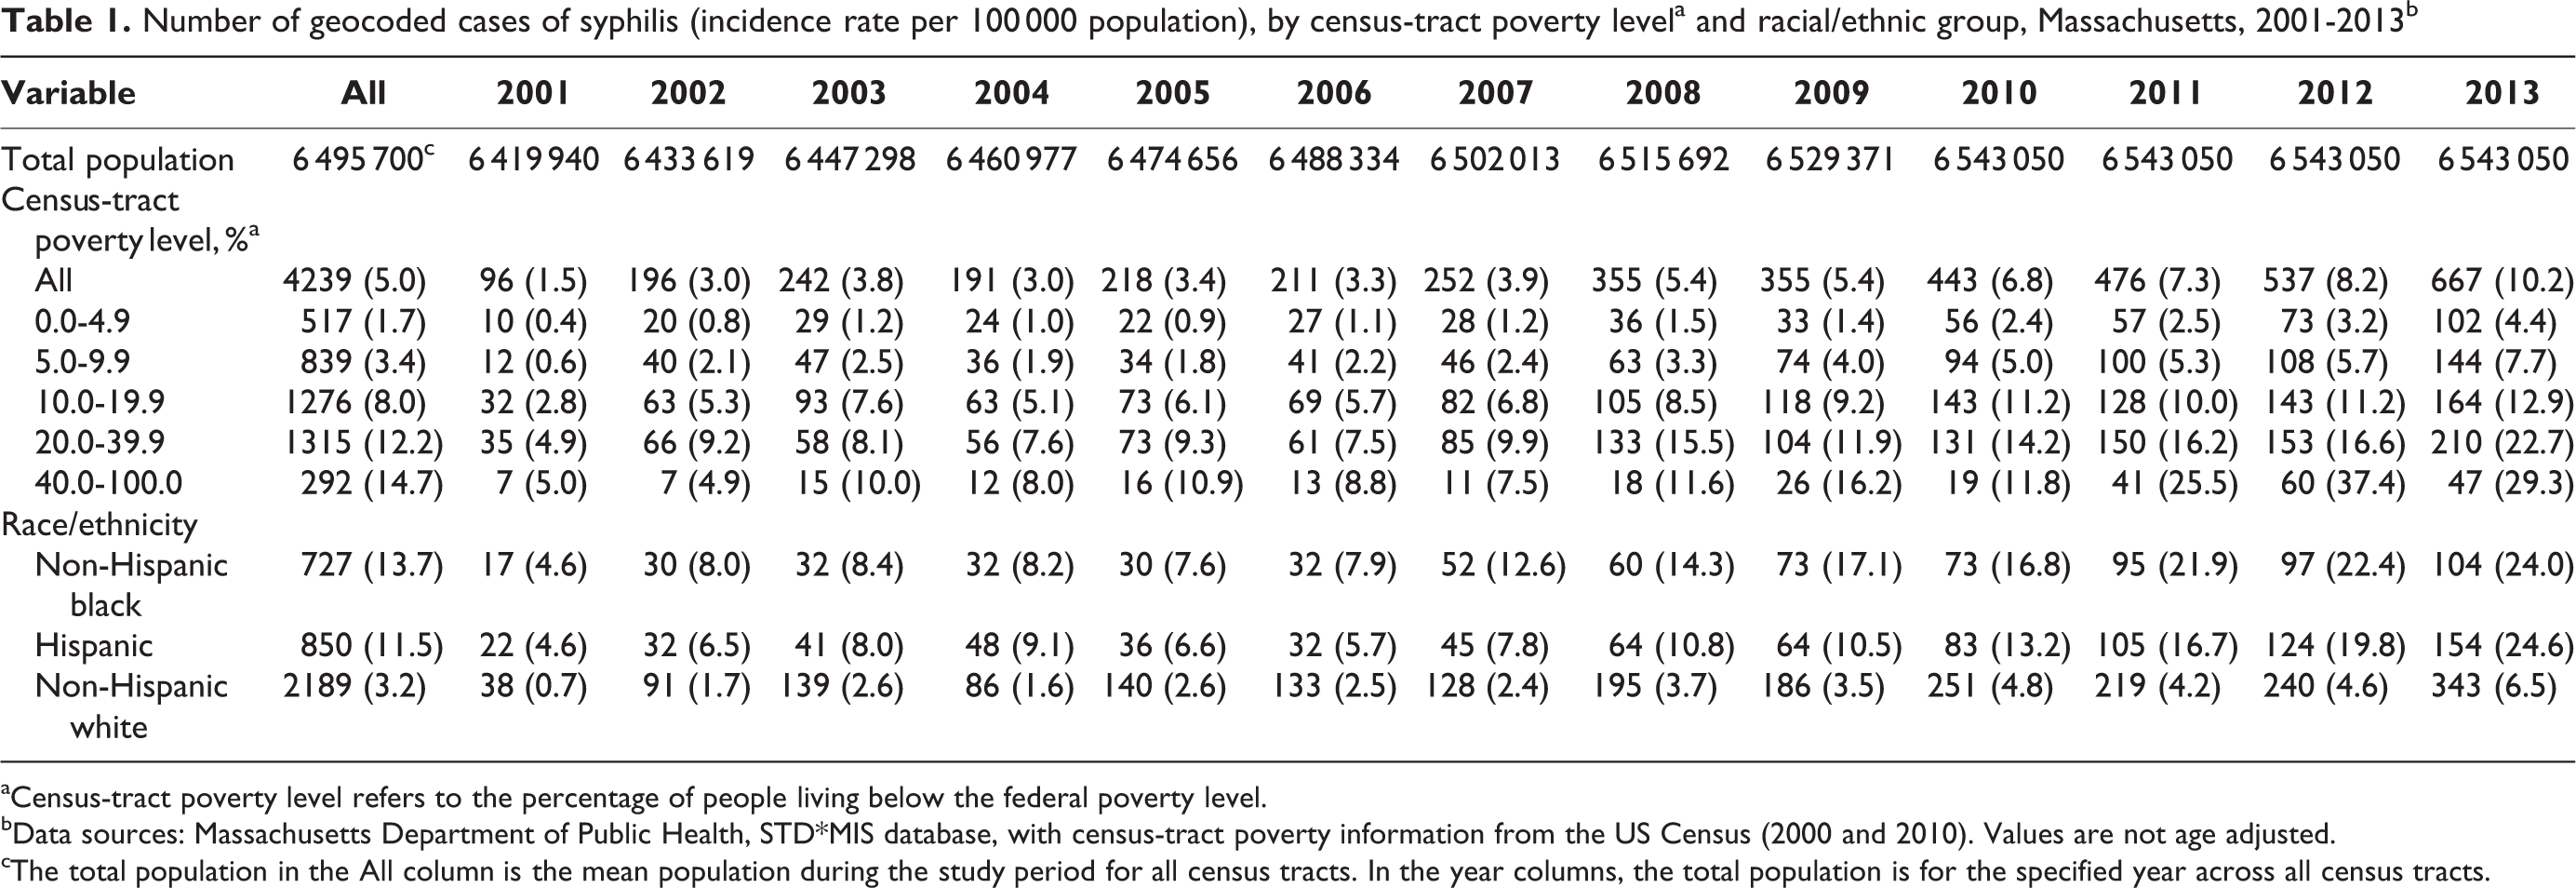
aCensus-tract poverty level refers to the percentage of people living below the federal poverty level.
bData sources: Massachusetts Department of Public Health, STD*MIS database, with census-tract poverty information from the US Census (2000 and 2010). Values are not age adjusted.
cThe total population in the All column is the mean population during the study period for all census tracts. In the year columns, the total population is for the specified year across all census tracts.
Age-adjusted incidence rates of syphilis, by census-tract poverty levela, among the total population, Massachusetts, 2001-2013b
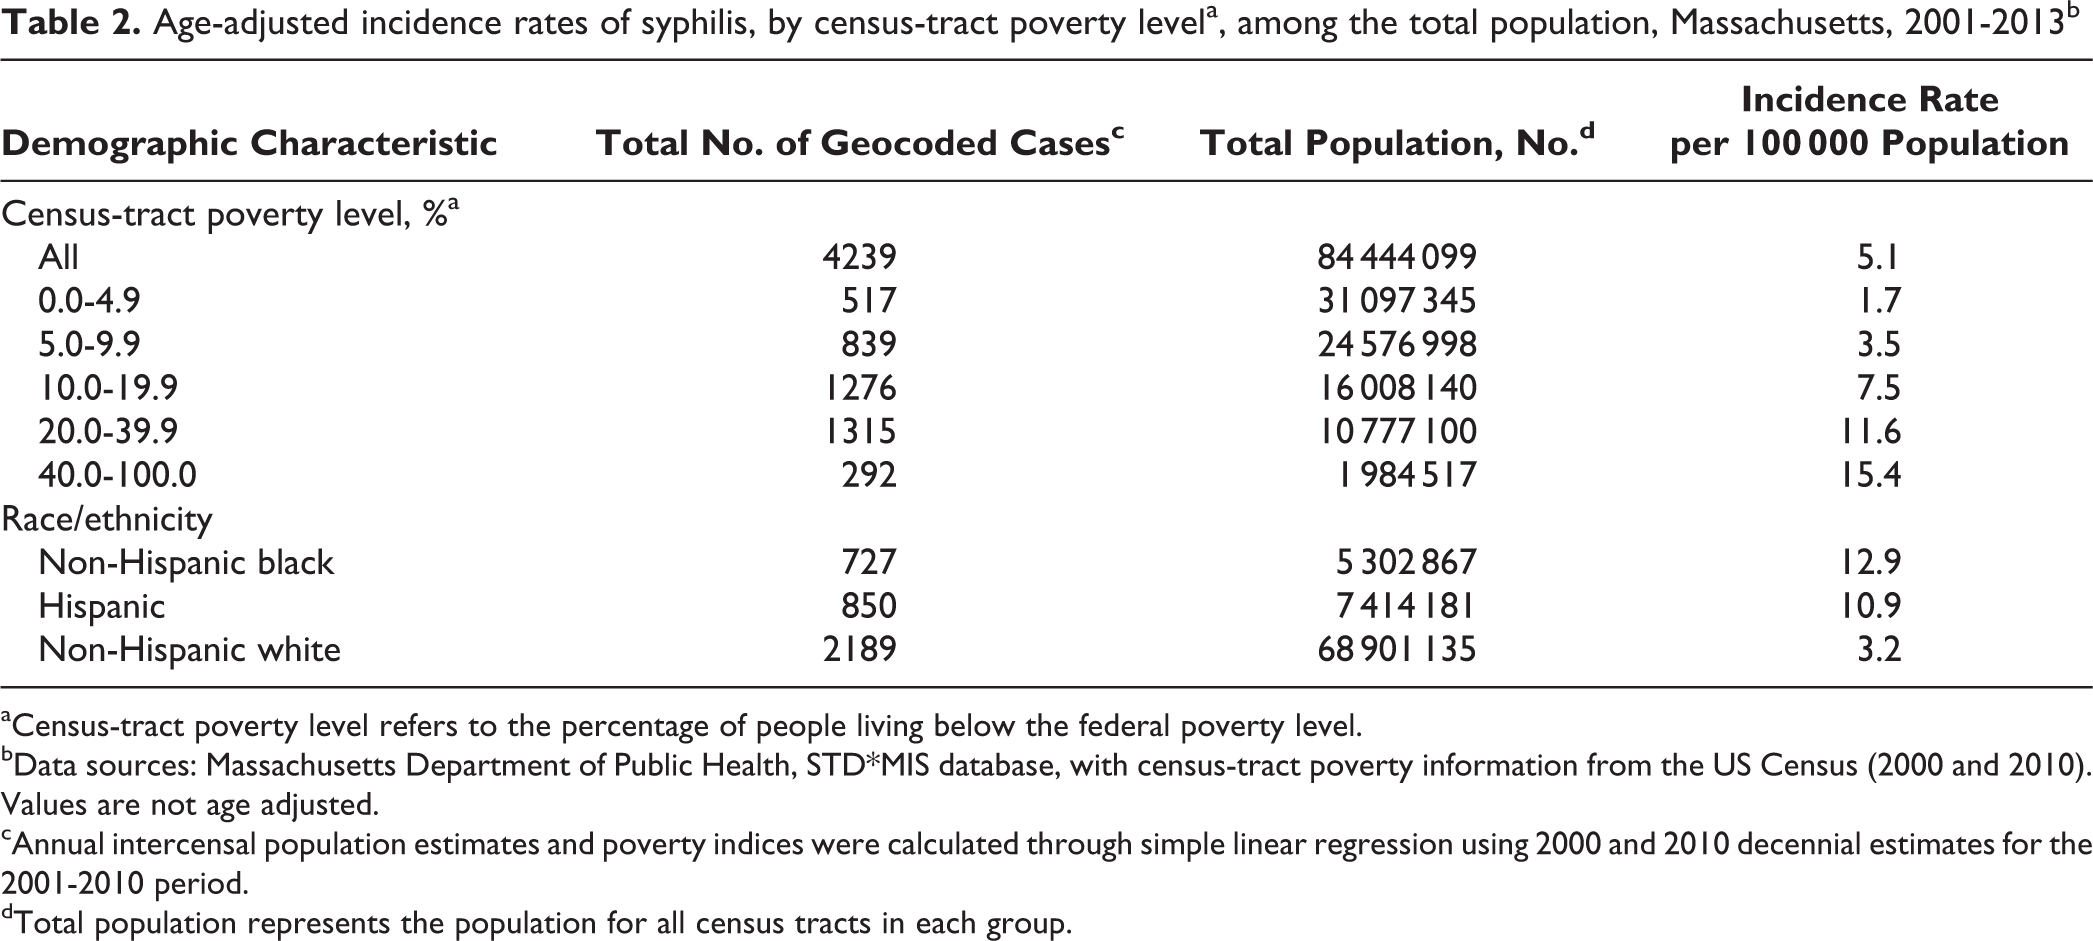
aCensus-tract poverty level refers to the percentage of people living below the federal poverty level.
bData sources: Massachusetts Department of Public Health, STD*MIS database, with census-tract poverty information from the US Census (2000 and 2010). Values are not age adjusted.
cAnnual intercensal population estimates and poverty indices were calculated through simple linear regression using 2000 and 2010 decennial estimates for the 2001-2010 period.
dTotal population represents the population for all census tracts in each group.
Geocoding Results
Of 4472 reported cases of syphilis, 233 records (5%) were not geocodable. Of these 233 deleted records, 63 (27%) had addresses that were not geocodable, 18 (8%) represented homeless people, 15 (6%) reflected incarcerated people, 70 (30%) had post office boxes listed as addresses, 62 (27%) had incomplete address information, and 5 (2%) had no address information. The temporal and regional distribution of these deleted cases revealed no pattern indicating any distortion that their removal would introduce. Geocoding rates were consistent among census tract poverty groups, indicating no disproportionately undergeocoded census tracts. Geocoding rates were also consistent among sex, race/ethnicity, and age categories: 95% of male and 95% of female records were geocoded; 95% of Hispanic, 95% of non-Hispanic black, and 95% of non-Hispanic white records; and 95%, 95%, 95%, and 97% of records from people aged <24, 25-44, 45-64, and ≥65, respectively. Overall, 4239 (95%) of the records were geocoded.
Syphilis Incidence Rates in Relation to Census Tract Socioeconomic Measures
From 2001 to 2013, the age-adjusted syphilis incidence rate was consistently higher in poorer census tracts than in more affluent census tracts (Table 2). In census tracts with 0.0%-4.9% to 40.0%-100.0% of the population living below the FPL, the syphilis incidence rate increased from 1.7 to 15.4 per 100 000 population. Rate disparities in syphilis incidence rates by census tract poverty group persisted over time, as syphilis incidence rates increased in all census tracts from 2001 to 2013 (Figure 1).
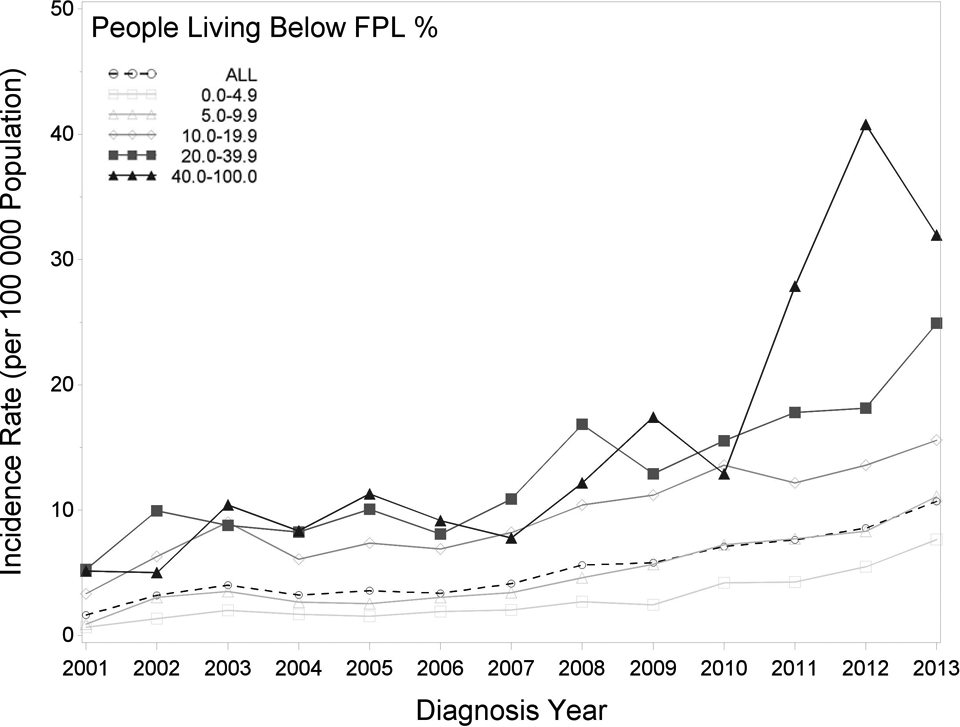
Age-adjusted incidence rates of syphilis infection, by federal poverty level (FPL) and diagnosis year, in the total population, Massachusetts, 2001-2013
Impact of Socioeconomic Position, Race/Ethnicity, Sex, and County on Syphilis Incidence Rates
The highest syphilis incidence rates for each racial/ethnic group (non-Hispanic black, Hispanic, and non-Hispanic white) were in the poorest census tracts, and the highest rate was among non-Hispanic black people, with a rate of 21.4 per 100 000 population in the poorest census tracts (Figure 2). The highest incidence rates among men and women were in the poorest census tracts, but overall syphilis incidence rates were higher among men (9.4 per 100 000 population) than women (0.9 per 100 000 population; Figure 3).
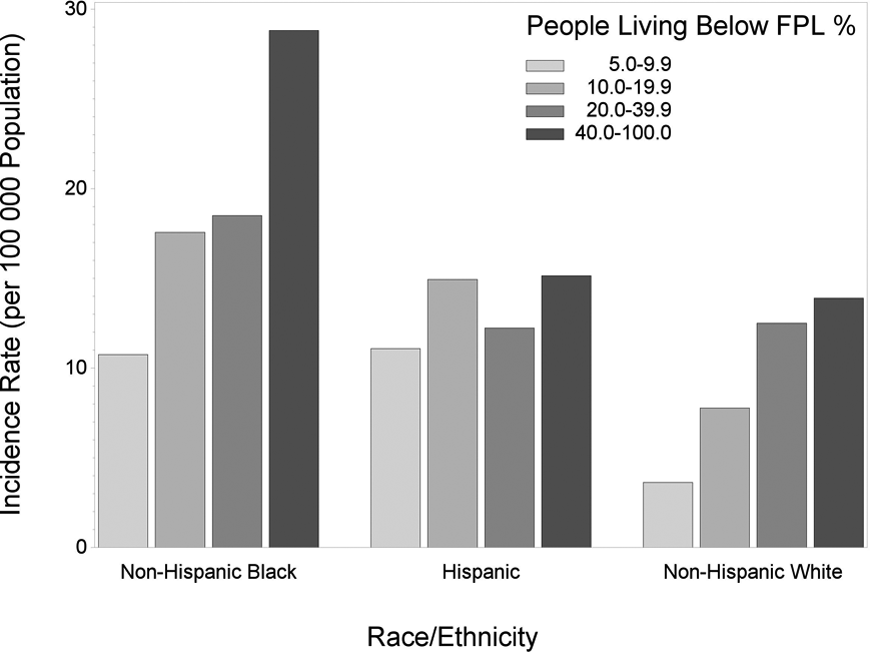
Age-adjusted incidence rates of syphilis infection, by federal poverty level (FPL) and race/ethnicity, in the total population, Massachusetts, 2001-2013
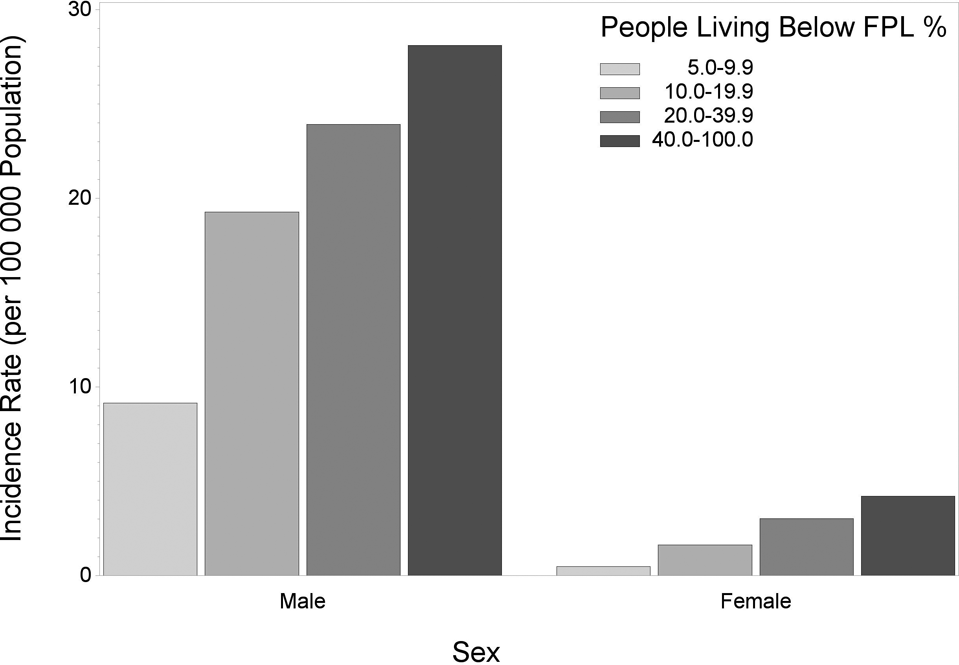
Age-adjusted incidence rates of syphilis infection, by federal poverty level (FPL) and sex, in the total population, Massachusetts, 2001-2013
The increase in the rate of reported syphilis from 2010 to 2013 in the poorest census tracts corresponded with an almost 4-fold increase in syphilis cases in one part of the state, Hampden County, during that time. Syphilis cases in that region were concentrated in 2 urban centers with lower median household incomes than the rest of the state: $35 163 and $34 961 compared with $66 658 statewide during 2008-2012. 23,24 Hampden County had a syphilis outbreak during 2010-2012. However, when Hampden County data were removed, the same trends persisted statewide.
Discussion
Syphilis incidence rates increased statewide in Massachusetts from 2001 to 2013, across all racial/ethnic groups, and by area-level analysis in census tracts of all FPL groups. Racial/ethnic disparities persisted over time; the syphilis incidence rate was higher among men; and during 2010-2012, one county had a much bigger increase than any other county in cases of syphilis. Stratification of area-level analysis by sex and race/ethnicity showed the combined impact of poverty, race/ethnicity, and sex on syphilis incidence rates. The highest syphilis incidence rates were among non-Hispanic black and Hispanic men aged 25-44 in the poorest census tracts.
Some parallels exist between the rates of syphilis incidence during this time period and the incidence rates of AIDS. Both show variation by the level of poverty. An analysis of Massachusetts AIDS cases from 1988 to 1994 indicated that the incidence rate of AIDS increased with increasing levels of poverty. The cumulative incidence rate of AIDS was almost 7 times higher among residents of census block groups in which ≥40% of the population was below the FPL than among residents of census block groups in which <2% of the population was below the FPL for 1988-1994. 11 More recent analyses of Massachusetts HIV surveillance data indicated that HIV infection incidence rates declined overall from 2001 to 2010, even among those in census tracts with the highest proportion of the population living below the FPL. Although the differences between the incidence rates for the richest and poorest groups decreased during this 10-year period, disparities in HIV infection incidence rates by socioeconomic status remained. 25 Syphilis is a risk correlate and a risk factor for HIV infection, 6,26,27 and 34% of people with infectious syphilis in Massachusetts in 2013 self-reported testing positive for HIV. Syphilis and HIV prevention activities should be targeted to people living in poor neighborhoods.
Limitations
This study had several limitations. The use of 2010 decennial census population denominators for the years 2011-2013 may have been a limitation because population changes in the census tracts may have occurred after 2010 that were not accounted for in the 2010 denominator. Extrapolation beyond 2010 could have introduced bias. However, Massachusetts has had stable population growth in recent years. Another limitation was the inability to accurately quantify changes in the poverty groups of census tracts over time. Poverty and population were interpolated, which introduced change and therefore caused an estimation of changes in the poverty groups of census tracts. In addition, the relatively small number of cases in the group with the highest poverty levels, compared with the other 4 groups, may have influenced the rate ratio.
Misclassification of demographic characteristics of those with syphilis was possible, but syphilis surveillance data were more complete than state surveillance data on the other sexually transmitted infections because of the health department’s direct, active follow-up on all syphilis cases. As such, misclassification of race/ethnicity, age, or address was unlikely. Records that failed to geocode or were deleted for other reasons may have affected the outcome of analysis even though the distribution of excluded cases did not appear to relate to key parameters or level of analysis.
Conclusion
Massachusetts underwent health insurance reform in 2006, before passage of the Patient Protection and Affordable Care Act of 2009. This analysis spanned the years before and after state health insurance reform. In 2004-2005, 89% of the state’s population was insured. 28 After health insurance reform, 96% of the state’s population was insured. 29 This analysis emphasized that access to insurance coverage alone is not enough to control syphilis. Future research is warranted to examine why syphilis incidence rates increased so sharply among men who have sex with men and in one county in Massachusetts during this time. The state health department investigated the outbreak and collaborated with providers in that county on an intervention to increase testing and treatment. Future research should address whether or not the rapid diffusion of technology, such as smartphone applications to meet sexual partners, may have played a role and if the recession of 2007-2009 affected infection rates.
This analysis showed the feasibility of applying methods for using area-level measures of poverty to explore the epidemiology of social determinants and diseases such as syphilis. After completion of this analysis, the Massachusetts Department of Public Health transitioned to a new surveillance database for STDs that automates geocoding of all cases with complete address information, making future analyses more efficient. To track changes in disparities over time and to reduce disparities in syphilis incidence rates, measurement of economic disparities using census tract poverty data can be routinized. Although the power to reduce poverty is beyond the scope of STD prevention activities in state and local health departments, census tract poverty analyses can inform the targeting of interventions that make progress toward reducing disparities possible.
Footnotes
Declaration of Conflicting Interests
The authors declared no potential conflicts of interest with respect to the research, authorship, and/or publication of this article.
Funding
The authors disclosed receipt of the following financial support for the research, authorship, and/or publication of this article: This project was supported through 2 Centers for Disease Control and Prevention grants, (1) Funding Opportunity Announcement 09-90202 (Comprehensive STD Prevention Systems Projects, Prevention of STD-Related Infertility, Syphilis Elimination, and Gonococcal Isolate Surveillance Project) and (2) Funding Opportunity Announcement PS14-1402 (Improving Sexually Transmitted Disease Programs Through Assessment, Assurance, Policy Development, and Prevention Strategies).