
Abstract
Objective
The objective was to compare estimates of childhood influenza vaccination across 7 consecutive influenza seasons based on 2 survey systems.
Methods
We analyzed data from the National Health Interview Survey (NHIS) and the National Immunization Survey–Flu (NIS-Flu) using Kaplan-Meier survival analysis to estimate receipt, based on parental report, of at least 1 dose of influenza vaccine among children aged 6 months to 17 years.
Results
We found no significant increasing trend in influenza vaccination coverage among children overall from 2012 to 2018 based on the NHIS or from 2012 to 2019 based on the NIS-Flu. We found 4 seasons with a significant increase in influenza vaccination coverage compared with the previous season (2012-2013 [NHIS, NIS-Flu], 2013-2014 [NIS-Flu], 2017-2018 [NHIS], and 2018-2019 [NIS-Flu]). As of the 2018-2019 season, based on NIS-Flu, influenza vaccination coverage was only 62.6%. Children with health conditions that put them at increased risk for complications from influenza had higher influenza vaccination coverage than children without these health conditions for all the seasons studied except 2014-2015. For all seasons studied, influenza vaccination coverage estimates for children were higher based on NIS-Flu data compared with NHIS data. Trends across seasons and differences in vaccination coverage between age groups were similar between the 2 surveys.
Conclusions
Influenza vaccination coverage among children appears to have plateaued. Only about half of the children in the United States were vaccinated against influenza. Improvements in measurement of influenza vaccination and development and review of strategies to increase childhood influenza vaccination coverage are needed.
The evolution of influenza vaccination recommendations for children in the United States from 1960 through the 2010-2011 influenza season has been described. 1 Since the 2010-2011 influenza season, annual influenza vaccination has been and continues to be recommended by the Advisory Committee on Immunization Practices for all people aged 6 months or older. 2 However, some details of the influenza recommendations for children changed between the 2012-2013 and 2018-2019 influenza seasons. Notable revisions included changes in the algorithm for determining which children require 2 doses rather than 1 dose to be fully vaccinated and in the availability of new quadrivalent vaccine formulations for children, as well as repeated changes in recommendations for use of live-attenuated influenza vaccine. 3 -10
Measuring influenza vaccination rates is important for determining progress in protecting people from the influenza virus. A study among people aged 6 months or older in the United States showed that influenza vaccination during the 2017-2018 season prevented an estimated 7.1 million illnesses, 3.7 million medical visits, 109 000 hospitalizations, and 8000 deaths. 11 The National Health Interview Survey (NHIS) and the National Immunization Survey–Flu (NIS-Flu) are the primary surveys used to measure influenza vaccination coverage among children in the United States. The aims of this study were to (1) examine estimates of childhood influenza vaccination coverage over time by presence of health conditions that put the child at high risk for complications from influenza, by age group and by race and ethnicity, and (2) compare estimates from the NHIS and NIS-Flu. The estimates from this study, combined with estimates from our previous study, provide childhood influenza vaccination coverage estimates for all influenza seasons since 2004. 1
Methods
The NHIS is conducted by in-person interviews of a sample of the civilian, noninstitutionalized population of the United States throughout the year using an area probability design. For each family in a household, a family respondent answers a few questions about himself or herself and others in the family; then, a sample adult and sample child are randomly selected from each family. A knowledgeable adult, most often the parent or guardian (hereinafter referred to as “parent” for succinctness) of the child, responds on behalf of the child. 12 The NHIS began collecting data on parental report of childhood influenza vaccination in 2005. 13 This study includes NHIS data from 2012 through 2018. The response rates for the NHIS child module for years 2012 through 2018 ranged from 59.2% to 69.7%. 12 The NHIS assessed influenza vaccination status of the child with the following questions:
“During the past 12 months, has [child] had a flu vaccination? A flu vaccination is usually given in the fall and protects against influenza for the flu season.”
“During what month and year did [child] receive [his/her] most recent flu vaccine?”
“Was this a shot, or was it a vaccine sprayed in the nose?” 14
The NHIS is considered the most representative source for estimates of influenza vaccination coverage among children aged 6 months to 17 years and is the data source for influenza vaccination estimates for Healthy People. 15 However, NHIS sample sizes do not allow for single-season state-level vaccination coverage estimates, and data releases are not timely enough to enable the reporting of estimates before the beginning of the next influenza season.
The NIS-Flu is a national, list-assisted, random-digit–dialed landline and cellular telephone survey of households with children aged 6 months to 17 years conducted each influenza season. 16,17 Beginning in 2018, the NIS-Flu discontinued landline telephone interviews, which represented only 8% of interviews by 2017, and became a cellular telephone–only survey. The response rates for the 2012-2013 through 2018-2019 influenza seasons ranged from 48% to 65% for the landline telephone sample and 23% to 39% for the cellular telephone sample. 18,19 The NIS-Flu assessed influenza vaccination status with the following questions:
“Since July 1, 2018 [year varied for each influenza season], has [child] had a flu vaccination? There are 2 types of flu vaccinations. One is a shot and the other is a spray, mist, or drop in the nose.”
“During what month did [child] receive [his/her] first dose of the flu vaccine since July 1?”
National- and state-level estimates of influenza vaccination coverage for children based on parental report of vaccination status from the NIS-Flu are reported by early autumn of the subsequent influenza season. 19
Analysis of Influenza Vaccination Data
We used Kaplan-Meier survival analysis for both the NHIS and NIS-Flu to calculate the percentage of children vaccinated with at least 1 dose of influenza vaccine, where vaccination month was used to define the “event” variable and interview date to define the “censoring” variable. We included influenza vaccinations received from July through May. When the child was reported to have been vaccinated but was missing data on the month of vaccination, we imputed the month from donor pools matched for week (month for NHIS) of interview, age group, state (region for NHIS) of residence, and race/ethnicity. The percentages imputed ranged from 10.7% to 11.8% for the 2012-2013 through 2017-2018 influenza seasons for the NHIS and from 12.5% to 21.8% for the 2012-2013 through 2018-2019 influenza seasons for the NIS-Flu. For both surveys, analyses included data from interviews conducted from October through June for all seasons studied. We assessed influenza vaccination coverage overall and by child risk status (high risk or non–high risk), age group (6-23 months, 2-4 years, 5-12 years, and 13-17 years), and race/ethnicity (Hispanic, non-Hispanic white, non-Hispanic black, and non-Hispanic other or multiple races). Data on the presence of health conditions that placed the child at high risk for complications from influenza are available only from the NHIS; the NIS-Flu does not include questions on health conditions. Based on Advisory Committee on Immunization Practices recommendations and the questions available, we defined high-risk status based on parental report of 1 or more of the following: ever being told by a physician that the child had cystic fibrosis, sickle cell anemia, diabetes, congenital heart disease, other heart conditions, cerebral palsy, muscular dystrophy, and seizures; or reporting an asthma episode or attack in the past 12 months (ie, current asthma). We based the child’s race/ethnicity in this study on parental report; children of Hispanic ethnicity may be of any race.
For the NHIS, data were weighted to represent the civilian noninstitutionalized population of children in the United States; data were weighted for nonresponse but not for households without telephones. 12 For the NIS-Flu, data were weighted to represent the population of children in the United States, for households without telephones, and for nonresponse bias. 20 We conducted all analyses with SAS version 9.4 (SAS Institute Inc) and SUDAAN version 11.0.3 (RTI International), and we tabulated data as point estimates and half-widths of 95% CIs. We performed tests for linear trend on the national estimates and overall state-level estimates by using a weighted linear regression on the season-specific estimates using season number as the independent variable and weights as the inverse of the estimated variance of the estimated vaccination coverage; we interpreted the slope of these regressions as the average annual change in influenza vaccination coverage. We also compared NHIS and NIS-Flu estimates overall, by age group, and by race/ethnicity. We used 2-tailed t tests to conduct pairwise comparisons of estimates, with significance set at α = .05.
Institutional review board approval for the NIS-Flu was obtained from the National Center for Immunization and Respiratory Diseases, Centers for Disease Control and Prevention, and NORC at the University of Chicago. Institutional review board approval for the NHIS was obtained from the National Center for Health Statistics, Centers for Disease Control and Prevention.
Results
Trends in Influenza Vaccination Coverage Overall
For NHIS, the average change in influenza vaccination coverage estimates across seasons among all children aged 6 months to 17 years was not significantly different from 0 based on the slope of the linear trend line, indicating stable coverage during the 2012-2013 through 2017-2018 influenza seasons (slope = 0.1; 95% CI half-width, 0.7; P = .88) (Table 1). The result from the NIS-Flu was similar during the 2012-2013 through 2018-2019 influenza seasons (slope = 0.5; 95% CI half-width, 0.6; P = .13) (Table 2). We found 4 seasons with a significant increase compared with the previous season: 2012-2013 (NHIS, NIS-Flu), 2013-2014 (NIS-Flu), 2017-2018 (NHIS), and 2018-2019 (NIS-Flu). The most recent influenza vaccination coverage estimate for the 2018-2019 influenza season from the NIS-Flu showed that 62.6% of children were vaccinated, a significant increase of 4.7 percentage points from 57.9% in 2017-2018.
Influenza vaccination coverage (at least 1 dose) among children aged 6 months to 17 years, by influenza season, risk status, age, and racial/ethnic group, National Health Interview Survey (NHIS), United States, 2012-2018 a
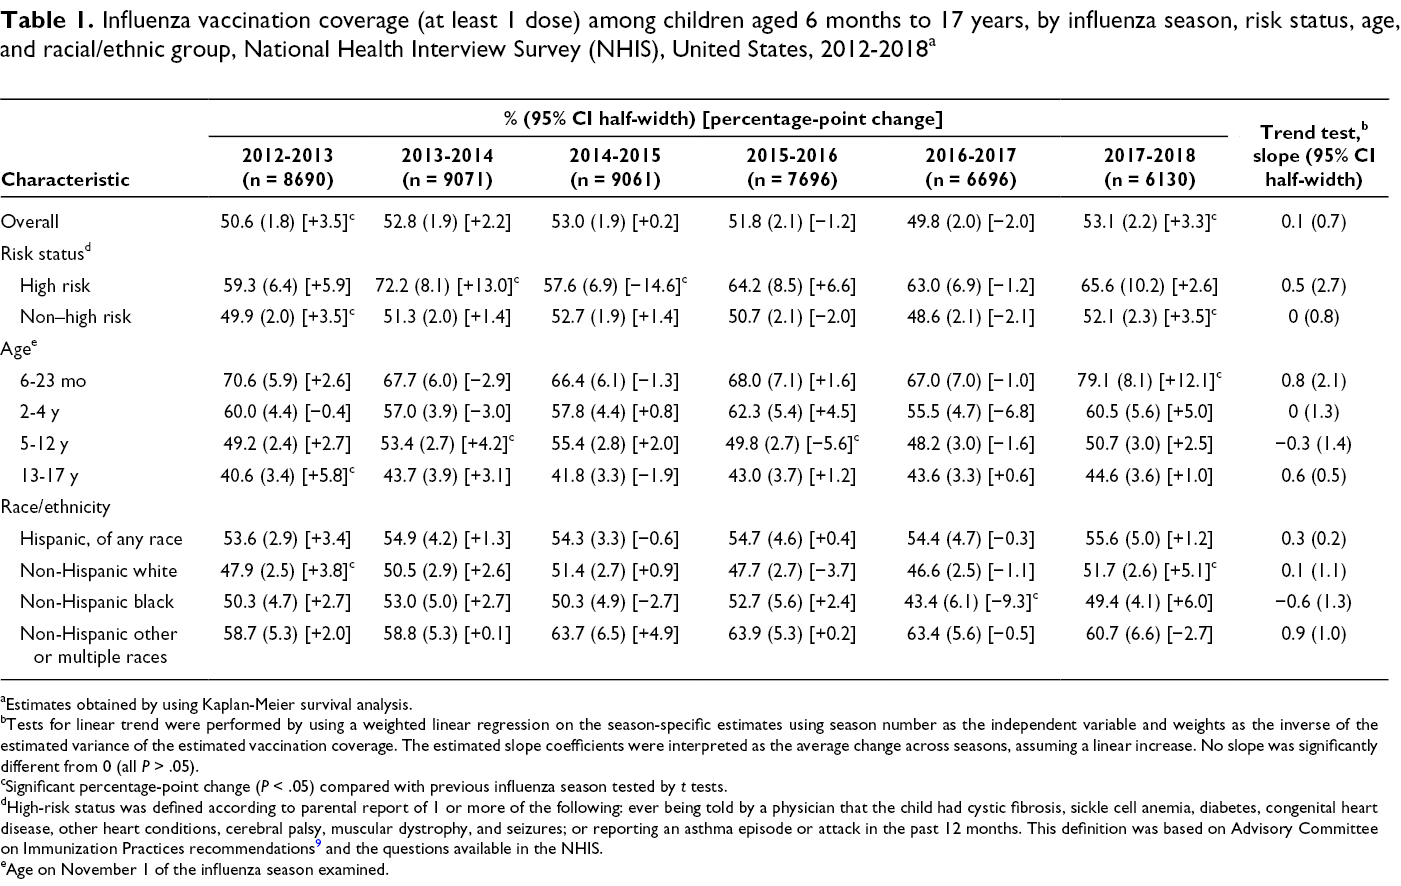
aEstimates obtained by using Kaplan-Meier survival analysis.
bTests for linear trend were performed by using a weighted linear regression on the season-specific estimates using season number as the independent variable and weights as the inverse of the estimated variance of the estimated vaccination coverage. The estimated slope coefficients were interpreted as the average change across seasons, assuming a linear increase. No slope was significantly different from 0 (all P > .05).
cSignificant percentage-point change (P < .05) compared with previous influenza season tested by t tests.
dHigh-risk status was defined according to parental report of 1 or more of the following: ever being told by a physician that the child had cystic fibrosis, sickle cell anemia, diabetes, congenital heart disease, other heart conditions, cerebral palsy, muscular dystrophy, and seizures; or reporting an asthma episode or attack in the past 12 months. This definition was based on Advisory Committee on Immunization Practices recommendations 9 and the questions available in the NHIS.
eAge on November 1 of the influenza season examined.
Influenza vaccination coverage (at least 1 dose) among children aged 6 months to 17 years, by influenza season, age, and racial/ethnic group, National Immunization Survey–Flu (NIS-Flu), United States, 2012-2019 a
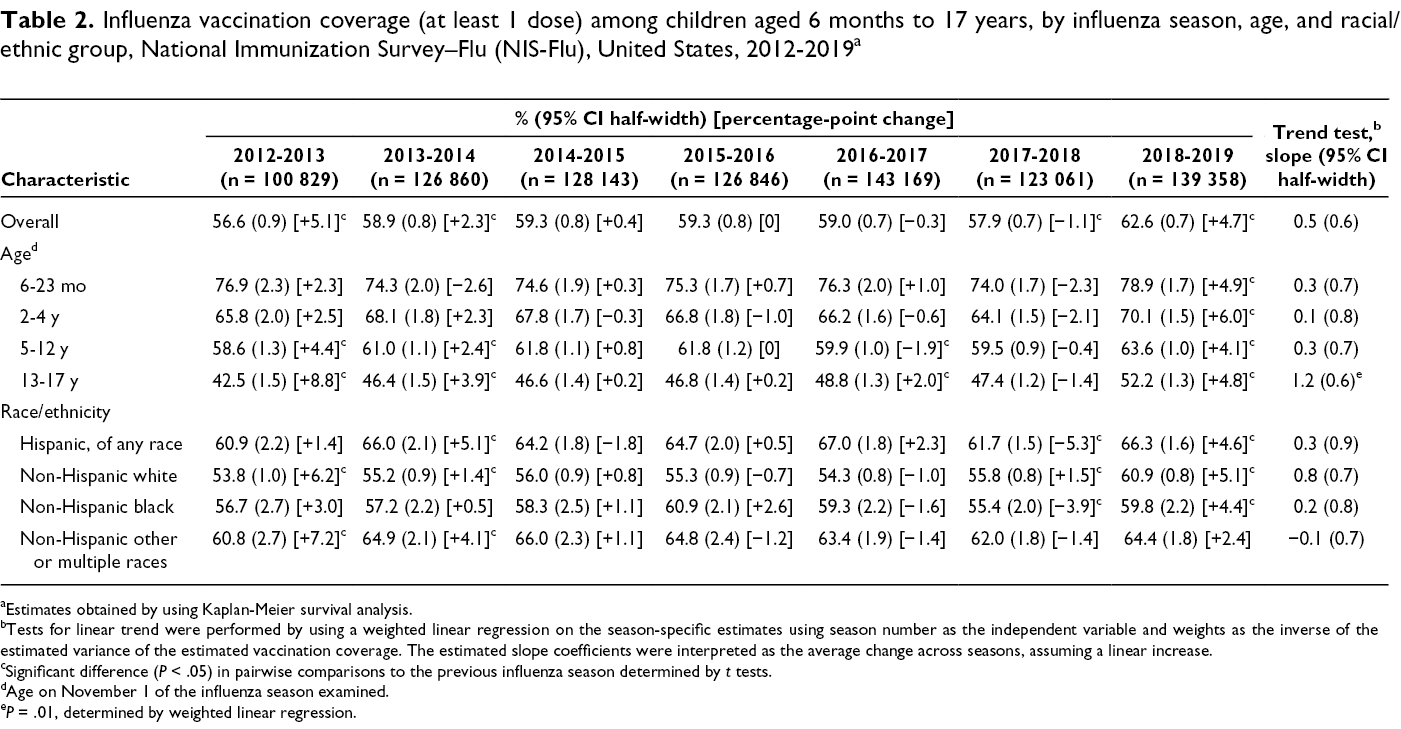
aEstimates obtained by using Kaplan-Meier survival analysis.
bTests for linear trend were performed by using a weighted linear regression on the season-specific estimates using season number as the independent variable and weights as the inverse of the estimated variance of the estimated vaccination coverage. The estimated slope coefficients were interpreted as the average change across seasons, assuming a linear increase.
cSignificant difference (P < .05) in pairwise comparisons to the previous influenza season determined by t tests.
dAge on November 1 of the influenza season examined.
e P = .01, determined by weighted linear regression.
The tests for linear trend in states during the 2012-2013 through 2018-2019 influenza seasons using NIS-Flu data identified 12 states with a significant increase in vaccination coverage, 1 state with a significant decrease, and the remaining states with no significant change. The states with a significant average annual increase (slope) were Iowa (slope = 1.8), Pennsylvania (slope = 1.3), Connecticut (slope = 1.1), New Jersey (slope = 1.1), Illinois (slope = 1.1), Nebraska (slope = 1.0), New Hampshire (slope = 1.0), Arizona (slope = 0.9), New York (slope = 0.9), Colorado (slope = 0.8), Wisconsin (slope = 0.8), and Michigan (slope = 0.7). Hawaii had a significant average annual decrease (slope = −2.4).
Trends in Influenza Vaccination Coverage by Risk Status, NHIS
We found no significant increases overall in vaccination coverage across the 2012-2013 through 2017-2018 influenza seasons among high-risk children or non–high-risk children (Table 1). Children with health conditions that put them at high risk for complications from influenza had significantly higher influenza vaccination coverage than children without these health conditions for all seasons studied except 2014-2015 (Figure 1). The differences in coverage between high-risk and non–high-risk children ranged from 4.9 percentage points in the 2014-2015 influenza season to 20.9 percentage points in the 2013-2014 influenza season.
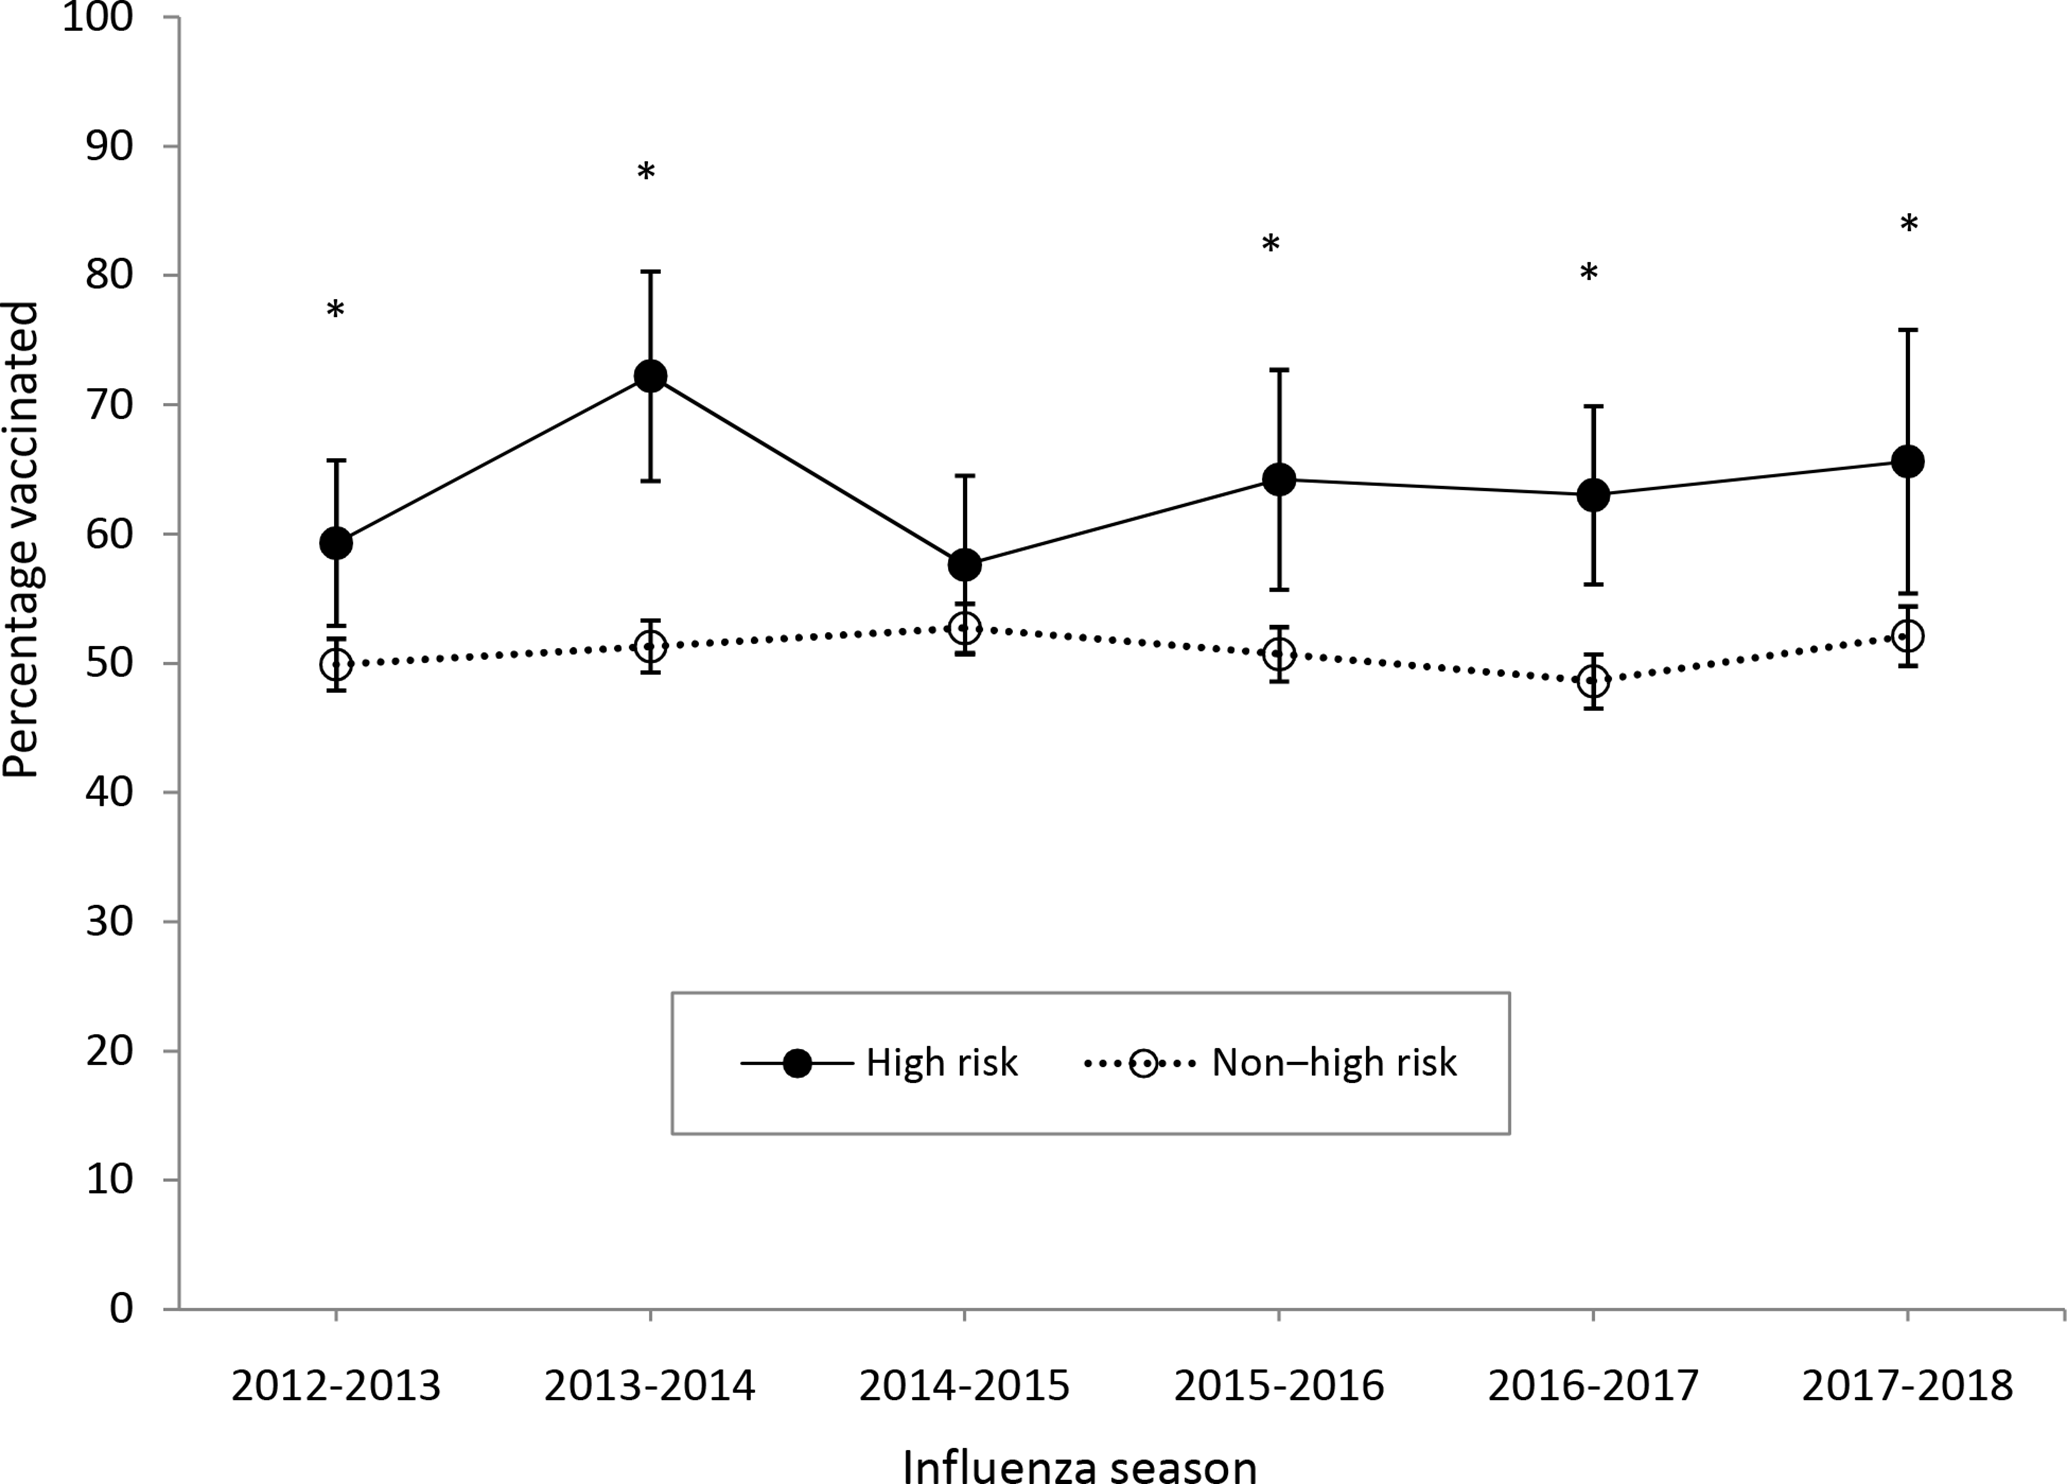
Influenza vaccination coverage (at least 1 dose) among children aged 6 months to 17 years, by influenza season and risk status, National Health Interview Survey (NHIS), United States, 2012-2018. Estimates were obtained by using Kaplan-Meier survival analysis. Based on Advisory Committee on Immunization Practices recommendations and the questions available in NHIS, high risk was defined as parental report of 1 or more of the following: ever being told by a physician that the child had cystic fibrosis, sickle cell anemia, diabetes, congenital heart disease, other heart conditions, cerebral palsy, muscular dystrophy, and seizures; or reporting an asthma episode or attack in the past 12 months. Error bars indicate 95% CIs. Asterisks represent significant differences (P < .05) based on comparison of high-risk with non–high-risk estimate.
Trends in Influenza Vaccination Coverage by Age Group
Results of the trend tests on NHIS estimates by age group indicated no significant increases overall in coverage from the 2012-2013 through 2017-2018 influenza seasons for any age group (Table 1). Results of the trend tests on NIS-Flu estimates showed similar results by age group from the 2012-2013 through 2018-2019 influenza seasons with 1 exception: we found a significant increase overall among children aged 13-17 years—an average seasonal increase of 1.2 percentage points.
Children aged 6-23 months had significantly higher influenza vaccination coverage compared with the older age groups in all seasons studied and according to both surveys except for 2015-2016. In that season, NHIS estimates of coverage among children aged 6-23 months were not significantly different from coverage among children aged 2-4 years (Figure 2). Children aged 2-4 years had significantly higher coverage than older children in both surveys, except for the 2013-2014 and 2014-2015 influenza seasons. In those seasons, NHIS estimates of coverage among children aged 2-4 years were not significantly different from estimates of coverage among children aged 5-12 years. Children aged 5-12 years had significantly higher coverage than children aged 13-17 years in each season studied and according to both surveys (Figure 2).
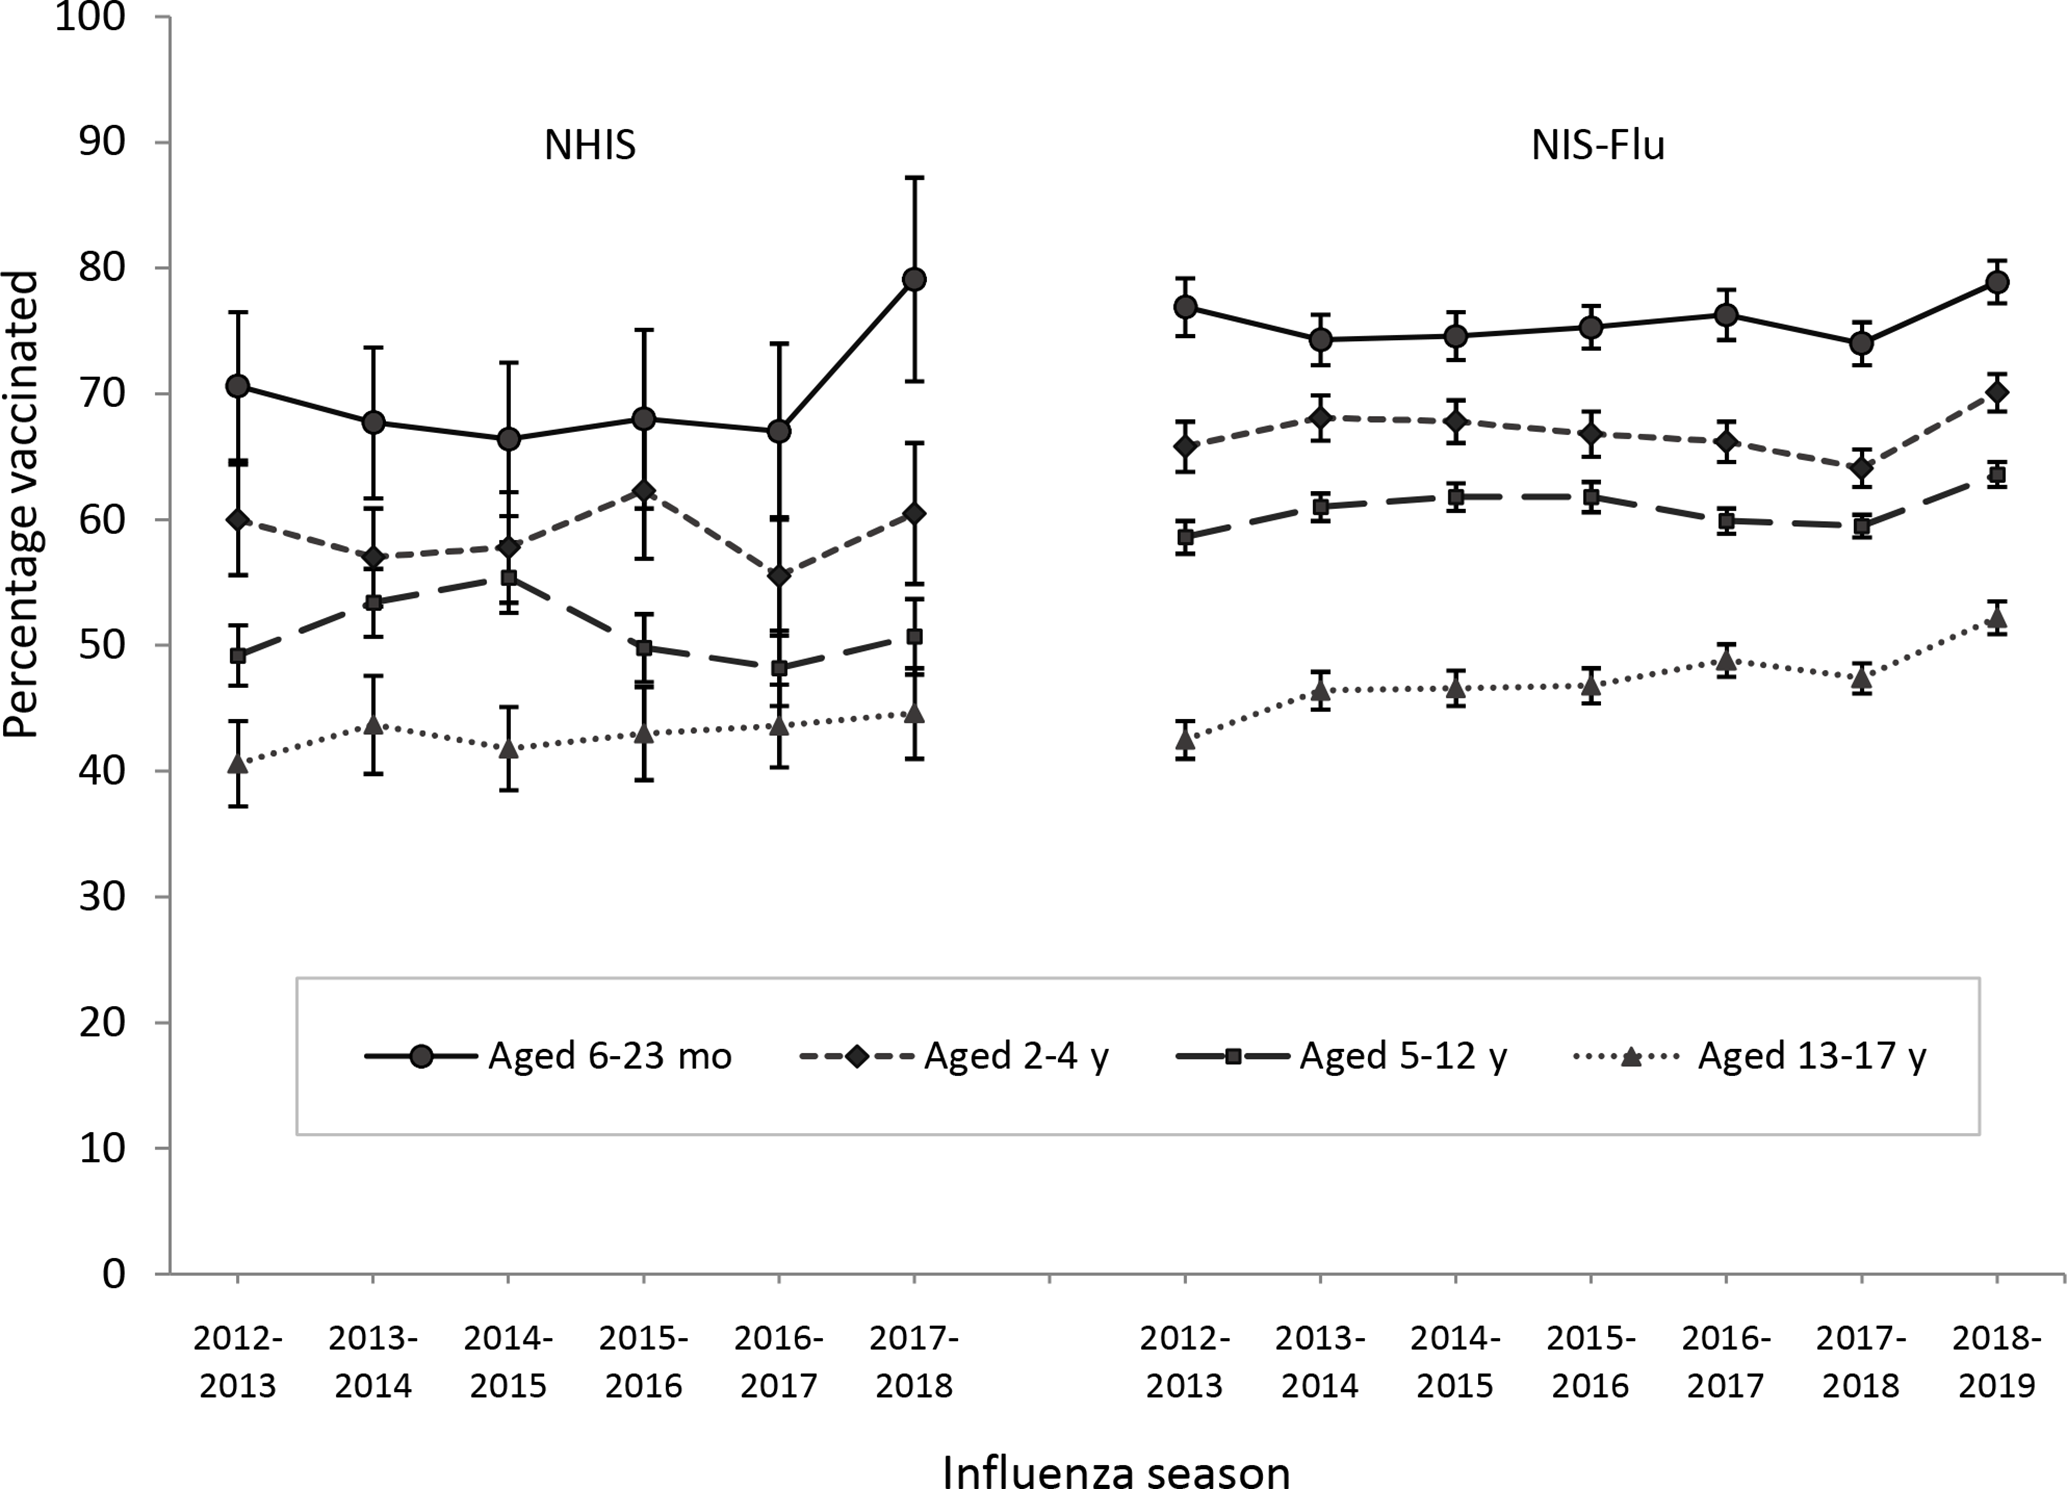
Influenza vaccination coverage (at least 1 dose) among children aged 6 months to 17 years, by influenza season and age group, National Health Interview Survey (NHIS), 2012-2018, and National Immunization Survey–Flu (NIS-Flu), 2012-2019, United States. Estimates were obtained by using Kaplan-Meier survival analysis methods. Age group determined by age of child as of November 1 of the influenza season examined. Error bars indicate 95% CIs.
Trends in Influenza Vaccination Coverage by Race/Ethnicity
Results of the trend tests for both NHIS estimates and NIS-Flu estimates by race/ethnicity indicated no significant increases overall in coverage from the 2012-2013 through 2017-2018 influenza seasons for any racial/ethnic group (Tables 1 and 2).
In all 6 seasons of the NHIS and 4 of the 7 seasons of the NIS-Flu studied, we found no significant differences in influenza vaccination coverage between non-Hispanic black and non-Hispanic white children (Figure 3). In 3 seasons of the NIS-Flu studied (2012-2013, 2015-2016, and 2016-2017), non-Hispanic black children had significantly higher coverage than non-Hispanic white children (Figure 3). Hispanic children had significantly higher influenza vaccination coverage than non-Hispanic white children in 3 of the 6 seasons in the NHIS (2012-2013, 2015-2016, and 2016-2017) and all 7 seasons in the NIS-Flu. Hispanic children had significantly higher influenza vaccination coverage than non-Hispanic black children in 1 of the 6 seasons in the NHIS (2016-2017) and all 7 seasons in the NIS-Flu. Non-Hispanic children of other or multiple races had significantly higher influenza vaccination coverage than non-Hispanic white children in all influenza seasons studied and higher coverage than non-Hispanic black children in all influenza seasons studied, except the 2013-2014 season in the NHIS (Figure 3).
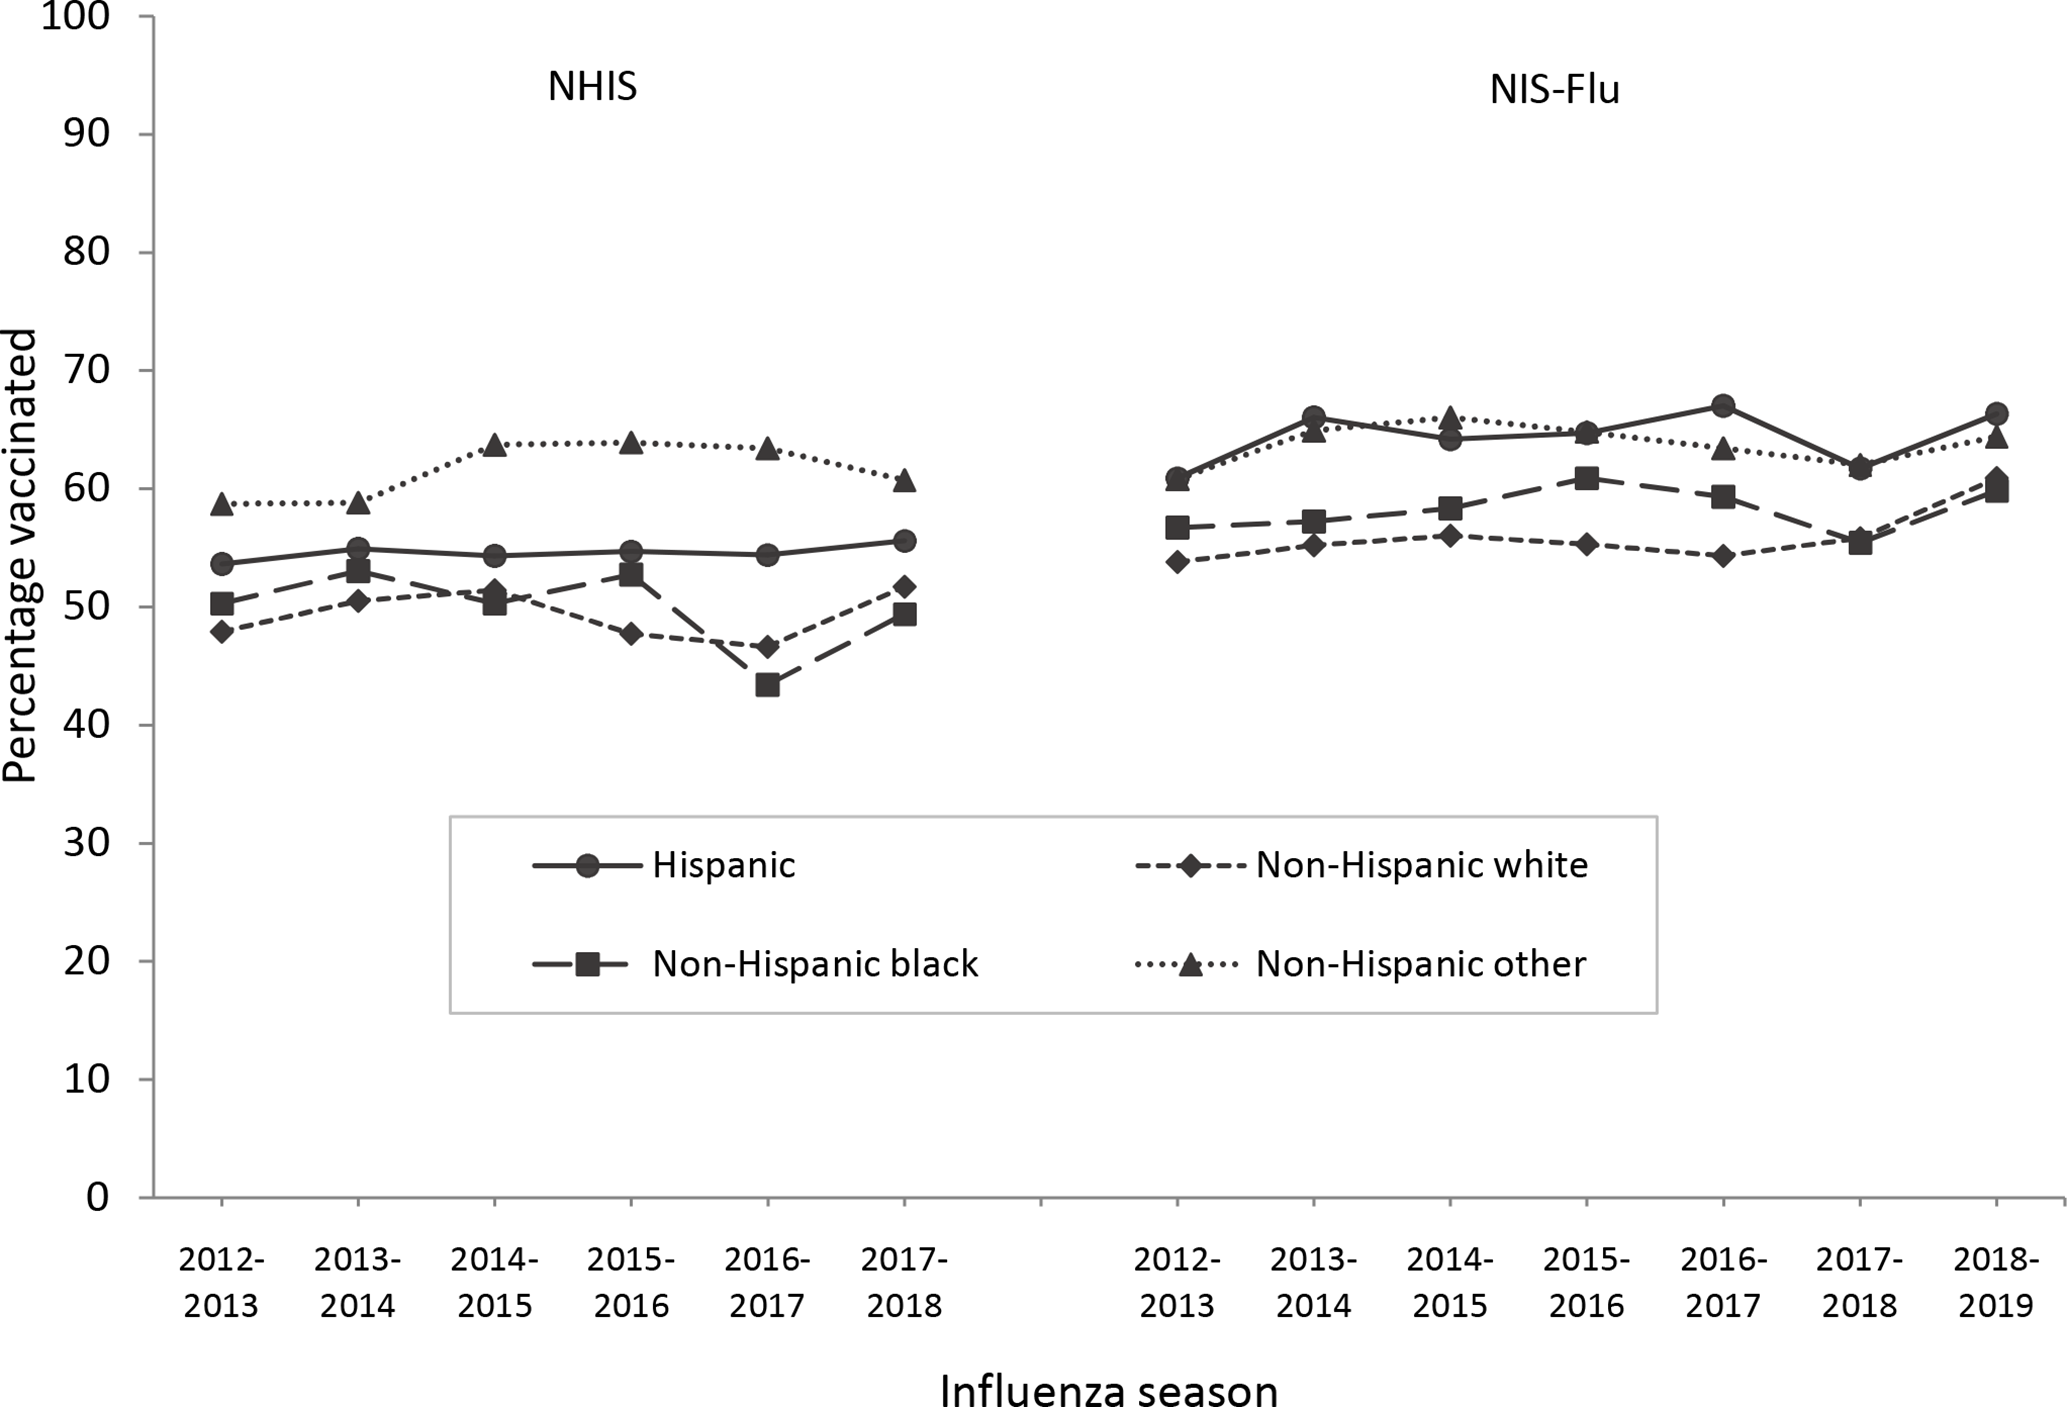
Influenza vaccination coverage (at least 1 dose) among children aged 6 months to 17 years, by influenza season and racial/ethnic group, National Health Interview Survey (NHIS), 2012-2018, and National Immunization Survey–Flu (NIS-Flu), 2012-2019, United States. Estimates obtained by using Kaplan-Meier survival analysis.
Comparison of the NHIS and NIS-Flu
Among children aged 6 months to 17 years overall, in each influenza season from 2012-2013 through 2017-2018, the estimates of influenza vaccination coverage from the NIS-Flu were significantly higher than estimates from the NHIS (Figure 4). The gap between estimates from the 2 surveys increased from 6.0 percentage points in 2012-2013 to 9.2 percentage points in 2016-2017 and then decreased to 4.8 percentage points in 2017-2018. By age group, we found a significantly higher estimated vaccination coverage from the NIS-Flu compared with the NHIS in 2 of the 6 seasons among adolescents aged 13-17 years, 3 seasons among children aged 6-23 months, 4 seasons among children aged 2-4 years, and all 6 seasons among children aged 5-12 years (Figure 4). By racial/ethnic group, the estimates for non-Hispanic children of other or multiple races were most similar between the 2 survey systems; these estimates were different for only 1 season (2013-2014 [6.1 percentage points]). Among non-Hispanic white children, NIS-Flu estimates were from 4.1 to 7.7 percentage points higher than NHIS estimates (P < .05 all seasons). Among Hispanic children, NIS-Flu estimates were from 6.1 to 12.6 percentage points higher than NHIS estimates (P < .05 all seasons). Among non-Hispanic black children, in 4 of the 6 seasons NIS-Flu estimates were significantly larger than NHIS estimates; differences ranged from 6.4 to 15.9 percentage points.
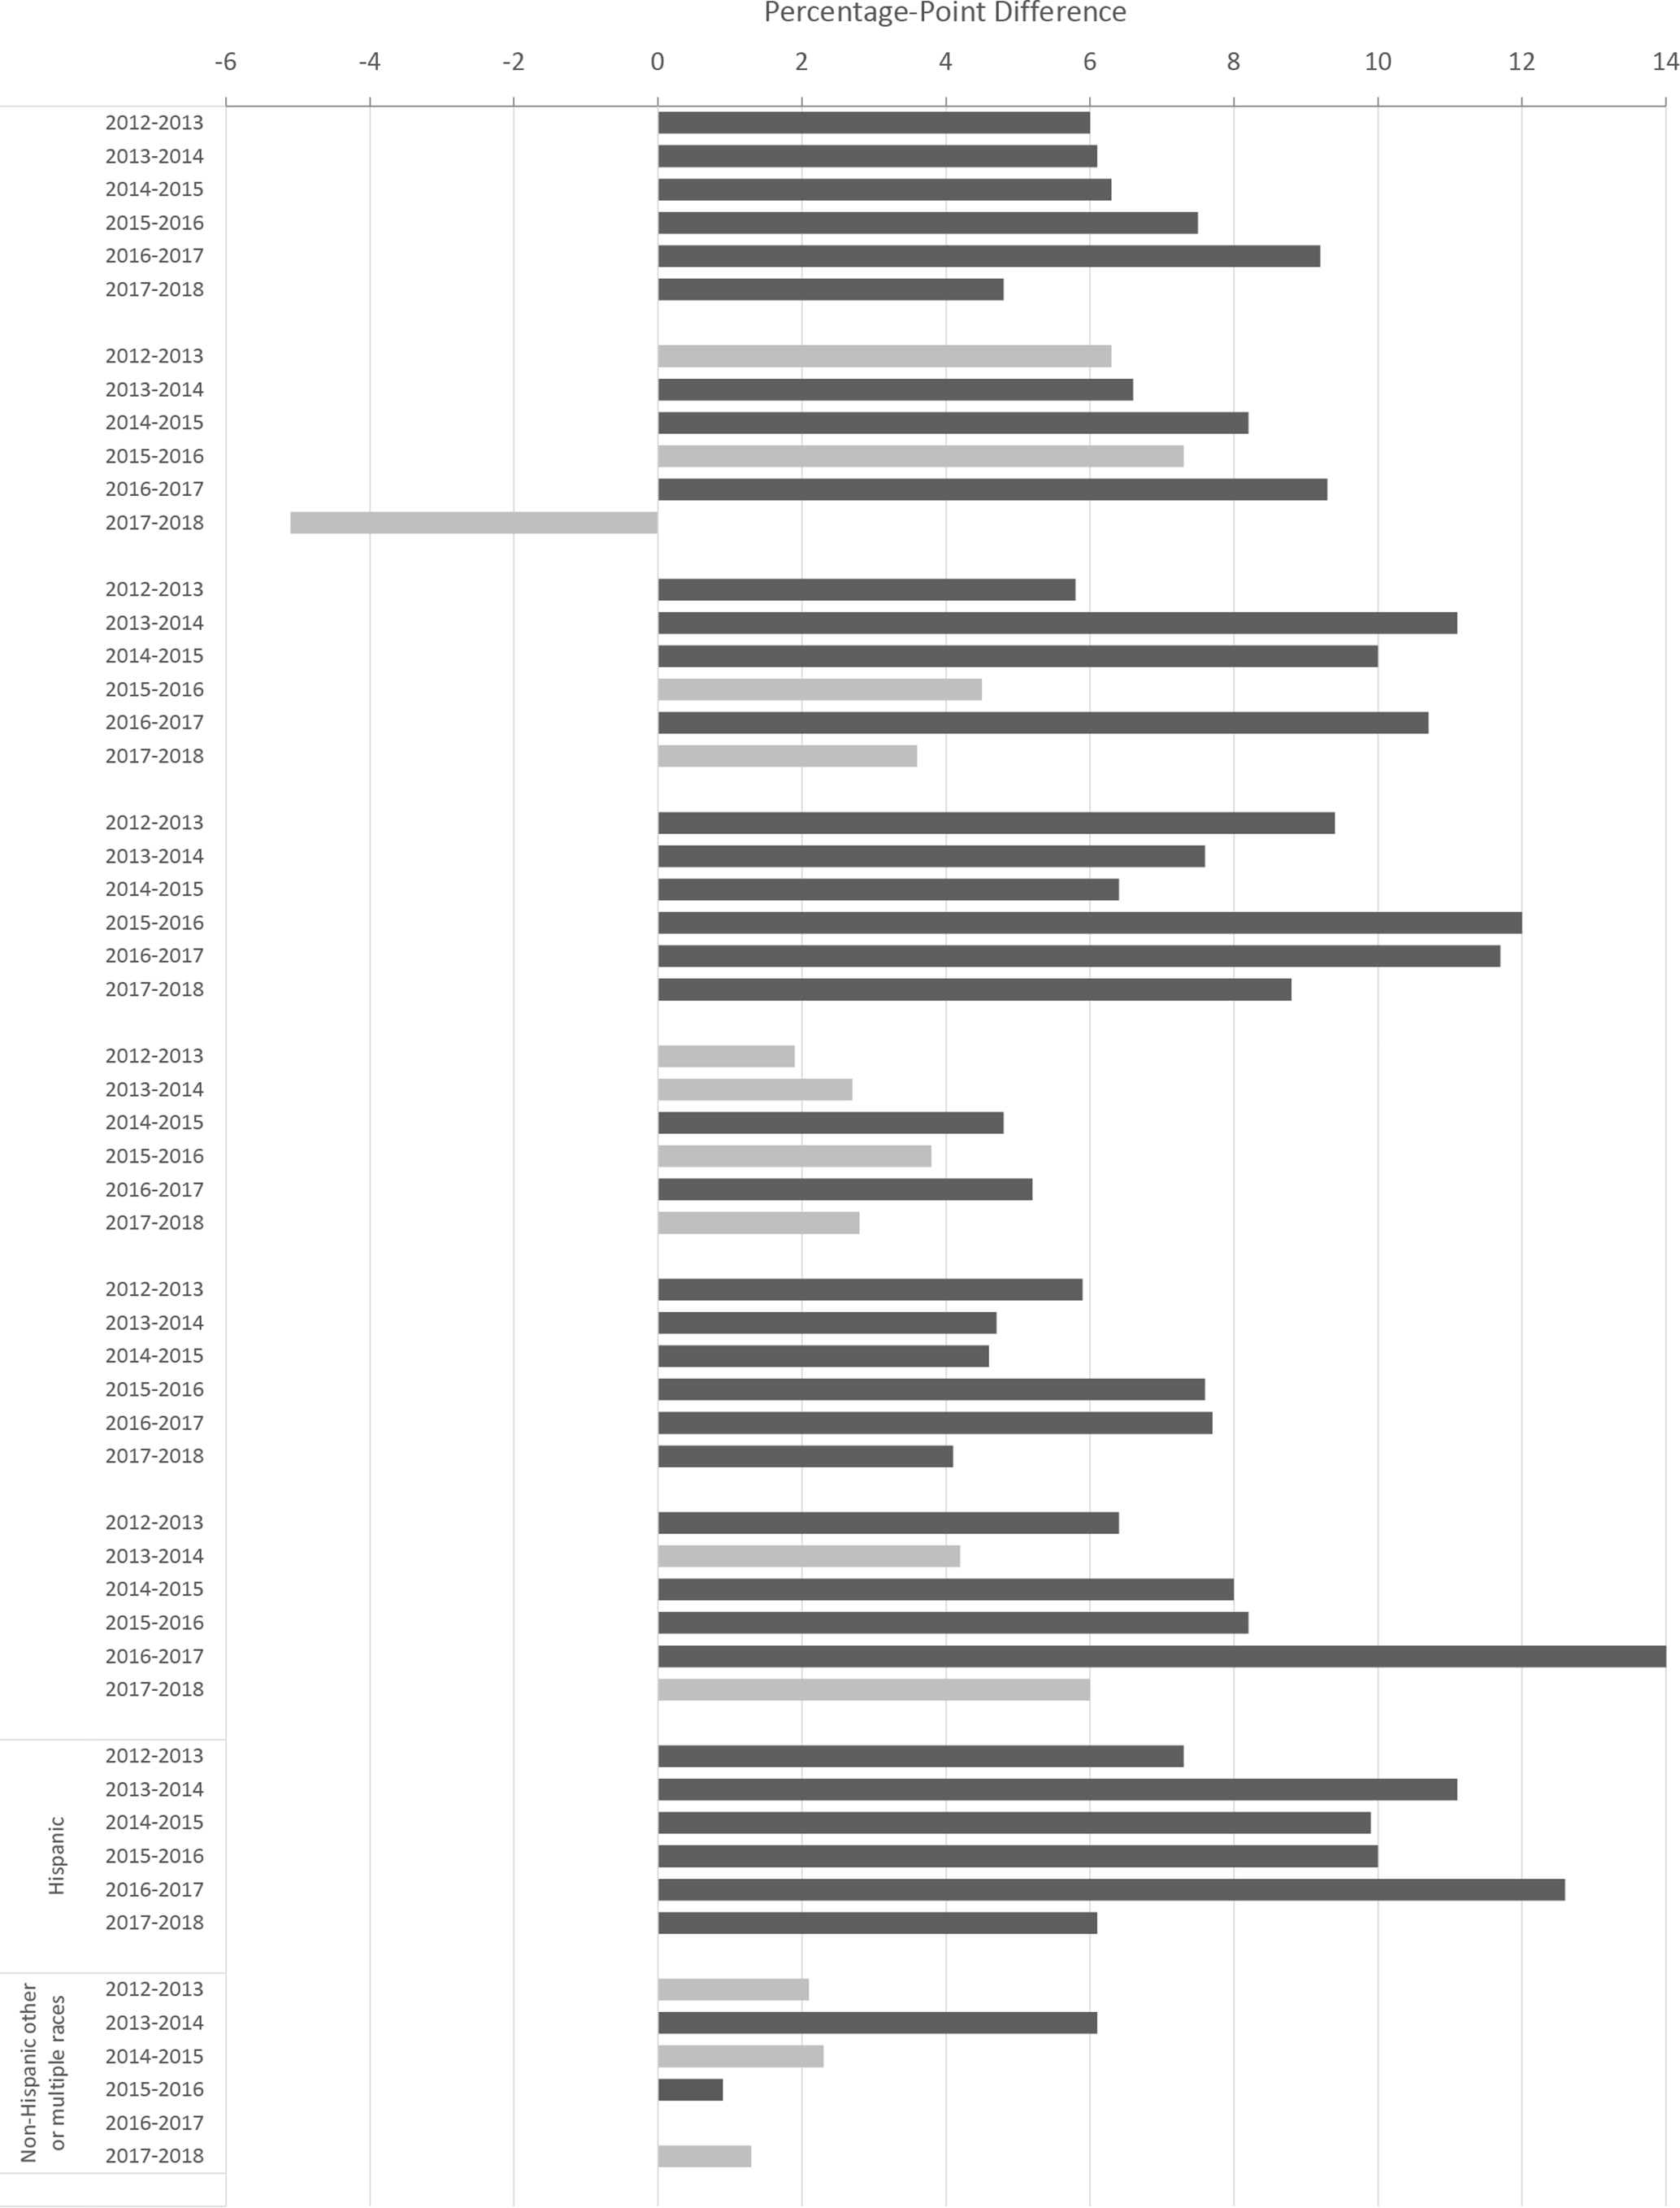
Percentage-point difference between parental-reported estimates of influenza vaccination coverage (at least 1 dose) among children aged 6 months to 17 years, by influenza season, age group, and race/ethnicity, in National Health Interview Survey (NHIS), 2012-2018, and National Immunization Survey–Flu (NIS-Flu), 2012-2019, United States. Differences were calculated as NIS-Flu estimate minus NHIS estimate for each year; significant differences, indicated by the dark gray bars, were determined by t tests; P < .05 was considered significant.
Discussion
Estimates from both the NHIS and NIS-Flu demonstrate a lack of improvement in influenza vaccination coverage among children in the United States. We found this lack of improvement among children overall, among children with and without high-risk conditions, and among children in most age groups. These results suggest that efforts to promote influenza vaccination among children are not having the desired effect. Influenza vaccination has been shown to greatly reduce a person’s chances of getting sick or being hospitalized with, or even dying from, influenza disease and its complications. 11 As of the 2017-2018 season, influenza vaccination coverage was well below the Healthy People 2020 target of 70% for children aged 6 months to 17 years, at only 53.1% based on NHIS, the data source for this goal. 15 That both independent survey systems show similar results strengthens the finding that the trend in childhood influenza vaccination coverage did not increase in the United States during the most recent several influenza seasons.
Some groups of children have higher influenza vaccination coverage than other groups. Both NHIS and NIS-Flu estimates show that younger children have higher coverage than older children, with the highest coverage among children aged 6-23 months. This coverage may be due to the longer-standing recommendation for young children to receive influenza vaccination and due to young children having more health care provider visits than older children for well-child check-ups. 21,22
The pattern of differences between racial/ethnic groups found by the 2 survey systems differed, and these differences may have resulted from differences in the 2 surveys. When we compared vaccination coverage estimates obtained from data in the NHIS and NIS-Flu overall, we found that the NIS-Flu consistently produced estimates that were several percentage points higher than estimates produced from the NHIS. We found large differential reporting between the systems by groups of children, with the largest differences between non-Hispanic black children and Hispanic children; NIS-Flu estimates were as much as 15.9 percentage points higher than NHIS estimates. The differences in estimates observed between the 2 survey systems could have resulted from differences in survey design, survey mode, wording of survey questions, and timing of surveys. The NHIS uses a national sample, whereas the NIS-Flu uses stratified samples to achieve sufficient sample size in each state. The NHIS is an in-person household survey, whereas the NIS-Flu is a telephone survey. The NHIS influenza question asks about receipt of an influenza vaccination in the last 12 months and the survey is conducted year-round, whereas the NIS-Flu asks about receipt of the vaccination since July 1 and the survey is conducted from October through June, so no ambiguity exists about the influenza season being assessed. Additional differences are in the response rates and weighting of the 2 survey systems. The response rates in the NHIS ranged from 59% to 70% and in the NIS-Flu ranged from 48% to 65% for the landline telephone sample and 23% to 39% for the cellular telephone sample. Nonresponse bias can result if respondents and nonrespondents differ in their reports of child’s vaccination status and the prevalence of other characteristics. The NHIS and NIS-Flu, although both aiming for national representativeness, differ in weighting methods. 18,20,23
Differences between NHIS and NIS-Flu estimates increased during the study period. From 2012 to 2017, NHIS child module response rates dropped 10 percentage points, while the combined landline/cellular telephone response rate in the NIS-Child component of the NIS-Flu decreased by 15.1 percentage points, largely because of the increase in proportion of households interviewed via cellular telephone. 18 Further research is needed to determine possible changes in bias of NHIS and NIS-Flu estimates during 2012-2017, as well as possible differential bias in NHIS and NIS-Flu estimates over time. Both surveys rely on parent or guardian report of the child’s influenza vaccination status; neither system verifies vaccination status with the child’s medical records. An evaluation of the total survey error of the NIS-Flu by the NIS-Flu survey statisticians, comparing NIS-Flu data with health care provider report based on medical records, found that the largest source of error in estimates came not from the survey design but from the reliance on parental report. Studies indicate that parental report overestimates influenza vaccination coverage compared with medical records. 24 -26 At least 1 study found differential parental overreporting by racial/ethnic group. 27 Although the NHIS and NIS-Flu are the primary sources of national and comparable state estimates of influenza vaccination coverage among children, immunization information systems (IISs), which are based on health care provider–reported vaccinations, can provide state and local estimates if data quality is sufficient. An IIS is particularly useful for local estimates; however, the functionality of IISs varies widely by state. 28,29 A current collaboration is underway between the NIS and IISs to capitalize on the strengths of each system to improve estimates.
Limitations
This study had at least 2 limitations. First, we tested only for linear trends; for some groups, a curved line may have fit better because the estimates appeared to increase and then decrease. Second, we did not evaluate receipt of 2 doses of influenza vaccine. 30
Conclusions
Influenza vaccination coverage among children appears to have plateaued; as of 2017-2018, only about half of the children in the United States were vaccinated against influenza. Improvements in measurement of influenza vaccination and development and review of strategies to increase childhood influenza vaccination coverage are needed. The Community Guide is a resource for evidence-based strategies. 31
Footnotes
Declaration of Conflicting Interests
The authors declared no potential conflicts of interest with respect to the research, authorship, and/or publication of this article.
Funding
The authors received no external financial support with respect to the research, authorship, and/or publication of this article.