
Abstract
Objective
Electronic health records (EHRs) hold promise as a public health surveillance tool, but questions remain about how EHR patients compare with populations in health and demographic surveys. We compared population characteristics from a regional distributed data network (DDN), which securely and confidentially aggregates EHR data from multiple health care organizations in the same geographic region, with population characteristics from health and demographic surveys.
Methods
Ten health care organizations participating in a Colorado DDN contributed data for coverage estimation. We aggregated demographic and geographic data from 2017 for patients aged ≥18 residing in 7 counties. We used a cross-sectional design to compare DDN population size, by county, with the following survey-estimated populations: the county population, estimated by the American Community Survey (ACS); residents seeking any health care, estimated by the Colorado Health Access Survey; and residents seeking routine (eg, primary) health care, estimated by the Behavioral Risk Factor Surveillance System. We also compared data on the DDN and survey populations by sex, age group, race/ethnicity, and poverty level to assess surveillance system representativeness.
Results
The DDN population included 609 840 people in 7 counties, corresponding to 25% coverage of the general adult population. Population coverage ranged from 15% to 35% across counties. Demographic distributions generated by DDN and surveys were similar for many groups. Overall, the DDN and surveys assessing care-seeking populations had a higher proportion of women and older adults than the ACS population. The DDN included higher proportions of Hispanic people and people living in high-poverty neighborhoods compared with the surveys.
Conclusion
The DDN population is not a random sample of the regional adult population; it is influenced by health care use patterns and organizations participating in the DDN. Strengths and limitations of DDNs complement those of survey-based approaches. The regional DDN is a promising public health surveillance tool.
Keywords
Public health surveillance for chronic diseases rarely includes locally mandated reporting requirements. 1 -4 Spurred by federal investments, 5 electronic health records (EHRs) are ubiquitous in hospitals and clinics 6 and can help support chronic disease surveillance. Health care organizations participating in a distributed data network (DDN, also known as a federated data network) format their EHR data into a common data model, with standardized tables, fields, and technical specifications, so that a single query distributed throughout the network pulls similar data from each system. Data can then be aggregated across sites to produce statistics on the network population and subpopulations. DDNs, such as the US Food and Drug Administration–sponsored Sentinel System 7,8 and PCORnet, 9 share EHR data across health systems for public health surveillance and research, respectively. Regional DDNs have the potential to complement population-based surveys of self-reported health outcomes and behaviors with routinely documented clinical care events (eg, diagnoses and laboratory test results). Populations represented in EHRs can be sufficiently large to estimate disease prevalence in smaller geographic areas (eg, census tracts) and in population subgroups (eg, American Indian/Alaska Native people) that are inadequately served by many population-based surveys. 10,11 Thus, regional DDNs bridge a gap between traditional public health surveillance methods and health system–specific population health monitoring. 12 Regional DDNs currently exist in New York City, 13 Chicago, 14 Colorado, 15 and elsewhere.
Population coverage of a DDN and the precision of estimates of disease prevalence increase as more health care organizations contribute data. However, DDN populations may not be representative of populations residing in a county or other geographic subdivision. The Centers for Disease Control and Prevention recommends assessing population representativeness when evaluating a public health surveillance system. 16 The Macroscope Project in New York City conducted a robust validation process for its population coverage as a regional DDN in a dense metropolitan area, providing a useful precedent for our approach. 17,18
The Colorado Health Observation Regional Data Service (CHORDS) is a regional DDN that supports chronic disease surveillance across counties with varying population sizes, demographic characteristics, and poverty levels. 19 Evaluating the population coverage and representativeness of CHORDS is an opportunity to explore the strengths and challenges of regional DDNs. We assessed how distributions of demographic and geographic characteristics from CHORDS compared with those of survey estimates. We compared data on adults who sought ambulatory care in the CHORDS network during 2017 with survey-based data on the general adult population and adult health care–seeking populations. We hypothesized that the DDN population would have higher proportions of women and older adults than county population estimates, which is consistent with national patterns of health care use. 20 We also hypothesized that the DDN population would have higher proportions of patients of racial/ethnic minority populations and patients living in poverty than survey-based estimates of care-seeking populations.
Methods
Setting
This study focused on 7 counties in the Denver metropolitan area: Adams, Arapahoe, Boulder, Broomfield, Denver, Douglas, and Jefferson. Since 2014, the local public health agencies in these counties have partnered with local health care systems, federally qualified health centers (FQHCs), community mental health centers, a regional health information exchange, local health nonprofit organizations, and other key stakeholders to share EHR data using PopMedNet software. 21 A detailed description of the CHORDS network is published elsewhere. 15 The Colorado Multiple Institutional Review Board reviewed the CHORDS network as non-human subjects research for public health use.
To assess the demographic and geographic representativeness of the CHORDS DDN population, we compared its characteristics with the characteristics of people in 3 population-based surveys representing conceptually distinct but overlapping populations. For each county, we used the American Community Survey (ACS) 22 to estimate the adult population, the Colorado Health Access Survey (CHAS) 23 to estimate the adult population seeking any health care services, and the Colorado Behavioral Risk Factor Surveillance System (BRFSS) 24 to estimate the subset of the adult population seeking routine health care services (eg, primary care).
Inclusion Criteria
We restricted inclusion to adults who were aged ≥18 on the date data were collected and who resided in 1 of the 7 counties. We excluded children to facilitate comparisons with population-based surveys that included only adults. Because the sample sizes in Broomfield County for BRFSS and CHAS were too small for valid county estimates, we combined all Broomfield County results with adjacent Boulder County results.
Data Sources
CHORDS
We extracted aggregate demographic and geographic data across the DDN for adults who had at least 1 ambulatory-care encounter during 2017 and whose residential address was geo-located to 1 of the 7 counties. We excluded data on emergency department and inpatient encounters to minimize the likelihood of duplicated patients across sites. 13 We collected data from 10 CHORDS data partners: 2 large health systems, 7 FQHC safety net providers, and 1 community mental health center. We calculated patient ages by using birth dates and visit dates recorded in the EHR. We derived data on patient county and census tract by geo-locating street addresses recorded in the EHR.
ACS
The ACS, a multistage population-based survey administered by the US Census Bureau, is used to estimate population changes between each decennial census. Monthly samples of households and group quarters are aggregated into estimates covering 1, 3, or 5 years, depending on the level of geographic aggregation. We used data from the 2013-2017 ACS to estimate the total population of adults living in the 7 counties. We selected 5-year estimates for this study because they are the only estimates available at the census-tract level, which was important for measuring neighborhood poverty. We accessed data by using the acs package in R statistical software. 25
CHAS
The CHAS is a random-digit-dialed telephone survey fielded, analyzed, and managed by the Colorado Health Institute (CHI) and conducted by Social Science Research Solutions. 26,27 The aim of this biennial survey is to document data on health insurance coverage and access to and use of health care for the noninstitutionalized population in Colorado. We used the 2017 CHAS to estimate data on adults who sought any health care services. We restricted the sample for this study to 2822 households in the Denver metropolitan area. Participants were asked, “Have you visited a health care professional or health care facility in the past 12 months?” Respondents who answered yes were considered to be in the population seeking any health care services during 2017. CHI provided data through a custom data request.
BRFSS
The BRFSS is an annual random-digit-dial telephone survey that measures the prevalence of health behaviors, health conditions, and preventive health services among Colorado residents aged ≥18. In Colorado, the BRFSS is administered by the Colorado Department of Public Health and Environment. We used the 2017 BRFSS to estimate the number of adults who had routine health care services during the past year. We restricted the study sample to 3372 participants living in the eligible counties. Respondents were asked, “About how long has it been since you last visited a doctor for a routine checkup? A routine checkup is a general physical exam, not an exam for a specific injury, illness, or condition.” Respondents who selected “Within the past year (anytime less than 12 months ago)” were considered to be in the population seeking routine health care services during 2017.
Statistical Analysis
We assessed county-specific coverage of the DDN population by dividing the number of people represented in the DDN by the total ACS population in each county. We used coverage ranges for each data source to account for the imprecision of survey estimates. We compared the following demographic characteristics for each data source and county: sex (male, female), age group (18-24, 25-44, 45-64, and ≥65), and race/ethnicity (Hispanic, non-Hispanic white, and non-Hispanic other race). We used weighted estimates from population-based surveys for all demographic comparisons. We calculated 90% CIs for all demographic estimates per US Census Bureau recommendations and present margins of error to demonstrate the number of people in the lower and upper bounds of the 90% CI. 28,29 To estimate whether DDN patients were more or less likely to live in an area with high poverty, we divided census tracts into those with >20% of adults living below the federal poverty level and those with ≤20% of adults living below the federal poverty level. 30 We estimated the percentage of the DDN population living in those census tracts by county and compared with the corresponding county-level ACS estimate. We performed all analyses by using R statistical software. 31
Results
Population Coverage
During 2017, an estimated 2 377 939 adults (margin of error, 20 884) lived in the Denver metropolitan area, according to the ACS (Table). Across all 7 counties, 75%-80% of adults received any health care services (CHAS), and 59%-63% received routine care (BRFSS). The 7-county unweighted DDN population (CHORDS) included 609 840 adults, corresponding to approximately 26% of the general adult population (ACS).
Comparison of coverage among populations represented by a distributed data network (DDN), the American Community Survey, and 2 health surveys, a by Denver metropolitan area county, Colorado, 2017
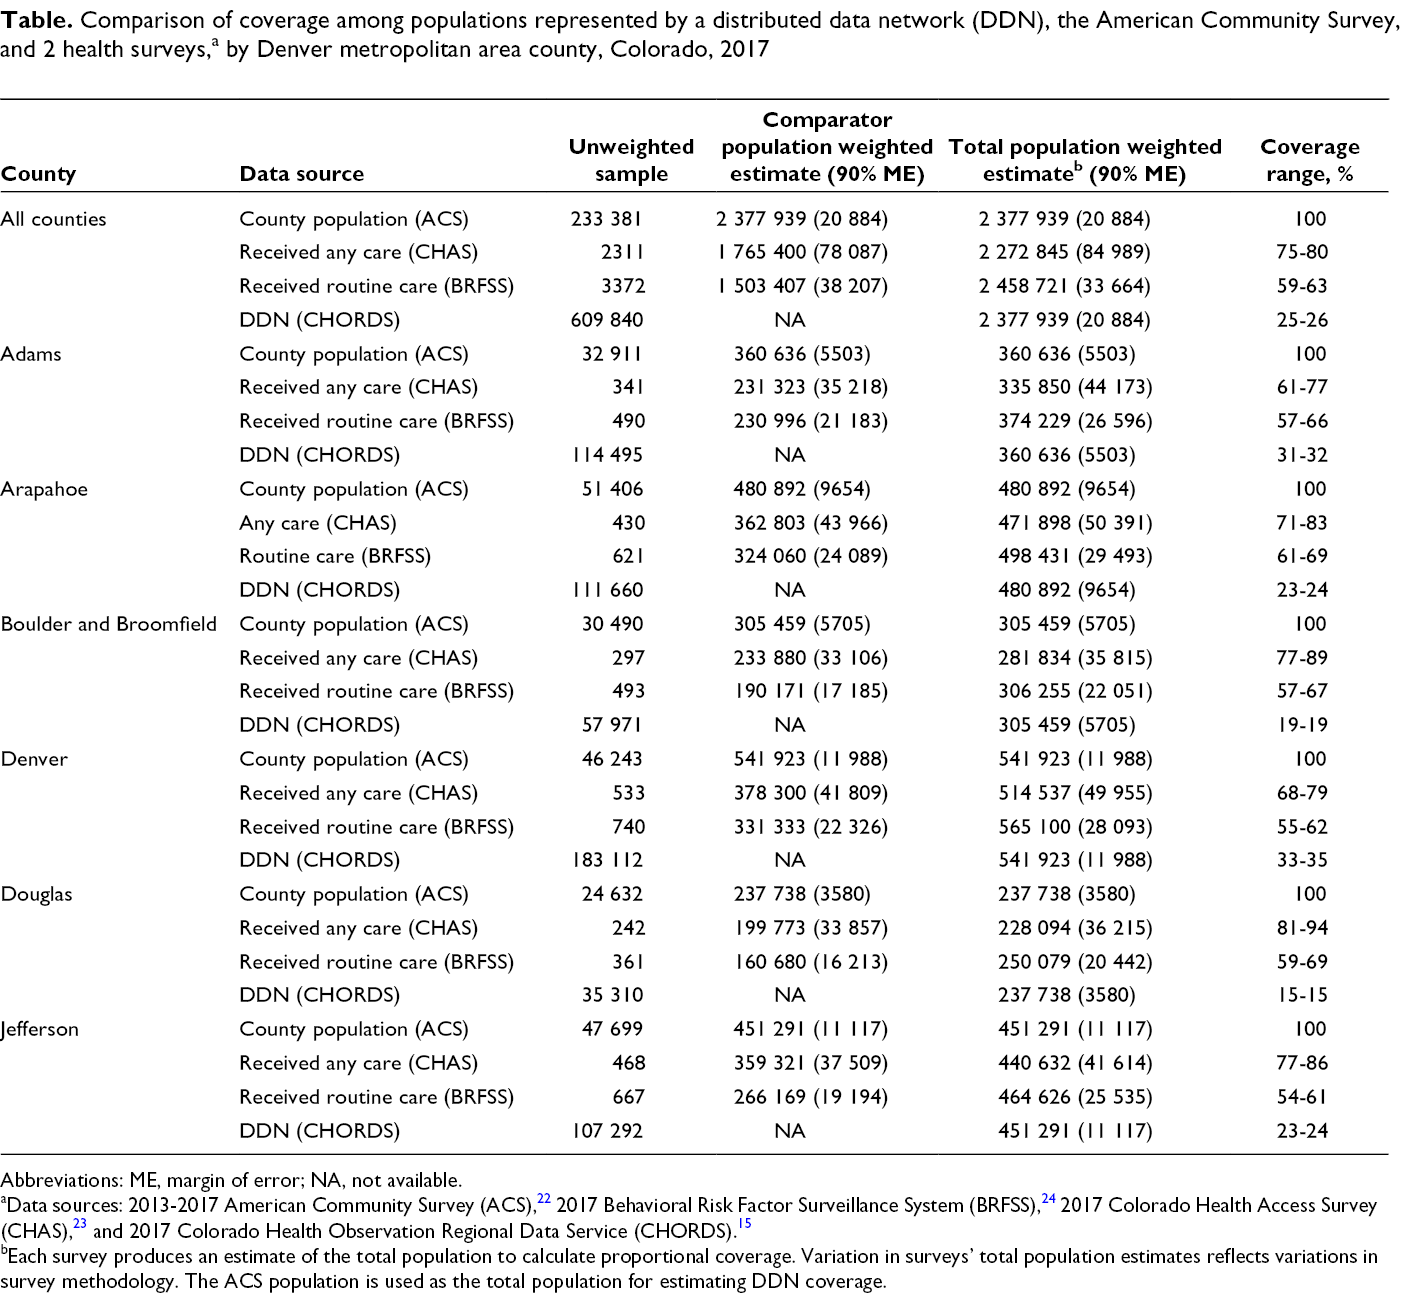
Abbreviations: ME, margin of error; NA, not available.
aData sources: 2013-2017 American Community Survey (ACS), 22 2017 Behavioral Risk Factor Surveillance System (BRFSS), 24 2017 Colorado Health Access Survey (CHAS), 23 and 2017 Colorado Health Observation Regional Data Service (CHORDS). 15
bEach survey produces an estimate of the total population to calculate proportional coverage. Variation in surveys’ total population estimates reflects variations in survey methodology. The ACS population is used as the total population for estimating DDN coverage.
The DDN population represented 15%-34% of the county populations as measured by the ACS (Table). Denver County, which had the densest population in the region, also had the highest CHORDS coverage (34% of all adult residents). Douglas County, which had the least dense population in the region, also had the lowest relative CHORDS coverage (15% of all adult residents).
Demographic Characteristics
In each county, the DDN population overrepresented women compared with the ACS population (Figure 1). This difference was the largest in Adams County, where approximately 51% of the adult population was female compared with approximately 60% of the DDN population. The DDN population included comparable or slightly higher proportions of women than the 2 survey-based health care–seeking populations.
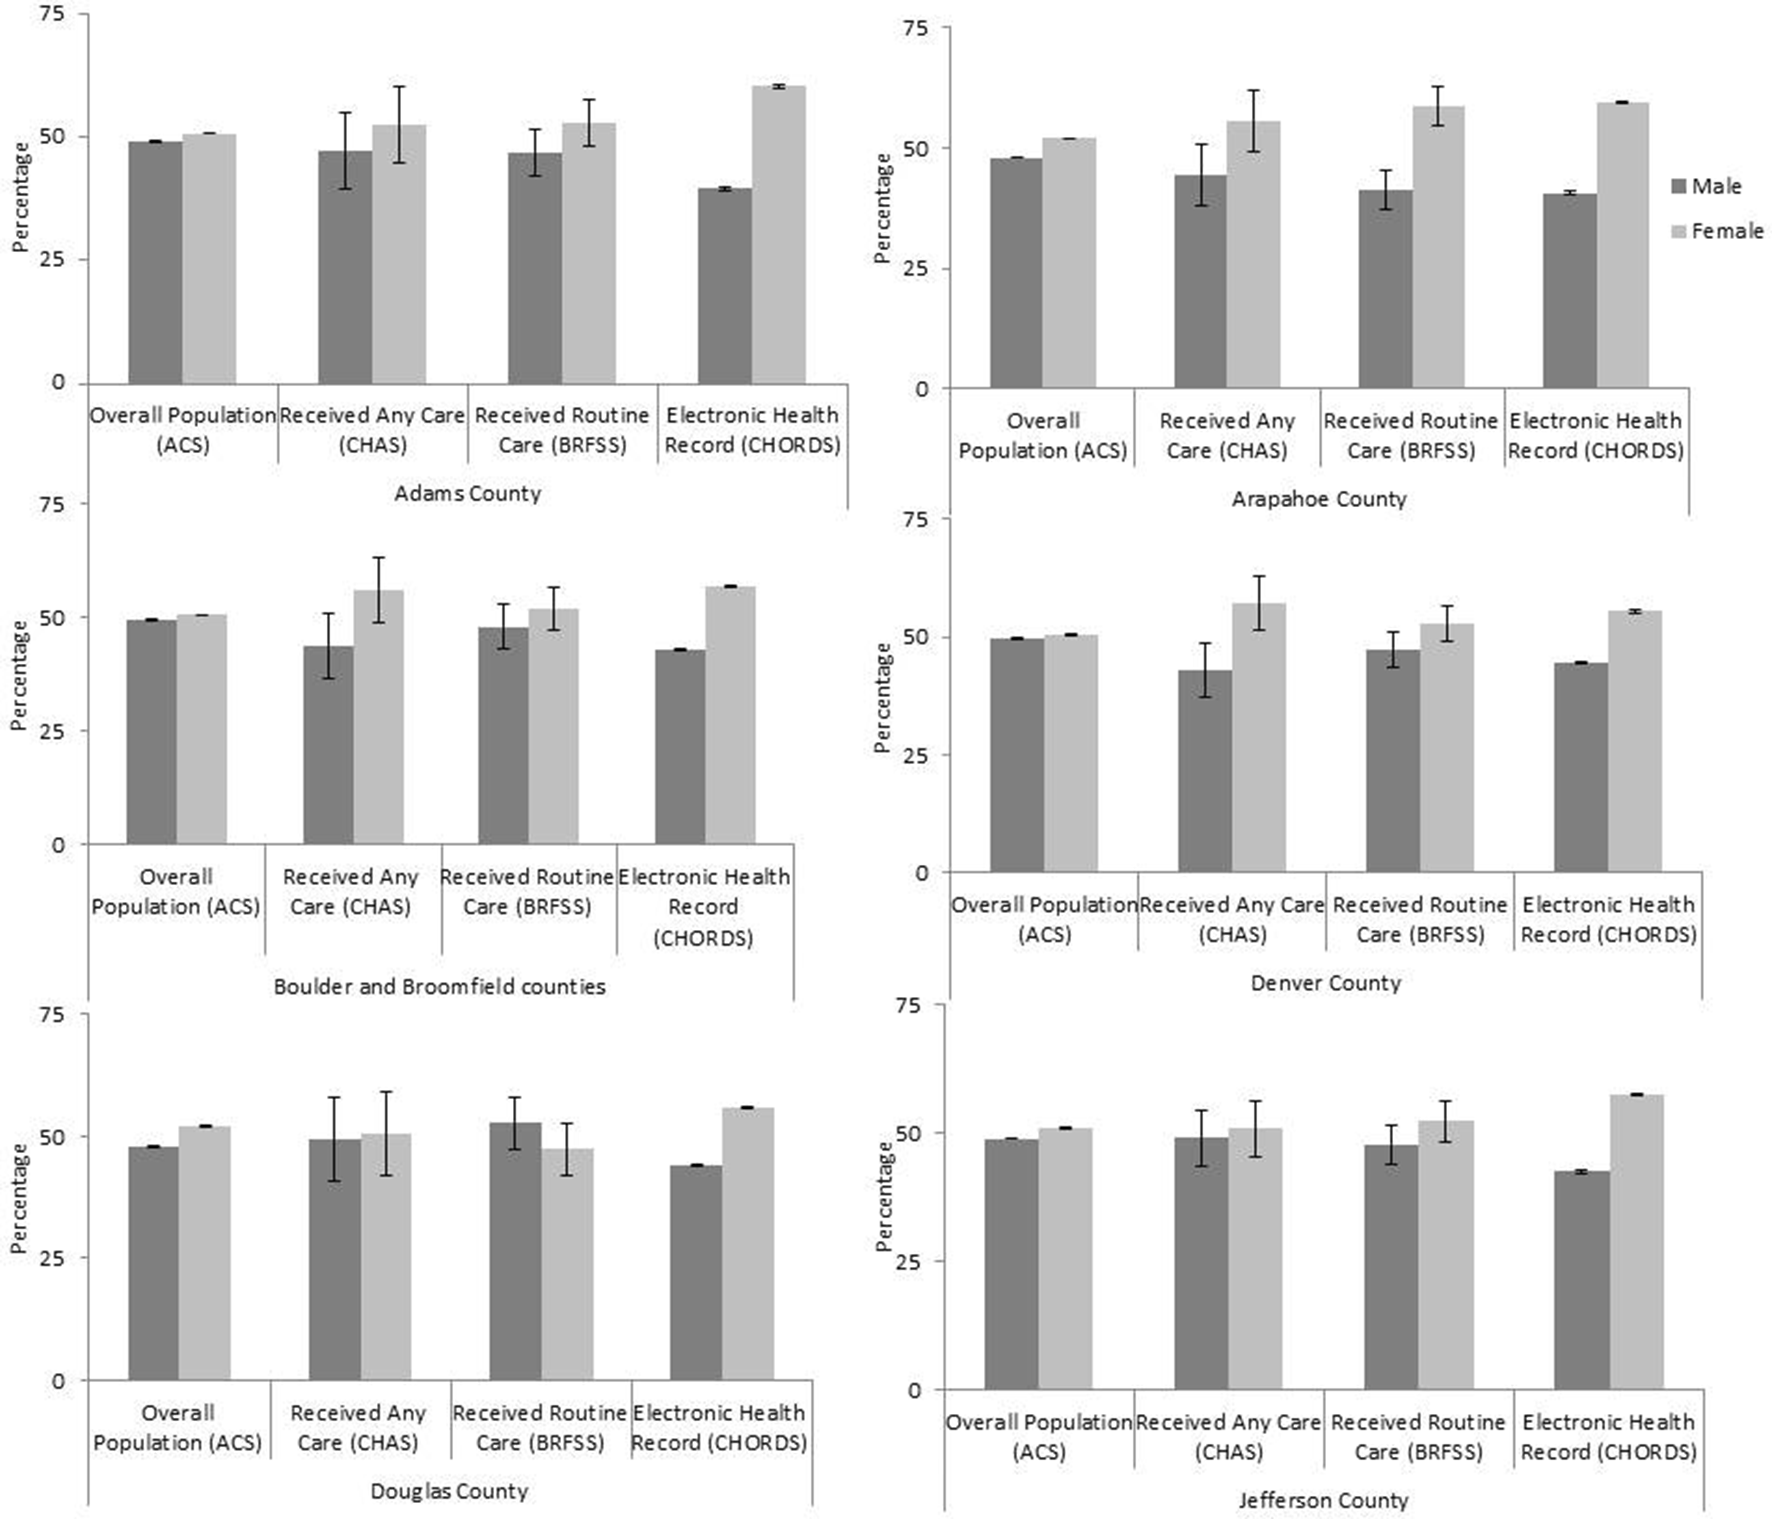
Adults aged ≥18 in the distributed data network population compared with the estimated general and care-seeking populations, by sex and Denver metropolitan area county, Colorado, 2017. Abbreviations: ACS, American Community Survey; BRFSS, Behavioral Risk Factor Surveillance System; CHAS, Colorado Health Access Survey; CHORDS, Colorado Health Observation Regional Data Service. Error bars represent 90% margins of error for each estimate. Data sources: 2013-2017 ACS, 22 2017 BRFSS, 24 2017 CHAS, 23 and 2017 CHORDS. 15
DDN coverage of adults aged 18-24 was similar to other data sources in 6 of the 7 counties and substantially lower in Boulder and Broomfield counties compared with ACS estimates (Figure 2). The DDN population had similar coverage of adults aged 25-44 in 5 counties and lower coverage of adults aged 25-44 in Denver and Jefferson counties compared with ACS estimates. The DDN population had similar coverage of adults aged 45-64 in all 7 counties (CHORDS range, 31.4%-38.9%; ACS range, 29.8%-41.9%). Across all 7 counties, a greater proportion of the DDN population than the ACS population was aged ≥65. Compared with the other data sources, CHAS generally had lower estimates of adults aged 25-44 receiving any care and higher estimates of adults aged ≥65 receiving any care. BRFSS CIs for all age groups generally overlapped with both DDN and ACS distributions, with the exception of substantially higher estimates of adults aged ≥65 in Jefferson County.
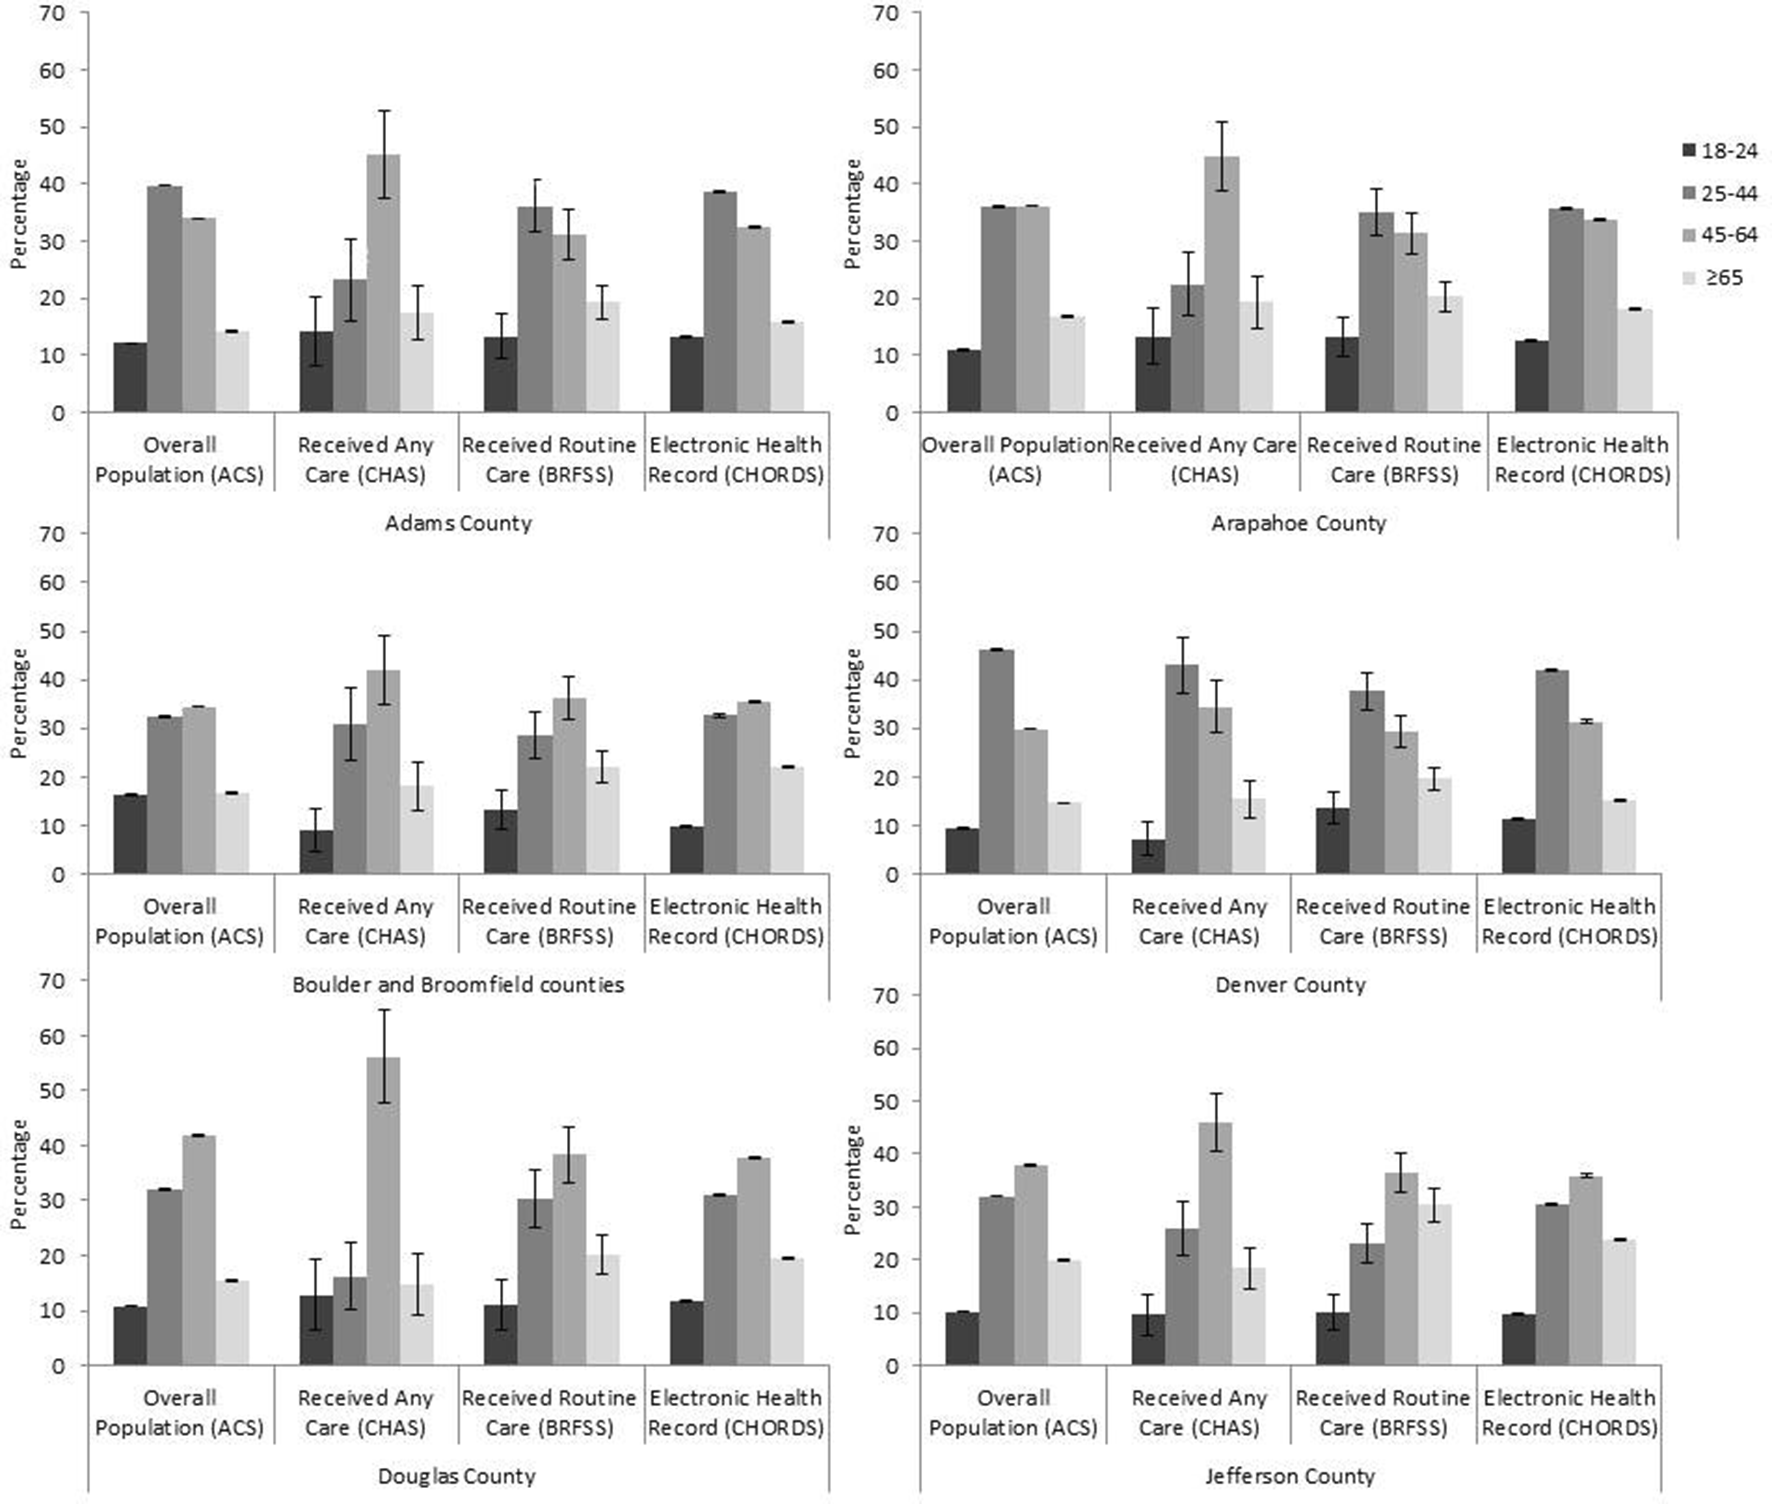
Adults aged ≥18 in the distributed data network population compared with the estimated general and care-seeking populations, by age and Denver metropolitan area county, Colorado, 2017. Abbreviations: ACS, American Community Survey; BRFSS, Behavioral Risk Factor Surveillance System; CHAS, Colorado Health Access Survey; CHORDS, Colorado Health Observation Regional Data Service. Error bars represent 90% margins of error for each estimate. Data sources: 2013-2017 ACS, 22 2017 BRFSS, 24 2017 CHAS, 23 and 2017 CHORDS. 15
Across all counties, the proportion of the population that was Hispanic was greater in the DDN population than in the other data sources. This pattern corresponded generally to smaller DDN proportions of non-Hispanic white and non-Hispanic other racial/ethnic group populations in the DDN population than in the general and care-seeking populations (Figure 3).
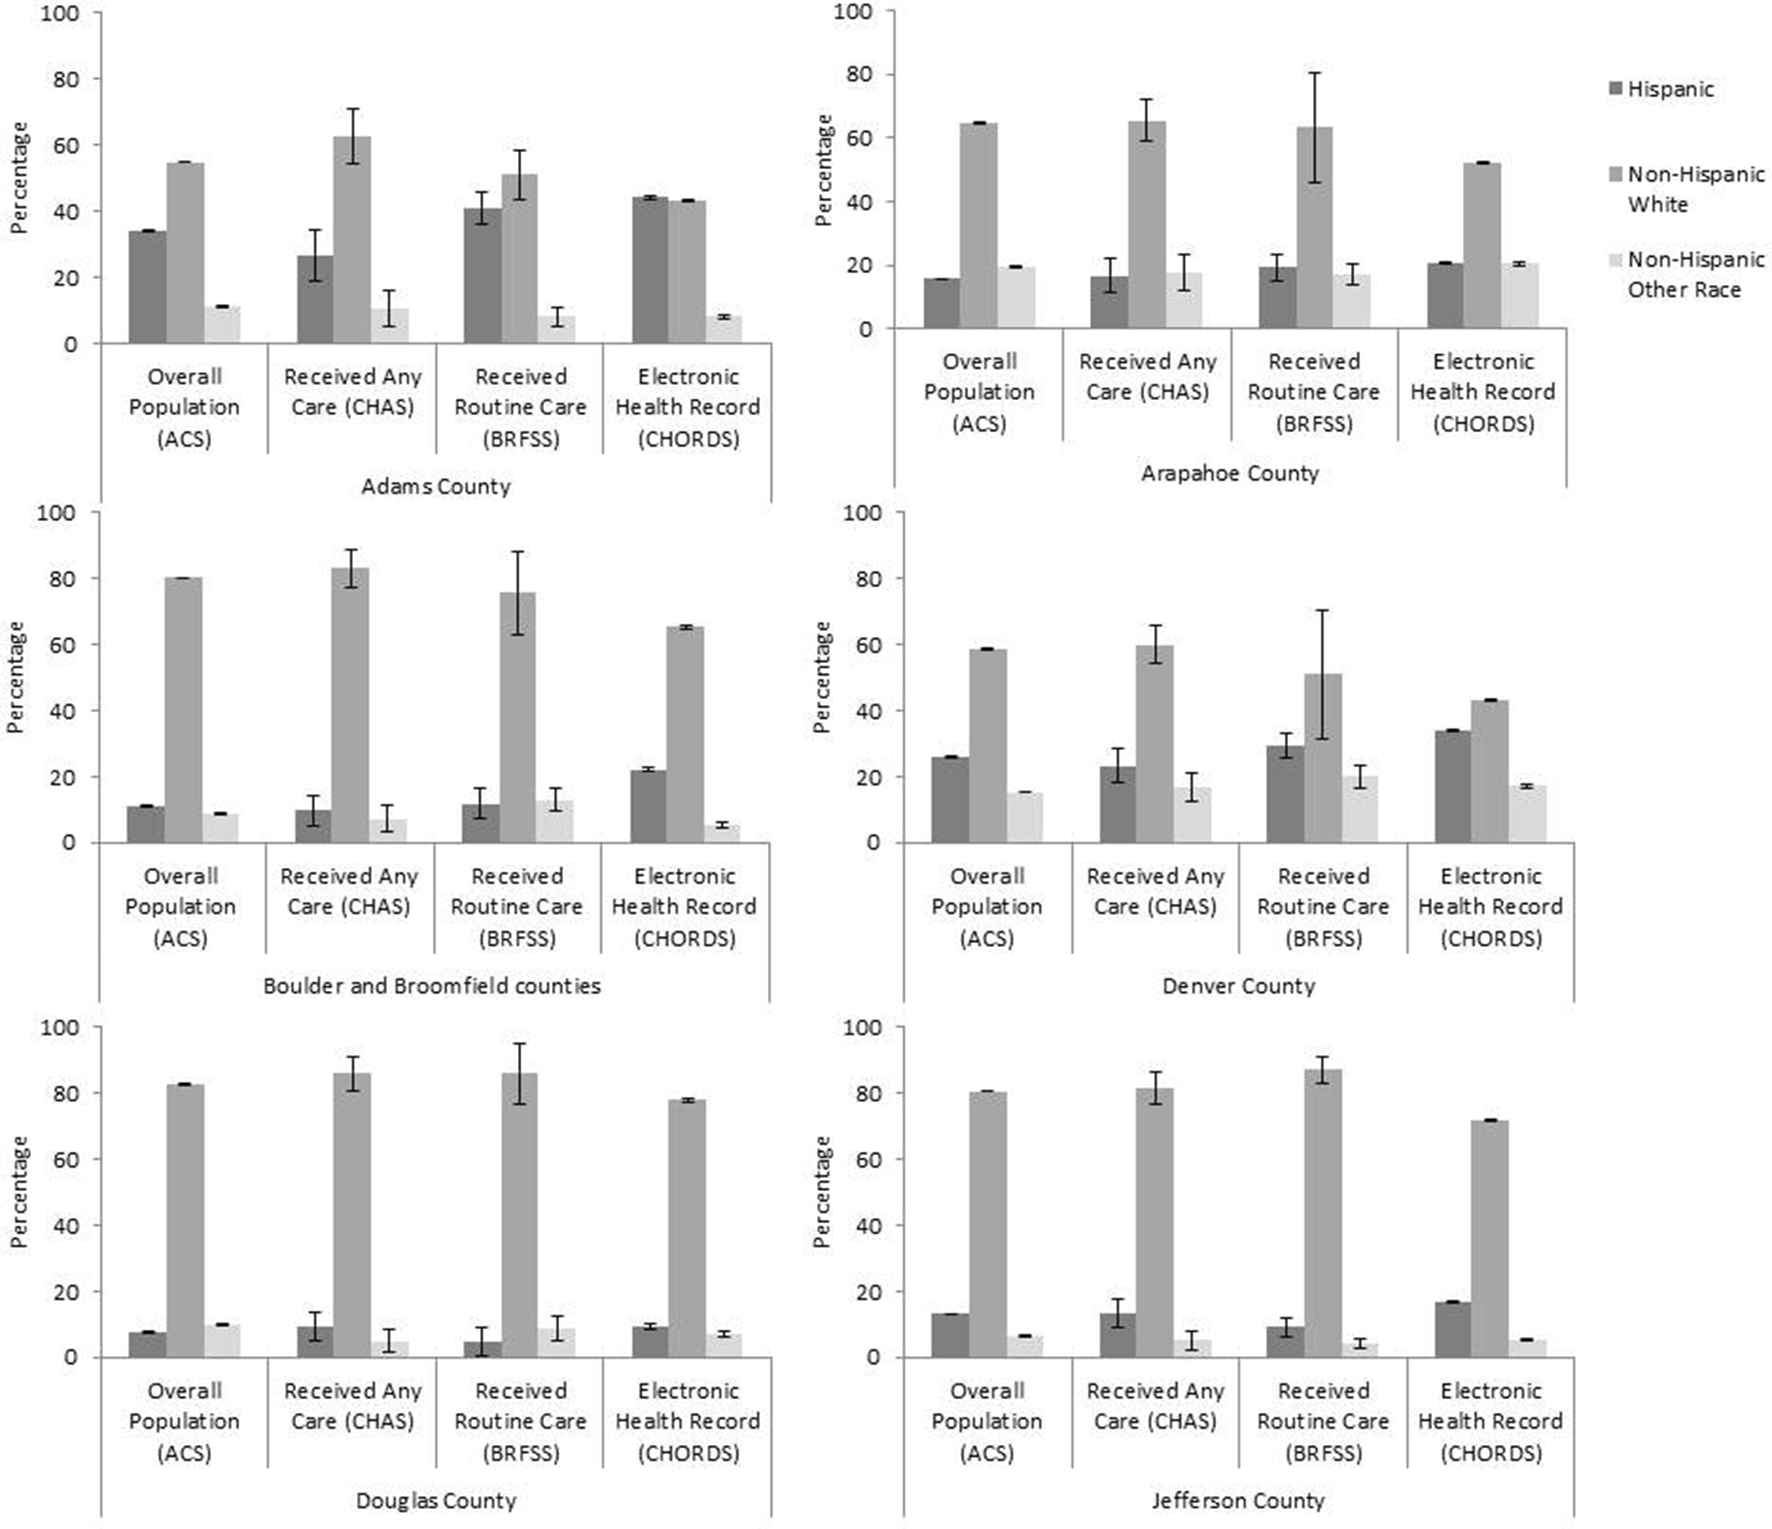
Adults aged ≥18 in the distributed data network population compared with the estimated general and care-seeking populations, by race/ethnicity and Denver metropolitan area county, Colorado, 2017. Abbreviations: ACS, American Community Survey; BRFSS, Behavioral Risk Factor Surveillance System; CHAS, Colorado Health Access Survey; CHORDS, Colorado Health Observation Regional Data Service. Error bars represent 90% margins of error for each estimate. Data sources: 2013-2017 ACS, 22 2017 BRFSS, 24 2017 CHAS, 23 and 2017 CHORDS. 15
Poverty
In 3 of the 7 counties (Adams, Arapahoe, and Denver), the percentage of adults living in a high-poverty census tract was higher in the DDN than in the ACS, whereas in 2 counties (Boulder and Broomfield), the percentage of adults living in a high-poverty census tract was higher in the ACS than in the DDN (Figure 4). Jefferson and Douglas counties had low poverty rates overall, and the percentage of adults living in a high-poverty census tract was similar in the DDN and ACS populations (0% in Douglas County and 1% in Jefferson County).
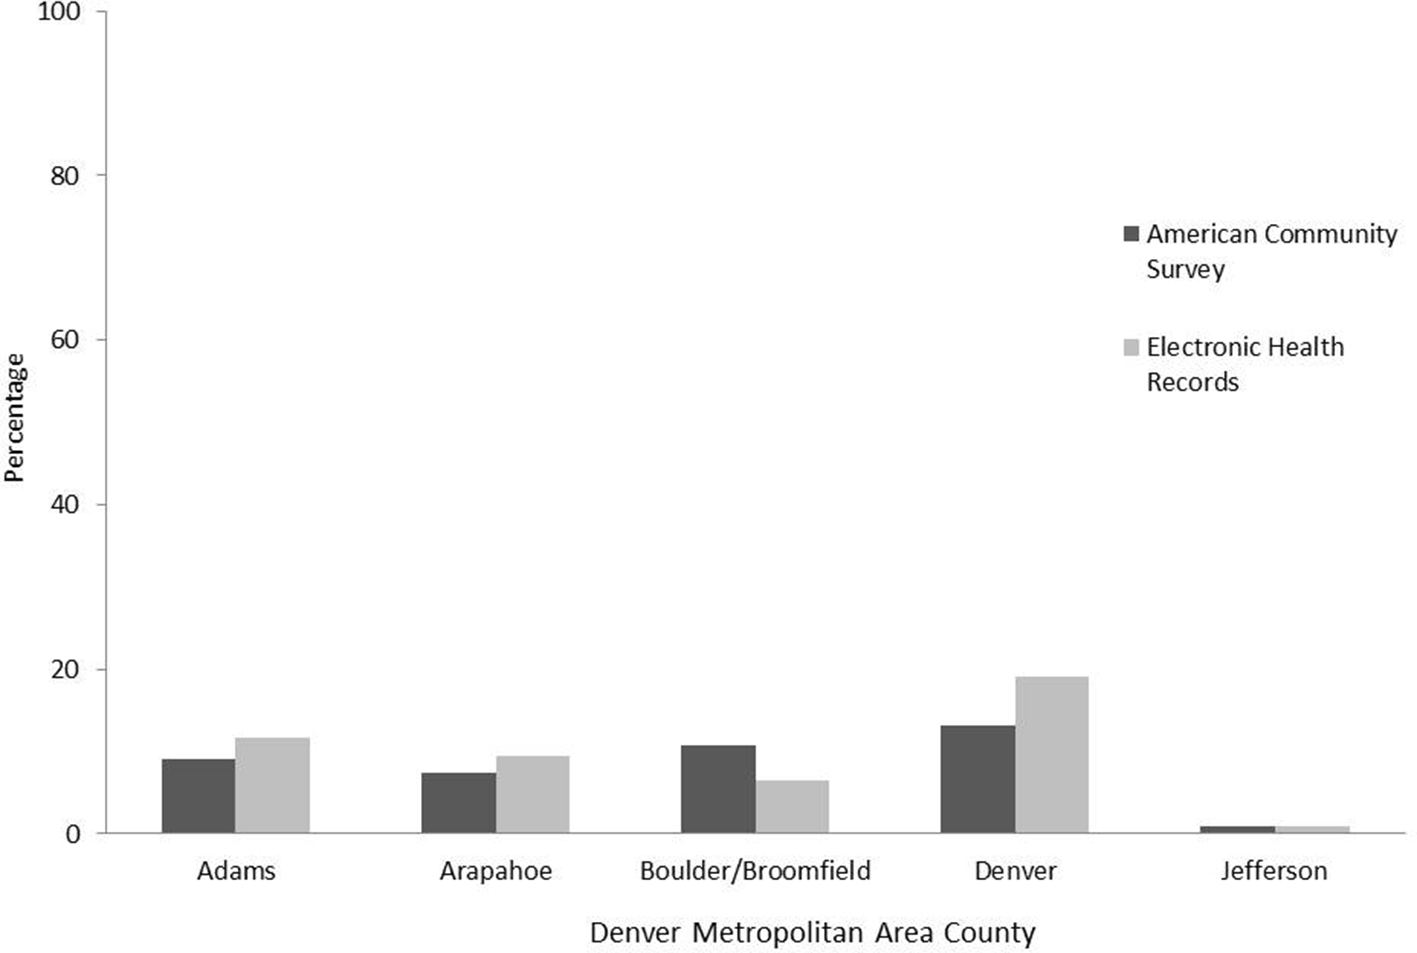
Distribution of adults aged ≥18 in the distributed data network and general population living in a census tract with >20% of adults living below the federal poverty level, by Denver metropolitan area county, Colorado, 2017. Data sources: 2013-2017 American Community Survey, 22 2017 Behavioral Risk Factor Surveillance System, 24 2017 Colorado Health Access Survey, 23 and 2017 Colorado Health Observation Regional Data Service. 15 Douglas County was excluded from the analysis because there were no census tracts with >20% of adults living below the federal poverty level.
Discussion
This study compared data from a DDN population in Colorado with data from county population estimates from the ACS and care-seeking population estimates from 2 surveys (BRFSS and CHAS) in 7 diverse counties. Population coverage varied by data source, demographic characteristics, and poverty level, reinforcing that each data source represented different populations and that each data source appropriately estimated true population counts. The CHORDS population captured data on substantial proportions of adults in each county, although coverage varied. Except for Adams County, which has a larger population than Denver County, more populated counties generally had higher levels of coverage than counties with smaller populations. The geographic distribution of clinics associated with CHORDS data partners likely drove the higher coverage in Denver County compared with the other 6 counties.
We found that the demographic characteristics and poverty levels of the DDN population differed from those of the survey populations in several important ways. Similar to national trends in health care use 20 and the health surveys in this analysis, the DDN population had a higher proportion of women than ACS estimates for all counties. Substantially lower DDN coverage of residents aged 18-24 in Boulder and Broomfield counties was likely because of the large university in Boulder County, where many students sought health care services on campus (data that were not included in the DDN). These results suggest that our DDN should consider partnering with campus health care providers to increase coverage of this young adult population. Adults aged ≥65 have near-universal health insurance coverage and higher health care needs on average compared with other age groups. Older adults generally represented a greater share of CHORDS, CHAS, and BRFSS populations than ACS distributions.
We hypothesized that CHORDS would have a similar racial/ethnic composition to the ACS population. The DDN had a higher percentage of Hispanic patients than the health surveys and the ACS-estimated county population. In addition, higher proportions of the DDN population than the ACS population were living in poverty. Combined, these results suggest that FQHC partners contributed disproportionate populations of Hispanic patients and patients living in poverty to the DDN. To the extent that health conditions vary by race/ethnicity and poverty, overrepresentation of these groups poses opportunities and challenges. In general, the large CIs for CHAS and BRFSS estimates created challenges in identifying differences. Without a sufficiently precise reference standard, it is difficult to know whether DDN estimates are biased. However, even biased data may be better for characterizing impoverished or racial/ethnic minority populations than imprecise survey estimates (or, as is often the case, no estimates at all). DDNs can, for example, examine within-population trends over time in a way that surveys cannot.
Multiple selection processes likely explain the observed differences between DDN and survey data. Data on some people were missing from the DDN because they were less likely than people not in the DDN to receive health care services, for example, because of lack of health insurance or limited health care access, despite the effect of the Patient Protection and Affordable Care Act on health care access. 32 Data on people who access health care in a given year might still be inaccurately represented in a DDN because of the voluntary and incidental ways in which networks form. 33 Certain patients are more likely to seek care with certain health providers for reasons that may confound epidemiologic analysis. For example, people living in poverty are more likely to access health care through FQHCs than people not living in poverty. 34 Geographic distribution of health care organizations is influenced by financial considerations that are, likewise, not random. 34 Furthermore, unlike surveys that predetermine their sample size, the exact number of people in a regional DDN will evolve as patients move geographic residence within or across regions or use different health systems, and as additional data partners join the network.
Limitations
This study had several limitations. First, data from this study were limited to adult patients in a particular regional DDN. As such, our findings may not be generalizable to children, people not in care, other DDNs, or other geographic regions. Second, aggregating data during a different period (eg, 2 years vs 1 year) might have produced different results. Third, data from EHRs varied in quality, which may have affected DDN estimates. 35,36
Strengths
This study also had several strengths. First, whereas county-level weighted survey estimates are based on several hundred people, DDN estimates are based on tens of thousands. The sheer volume of EHR data in the DDN is a notable strength, including for use in regional health planning. Second, we consider it a strength that the DDN represents large numbers and proportions of people who have health disparities, including Hispanic people or people who live in high-poverty areas. We were unable to make strong conclusions about the racial/ethnic representativeness of the DDN because of the limited precision of the surveys. And the CHORDS DDN includes data on populations that are excluded from many surveys by design (eg, people experiencing homelessness). By presenting more robust data on low-prevalence health conditions or small populations—whether racial/ethnic minority, census tract, or rural jurisdictions—regional DDNs present an opportunity to address health equity in their catchment areas. Many chronic health conditions disproportionately harm people from racial/ethnic minority groups, people living in poverty, and other groups that are poorly served by common surveys. Accordingly, DDNs are uniquely able to track progress, or lack thereof, toward the interrelated public health goals of chronic disease prevention and elimination of racial/ethnic and socioeconomic health disparities. Third, although estimating disease prevalence was not within the scope of this study, it is also worth noting that DDNs capture objectively measured data of relevance to health equity (eg, blood pressure) that are unavailable through self-reported surveys.
Despite differences in data collection methods and variation in aforementioned estimates, the demographic and geographic distributions we observed were similar between the DDN and the surveys. These similarities highlight the usefulness of DDNs in complementing traditional public health surveillance methods. Combined with the fact that EHRs are longitudinal, our findings suggest that DDNs may also be useful in monitoring county population patterns over time, particularly in certain subpopulations, which may help assess the effectiveness of county-level interventions. The degree to which DDN population distributions influence estimates of incidence or prevalence, however, is still largely unknown and likely to vary by health condition. 18 Multiple methods can help address non-representativeness, including weighting data by demographic and geographic characteristics and developing a process to remove duplicate data on people seeking care across multiple organizations.
Despite aforementioned exceptions, the development or use of DDNs for chronic disease surveillance is still uncommon. Our data suggest that, compared with weighted survey data, EHR data may adequately describe or—in some cases—better describe populations of interest to public health agencies than current standards. Federal, state, and local public health agencies should therefore use EHR data as a source of population health information. Simple methods, such as those presented here, can help assess representativeness, coverage, and other surveillance quality indicators. Conversely, DDNs (eg, those in PCORnet) should consider engaging in population health surveillance, in partnership with public health departments, to maximize the population health benefit of this particular data-sharing approach.
Conclusions
The adult population represented in a regional DDN in Colorado differed from random population samples in surveys but nonetheless served an important complementary role for public health surveillance purposes. Compared with people in the ACS population, people in the DDN were more likely to be female, Hispanic, and older. Because the health care–seeking population differs from the population not seeking health care, we also assessed whether the DDN population approximated a random sample of the population seeking medical care. Our results addressing this question were mixed, depending on county and data source. This study builds on previous research indicating a regional DDN provides powerful information for regional health assessment and planning. Efforts to refine the usefulness of DDNs at the regional level should further assess weighting and de-duplication methods to enhance population health estimates for particular health conditions. DDNs need to further implement strategies to evaluate the representativeness of people seeking care across multiple health systems as the DDN adds new data partners.
Footnotes
Acknowledgments
Numerous organizations and people contributed to this article through the development and operation of the Colorado Health Observation Regional Data Service (CHORDS), including, but not limited to the following: Adult and Child Consortium for Health Outcomes Research and Delivery Science (Rachel Zucker, Bryant Doyle, and Will Carter); Boulder County Public Health; Broomfield County Public Health (Marie Grucelski); Colorado Health Institute (Sara Schmitt and Paul Presken); Colorado Community Managed Care Network (Jason Greer and Sarah Morgan); the Colorado Department of Public Health and Environment (Rickey Tolliver and Devon Williford); the Colorado Regional Health Information Organization (Kate Horle, Heather Culwell, and Diane Cole); Children’s Hospital Colorado (Sara Deakyne Davies, Kevin Matthews, and Angela Comer); Denver Health, Denver Public Health (Seth Foldy, Laura Podewils, and Kelly Schlapkohl); Jefferson Center for Mental Health (Jeanette Waxmonsky); Jefferson County Public Health (Kate Watkins); the Institute for Health Research, Kaiser Permanente Colorado (Matthew Daley and Mark Gray); Mental Health Center of Denver (Wes Williams and CJ McKinney); Tri-County Health Department (Alyson Shupe and Adam Anderson); and the University of Colorado Anschutz Medical Campus (Lisa Schilling and Michael Kahn).
Declaration of Conflicting Interests
The authors declared no potential conflicts of interest with respect to the research, authorship, and/or publication of this article.
Funding
This article and the activities we describe were supported through a grant from The Colorado Health Foundation in support of CHORDS.