
Abstract
Objectives
Non-Hispanic black (NHB) men have higher rates of chronic disease than men in other racial/ethnic groups. Poor diet quality is one risk factor for chronic disease, but research on the diet quality and nutrient intake of NHB men is sparse. The objective of this study was to describe and compare the diet quality and nutrient intake of NHB and non-Hispanic white (NHW) men in the United States.
Methods
We analyzed cross-sectional data on 5050 men (31.3% NHB, 68.7% NHW) who participated in the National Health and Nutrition Examination Survey (NHANES) during 2007-2012. To assess diet quality, we calculated Healthy Eating Index (HEI)–2010 scores from each participant’s 24-hour recall data. We used logistic regression models to determine if NHB men had lower odds of meeting dietary recommendations for nutrient intake than NHW men. We used linear regression models to identify significant differences in HEI-2010 scores between NHB and NHW men.
Results
After adjusting for sociodemographic measures, NHB and NHW men had similar diet quality (P = .59). Compared with NHW men, NHB men had lower odds of meeting recommendations for dietary fiber and cholesterol intake and higher odds of meeting recommendations for saturated fat and sodium intake.
Conclusion
Differences between NHB and NHW men in the intake of certain nutrients may be related to chronic disease disparities. Future research should consider racial/ethnic differences in dietary intake among men and the impact these differences have on men’s health.
In the United States, non-Hispanic black (NHB) men have a higher risk of developing chronic disease (eg, hypertension, type 2 diabetes, heart disease, some forms of cancer) 1 -7 and a higher age-adjusted mortality rate than men in other racial/ethnic groups. 8,9 Given these disparities in health, identifying and addressing the modifiable factors that contribute to chronic disease risk among NHB men are vital to improving public health. 10
Diet quality is an important modifiable risk factor in the development and management of some chronic diseases. 11 Better diet quality, as measured by the Healthy Eating Index (HEI), is linked to reduced risk of several leading causes of morbidity and mortality in the US population. 12,13 Studies have reported sex differences in diet quality (eg, women often have better diet quality than men) and racial differences in diet quality (eg, NHB adults often have poorer diet quality than non-Hispanic white [NHW] adults). 14 -20 Despite the large amount of scientific information on the diet quality of US adults, data are scarce on the diet quality of NHB men, a demographic group that is understudied and underrepresented in public health research. 1,2,21
Describing the quality and nutrient composition of NHB men’s diet could provide greater context to the health disparities that persist among men. 1,2 Our study sheds light on the diet quality of NHB men, which may be useful for clinicians, researchers, and public health practitioners in developing targeted nutritional interventions. The objectives of this study were to (1) describe the diet quality and nutrient intake of a large, diverse sample of NHB men and (2) determine if their diet quality and nutrient intake differ significantly from NHW men after adjusting for sociodemographic measures (eg, age, poverty level). We hypothesized that the diet quality of NHB men would be significantly lower than the diet quality of NHW men.
Methods
Data Source
We pooled and analyzed cross-sectional data from multiple cycles of the National Health and Nutrition Examination Survey (NHANES). 22 NHANES is a survey of a nationally representative sample of noninstitutionalized US citizens that collects data on nutrition and health from participants by conducting a series of interviewer-administered questionnaires and examinations. NHANES uses a multi-stage probability sampling scheme to select persons for participation. 23 Thus, persons have a different probability of being selected for participation. We examined data on adult participants of NHANES cycles 2007-2008, 2009-2010, and 2011-2012. A total of 17 713 adults aged ≥20 participated in these cycles. After excluding women (n = 9057), men who were not black or white (n = 3342), and men with inadequate 24-hour recall data (n = 665), the final analytical sample included 5050 men (31.3% NHB, 68.7% NHW). NHANES participants self-reported their race/ethnicity during the in-home questionnaire; NHB men were oversampled to increase the precision of estimates for this subgroup. The National Center for Health Statistics Institutional Review Board approved NHANES, and all participants provided written informed consent. The University of Illinois at Chicago Institutional Review Board considered this secondary analysis of NHANES as exempt research.
Nutrient Intake
Measures of total energy intake and nutrient intake are publicly available for each NHANES participant. These measures represent estimates derived by NHANES from the foods and beverages reported on the first day of 24-hour recall. We examined the following variables: total energy (kcal per day), total fat (grams per day), saturated fat (grams per day), protein (grams per day), dietary fiber (grams per day), carbohydrates (grams per day), total sugars (grams per day), cholesterol (milligrams per day), and sodium (milligrams per day). We compared consumption levels for nutrient intake with the 2010 Dietary Guidelines for Americans (DGAs), including: 20%-35% of energy from total fat, 10% of energy from saturated fat, 10%-35% of energy from protein, ≥38 g/day of fiber, 45%-65% of energy from carbohydrates, <300 mg/day of cholesterol, and <2300 mg/day of sodium. 24 Although a guideline for recommended total sugar intake does not exist, 25 the World Health Organization recommends that <5% of energy intake comes from added sugars. 25,26 Thus, we calculated the proportion of NHB and NHW men who met <5% of energy from total sugars to gain some insight to both groups’ added sugar consumption level. 25
Diet Quality
The primary outcome measure was diet quality as measured by HEI-2010. We calculated HEI-2010 total and component scores from participants’ first day of 24-hour dietary recall data by using the simple HEI scoring algorithm method, 27 which is detailed elsewhere. 28 Briefly, HEI-2010 is a measure of diet quality that determines how an individual’s diet aligns with the 2010 DGAs. 24 HEI-2010 measures are often used for epidemiological, policy, and nutritional research. 14,18,20 HEI-2010 total scores range from 0 to 100 (maximum score). Because of the nature of the scoring algorithm, it is not possible to receive a score of 0. Total score is the sum of 12 component scores. Nine components—total fruit, whole fruit, total vegetables, greens and beans, whole grains, dairy, total protein foods, seafood and plant proteins, and fatty acids—measure adequacy; a higher score indicates higher consumption. Three components—refined grains, sodium, and empty calories—measure moderation; a higher score indicates lower consumption. Greater intake of foods that contribute to the measures of adequacy increases the HEI-2010 total score. Lower intake of foods that contribute to the measures of moderation increases the HEI-2010 total score. Six HEI-2010 components (total fruit, whole fruit, total vegetables, greens and beans, total protein foods, and seafood and plant proteins) contribute 5 points to the total score; 5 HEI-2010 components (whole grains, dairy, refined grains, sodium, and fatty acids) contribute 10 points to the total score; and 1 component (empty calories) contributes 20 points to the total score.
Sociodemographic and Health Measures
We examined the following characteristics: age (20-35, 36-50, 51-65, >65 years), education level (<high school diploma, high school diploma or equivalent, some college, ≥college degree), marital status (married, divorced or separated, widowed, living with partner, or never married), and poverty level (<100.0%, 100.0%-149.9%, 150.0%-199.9%, 200.0%-299.9%, and ≥300.0% of the federal poverty level [FPL]), number of household members (continuous), and body mass index (BMI, in kg/m2). 29,30 We selected these sociodemographic and health measures because they are related to diet quality. 14 -16 Participants self-reported their age, education level, marital status, income, and number of household members. BMI was calculated from height and weight measurements collected by trained health technicians during the NHANES physical examination. BMI was categorized as underweight (<18.5 kg/m2), normal weight (18.5-24.9 kg/m2), overweight (25.0-29.9 kg/m2), and obese (≥30.0 kg/m2). 30
Statistical Analysis
We calculated data on descriptive statistics (ie, weighted means and frequencies) for sociodemographic and health measures among all men, stratified by race. We conducted the Rao-Scott χ2 test and the t test to determine differences in measures by race, with P < .05 considered significant. We calculated the weighted mean intake of each nutrient among NHB and NHW men and the weighted percentage of NHB and NHW men who met dietary recommendations for each nutrient.
We used multivariable-adjusted logistic regression models to determine associations between black race and decreased odds of meeting dietary recommendations for nutrient intake, and between black race and lower HEI-2010 total score and HEI-2010 component scores. Model 1 included the measures for black race and day of the week the participant had 24-hour recall. We modeled day of the week as weekday (Monday through Thursday) vs weekend (Friday through Sunday). Model 2 included all measures from Model 1, as well as age range and education level. Model 3 included all measures from Model 2, as well as FPL, marital status, number of household members, and BMI.
We conducted all analyses by using SAS version 9.4. 31 We used estimated NHANES sampling weights derived after combining data sets from the 3 selected cycles. 32
Results
Overall, 28.6% of men were aged 36-50 and 31.3% of men had ≥college degree (Table 1). Most (59.2%) study participants were married and 10.8% had <100% FPL. The mean BMI was 28.7 kg/m2; 34.5% of study participants were obese. We found significant differences between NHB and NHW men for every measure except BMI. Compared with NHW men, a higher percentage of NHB men had <high school diploma (25.3% vs 12.6%) and were <100% FPL (22.6% vs 9.1%). A higher percentage of NHW men than NHB men reported being married (62.0% vs 40.5%), and a higher percentage of NHB men than NHW men were obese (38.0% vs 34.0%).
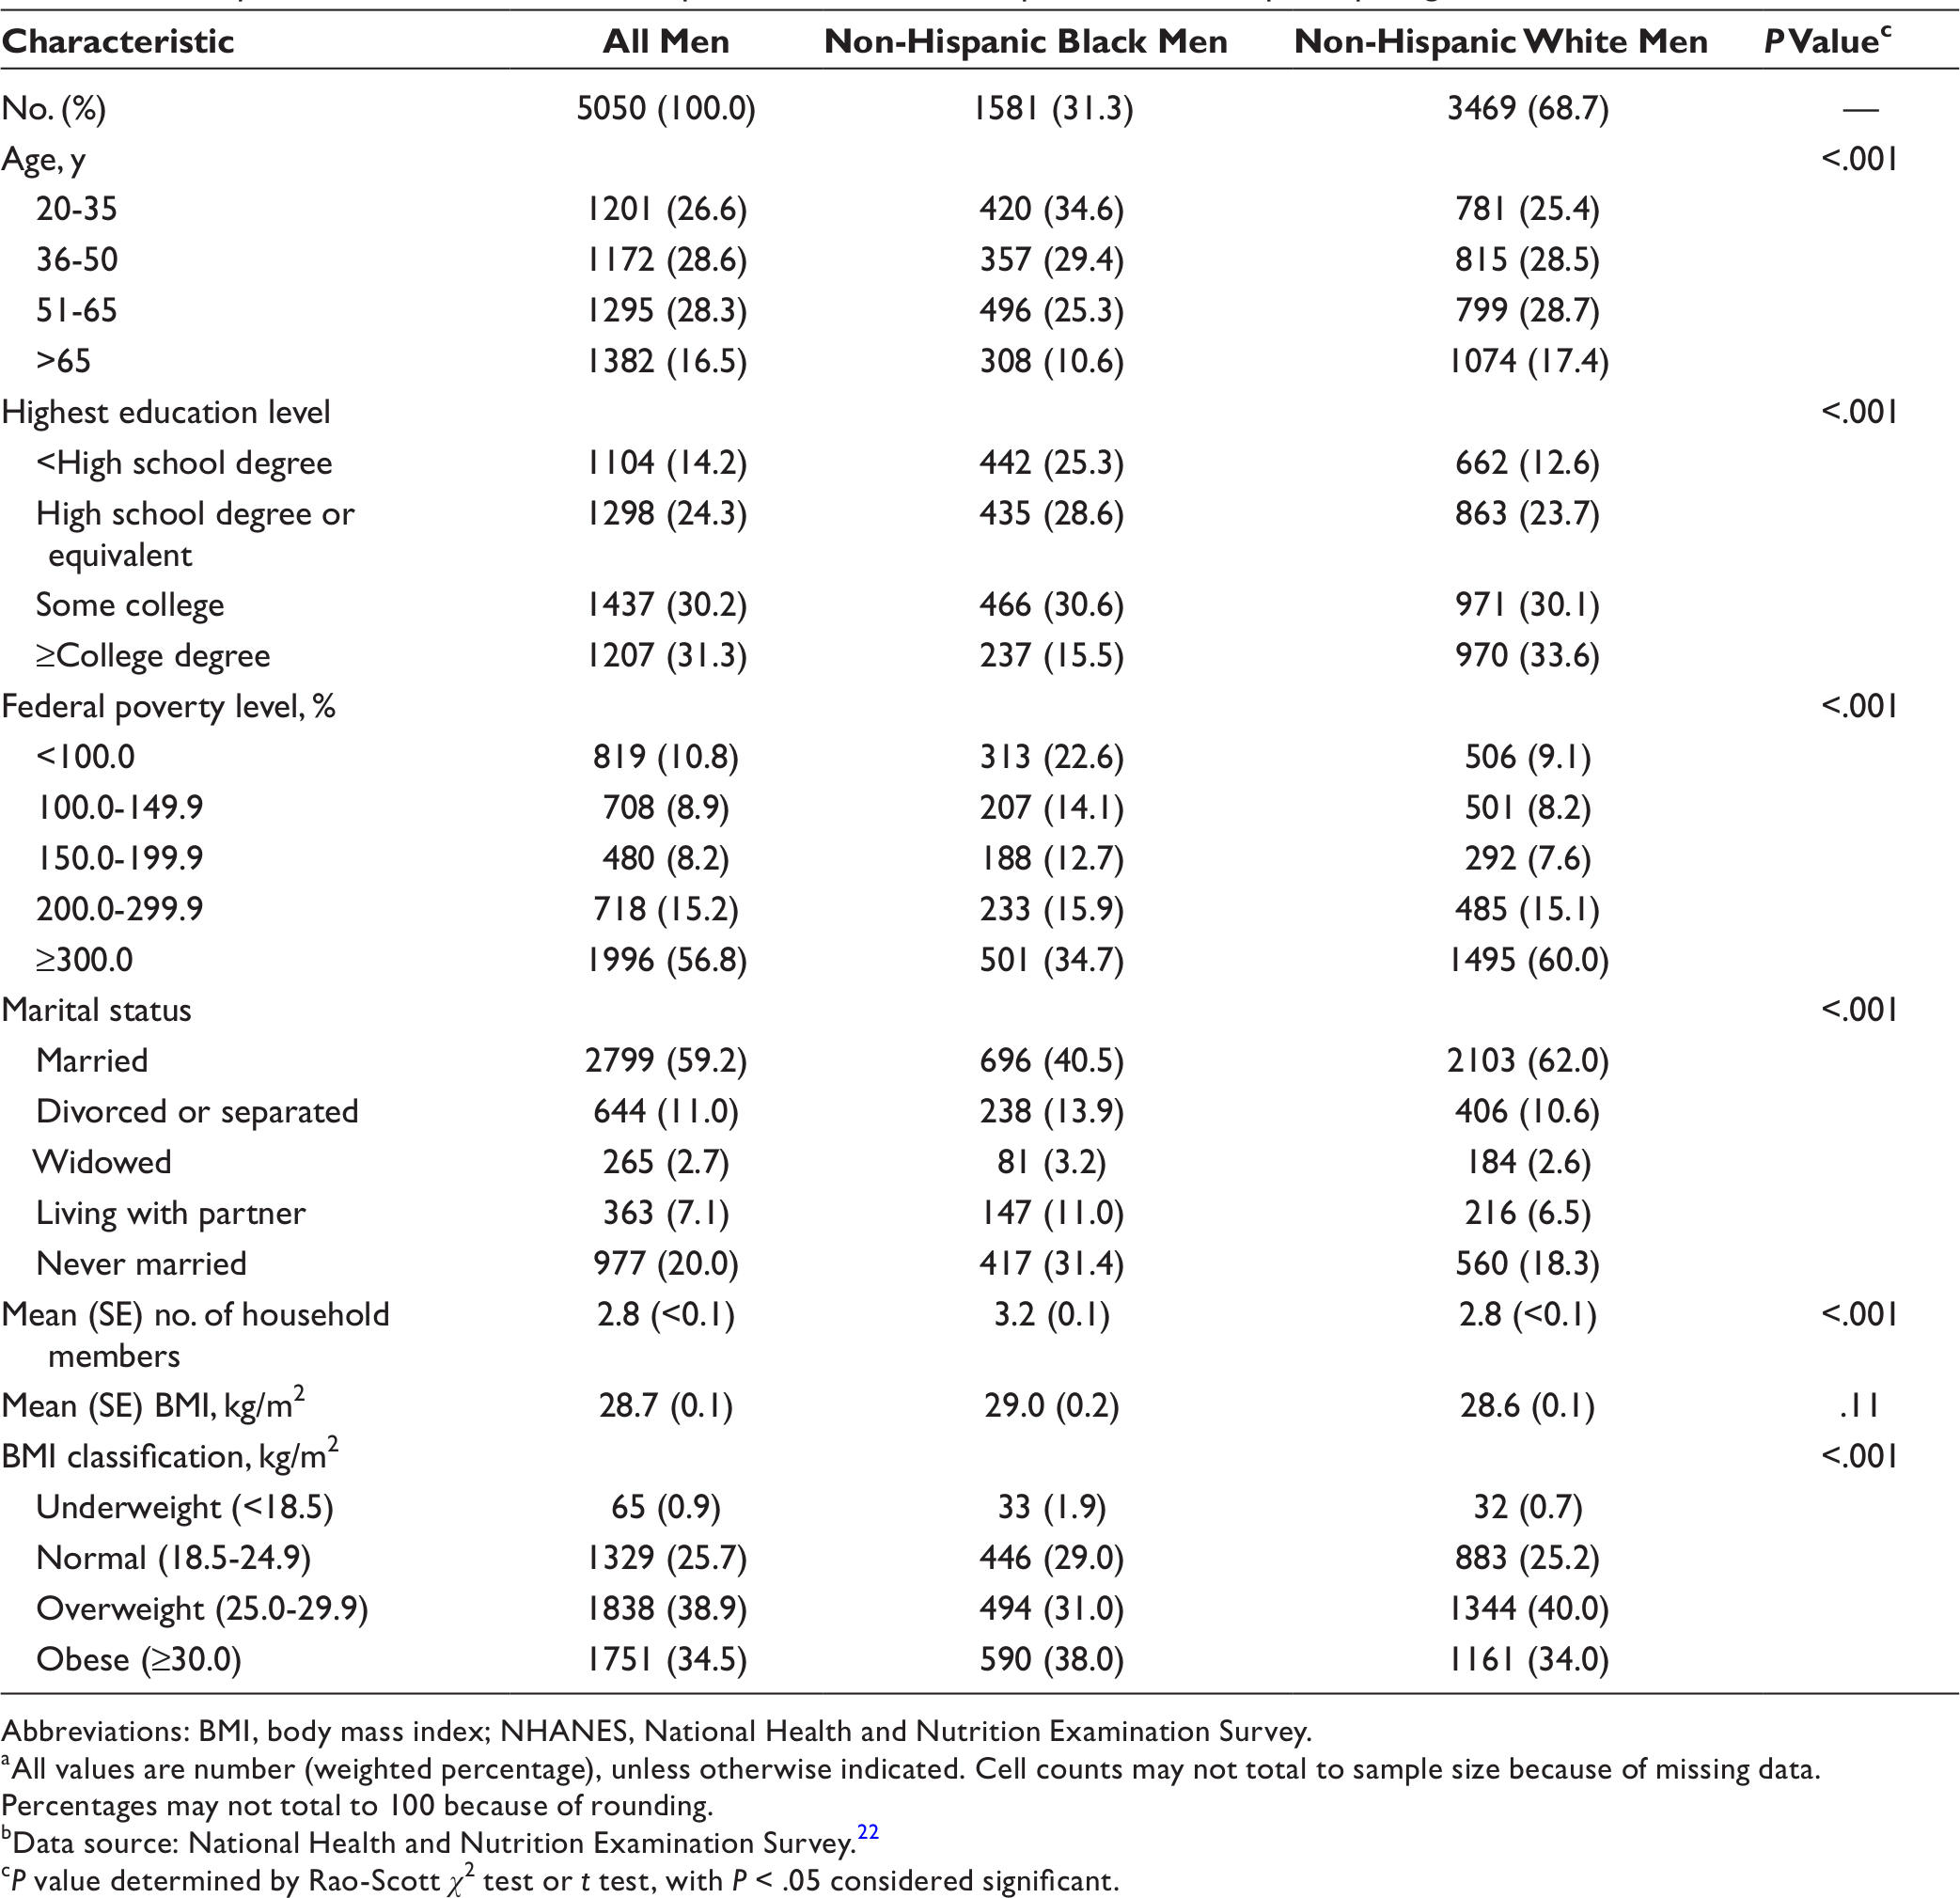
Abbreviations: BMI, body mass index; NHANES, National Health and Nutrition Examination Survey.
aAll values are number (weighted percentage), unless otherwise indicated. Cell counts may not total to sample size because of missing data. Percentages may not total to 100 because of rounding.
bData source: National Health and Nutrition Examination Survey. 22
c P value determined by Rao-Scott χ 2 test or t test, with P < .05 considered significant.
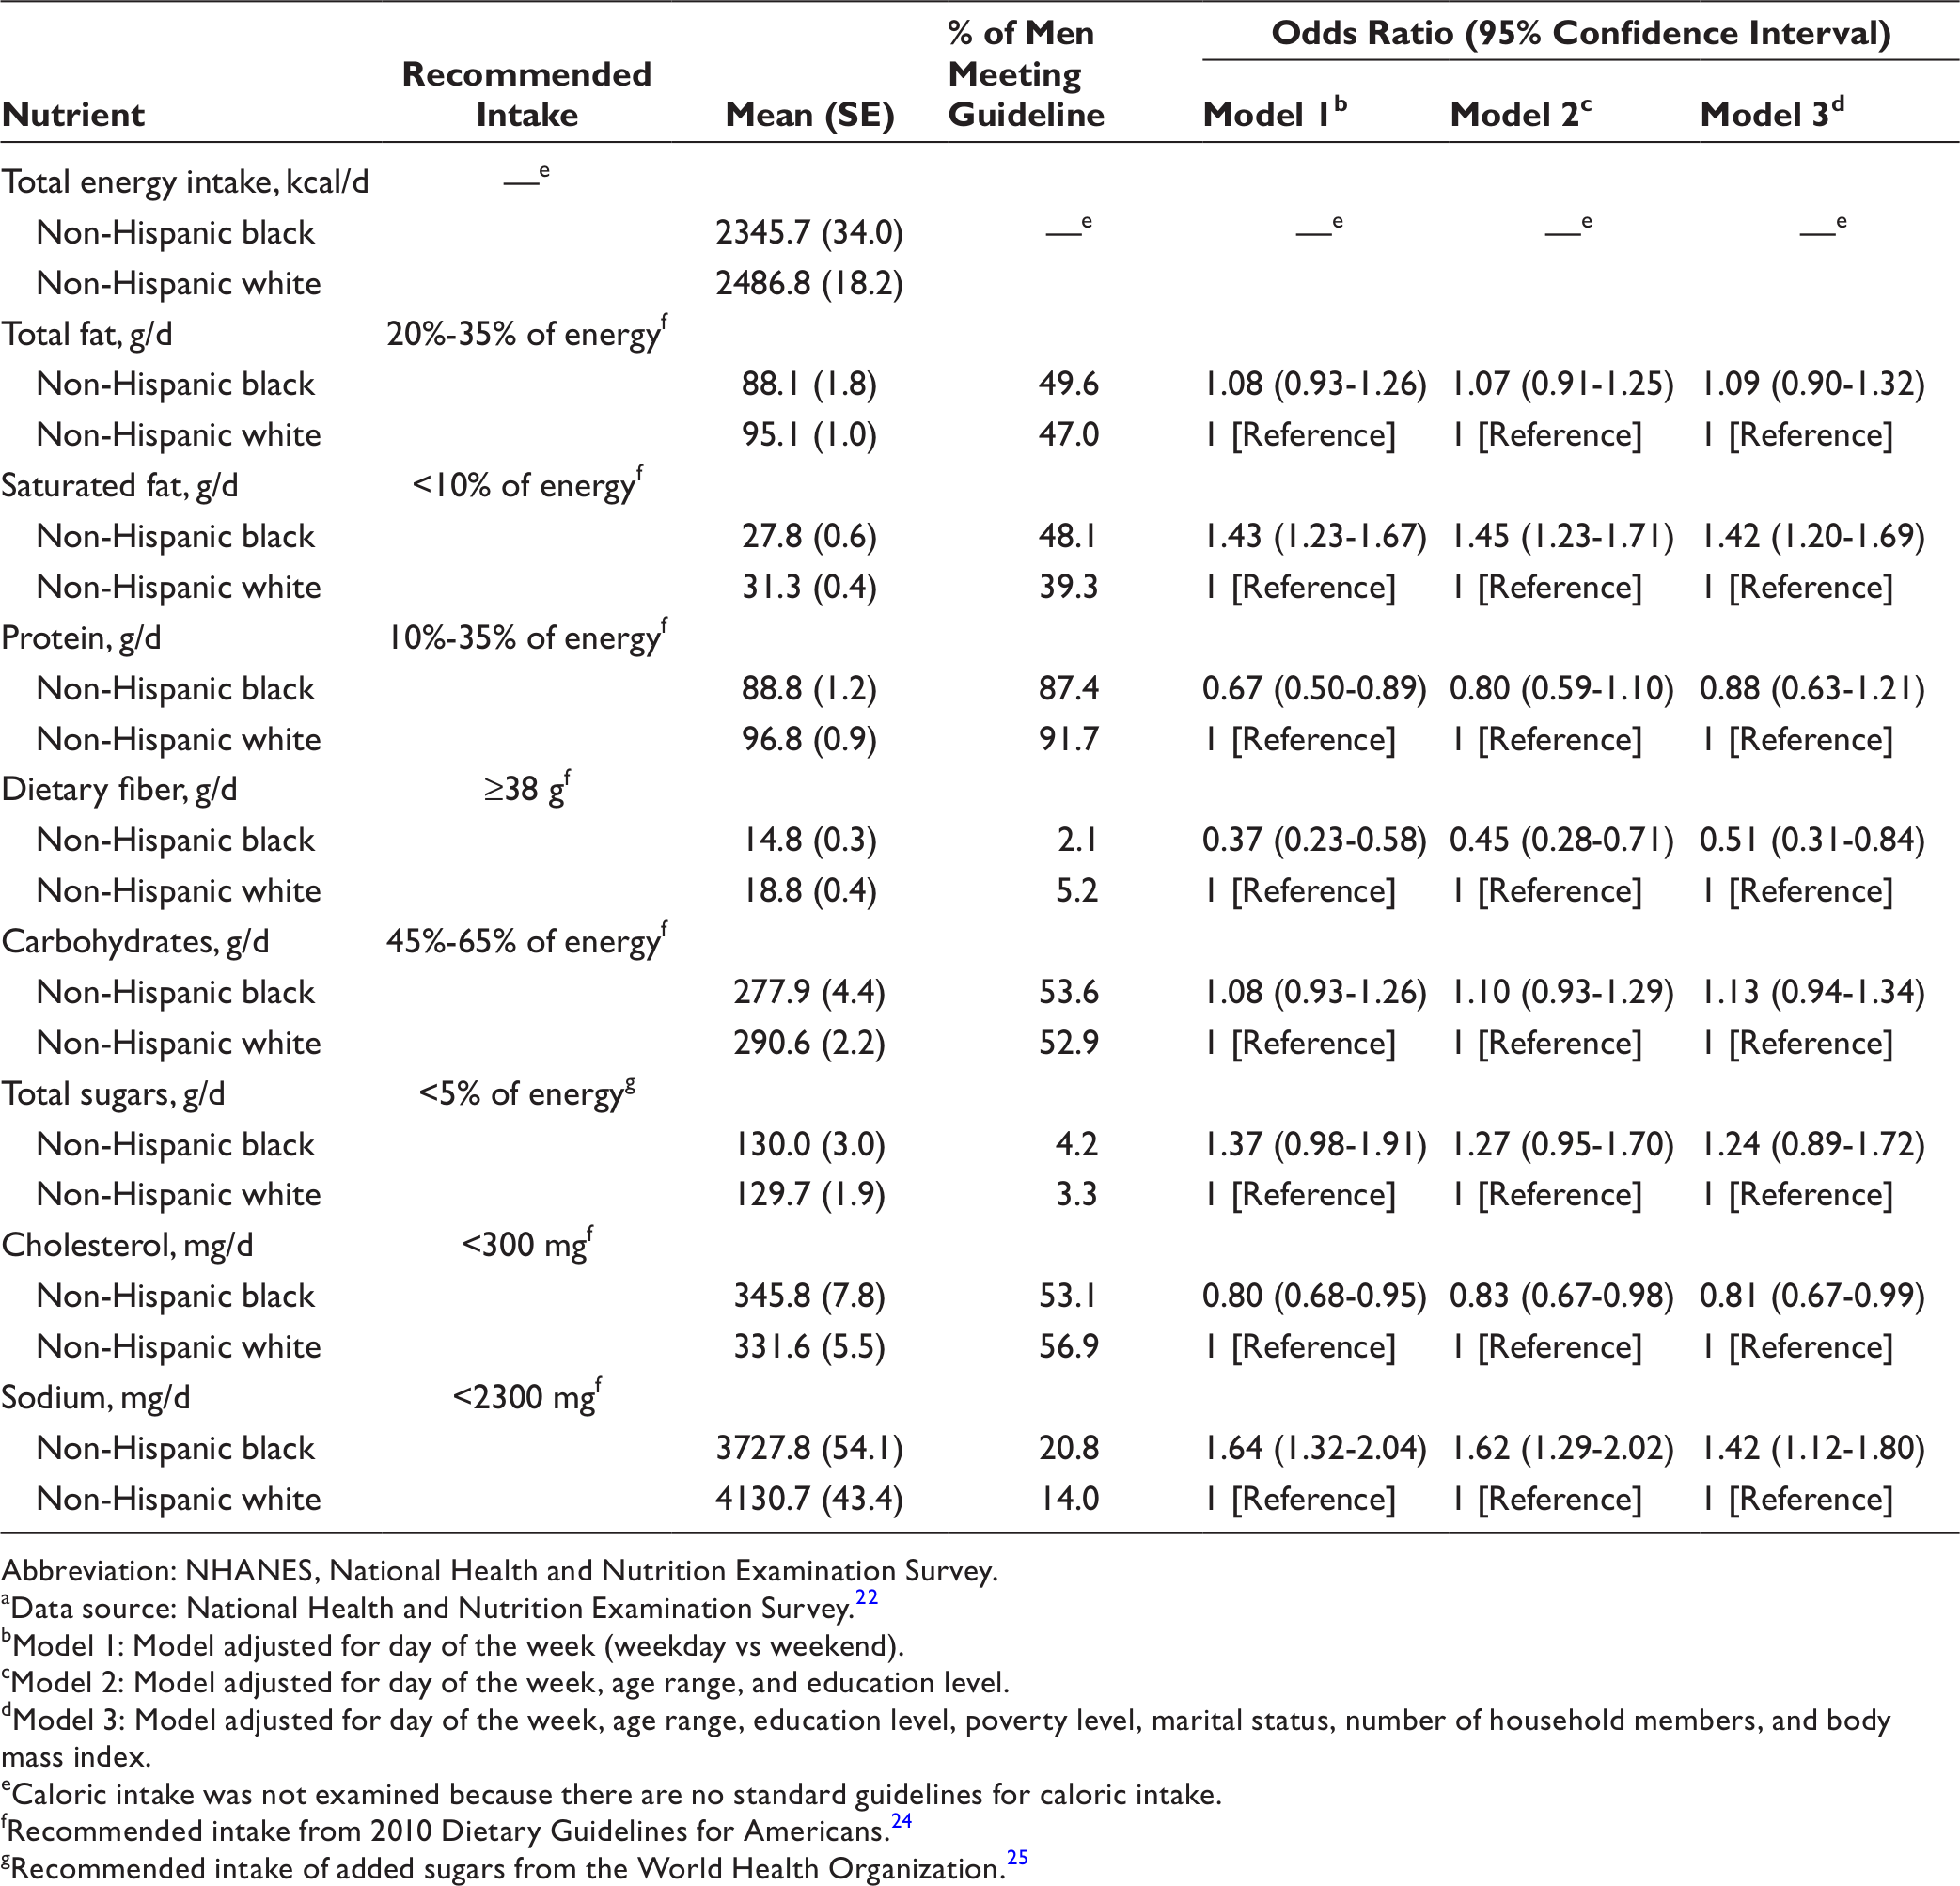
Fewer than 7% of NHB and NHW men met dietary recommendations for dietary fiber (Table 2). Compared with NHW men, NHB men were less likely to meet dietary recommendations for intake of protein, cholesterol, and dietary fiber. After adjusting for all sociodemographic and health measures (Model 3), NHB men had significantly lower odds of meeting dietary recommendations for dietary fiber intake (odds ratio [OR] = 0.51; 95% confidence interval [CI], 0.31-0.84) and cholesterol intake (OR = 0.81; 95% CI, 0.67-0.99) than NHW men. NHB men had significantly higher odds of meeting dietary recommendations for saturated fat intake (OR = 1.42; 95% CI, 1.20-1.69) and sodium intake (OR = 1.42; 95% CI, 1.12-1.80) than NHW men.
Results from logistic regression models examining the association between race and meeting recommendations for nutrient intake among non-Hispanic black and non-Hispanic white men (N = 5050) participating in NHANES, 2007-2012 a
Abbreviation: NHANES, National Health and Nutrition Examination Survey.
aData source: National Health and Nutrition Examination Survey. 22
bModel 1: Model adjusted for day of the week (weekday vs weekend).
cModel 2: Model adjusted for day of the week, age range, and education level.
dModel 3: Model adjusted for day of the week, age range, education level, poverty level, marital status, number of household members, and body mass index.
eCaloric intake was not examined because there are no standard guidelines for caloric intake.
fRecommended intake from 2010 Dietary Guidelines for Americans. 24
gRecommended intake of added sugars from the World Health Organization. 25
The mean HEI-2010 total score was 46.1 for NHB men and 49.4 for NHW men (Table 3). After adjusting for sociodemographic and health measures (Model 3), we found no difference in HEI-2010 total score between NHB and NHW men (β = −0.3; standard error [SE] = 0.6; P = .59). Compared with NHW men, NHB men had a significantly lower HEI-2010 component score for total vegetables (β = −0.3; SE = 0.6; P < .001), seafood and plant protein (β = −0.2; SE = 0.1; P = .02), and dairy (β = −1.5; SE = 0.1; P < .001) but a significantly higher HEI-2010 component score for total fruit (β = 0.4; SE = 0.1; P < .001), total protein (β = 0.2; SE = 0.1; P = .001), and fatty acids (β = 0.9; SE = 0.2; P < .001) (Table 3).
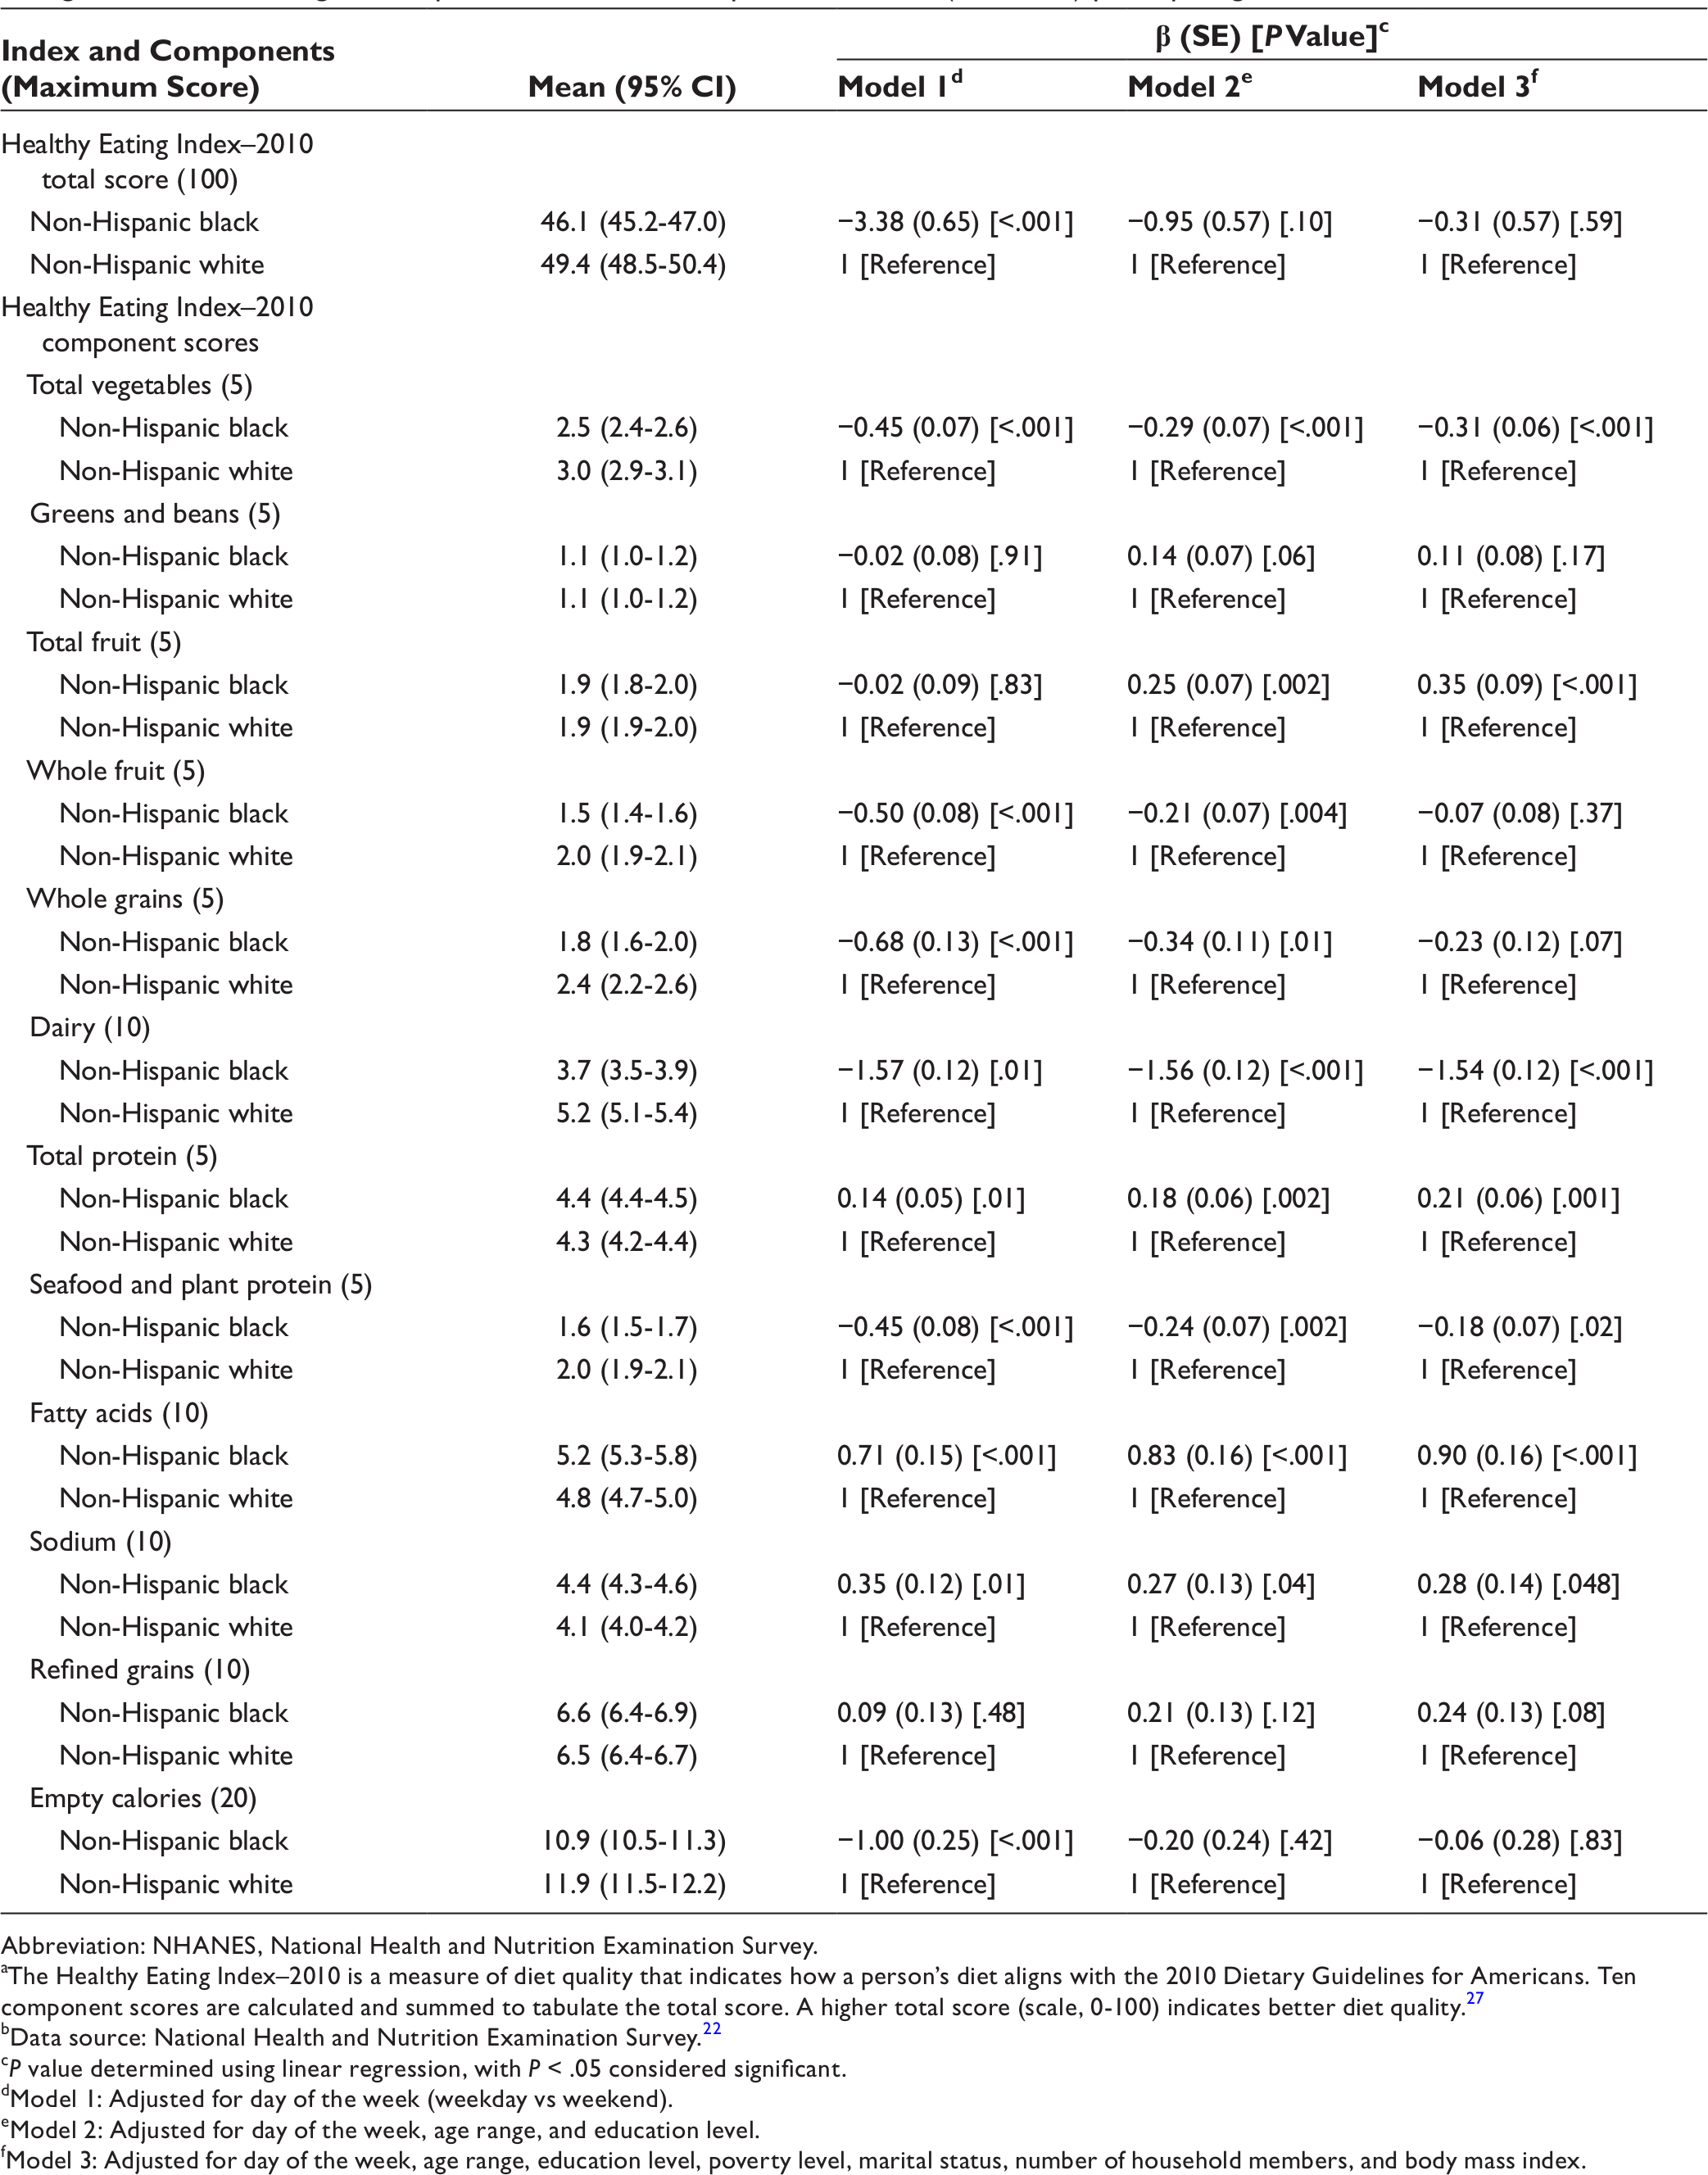
Abbreviation: NHANES, National Health and Nutrition Examination Survey.
aThe Healthy Eating Index–2010 is a measure of diet quality that indicates how a person’s diet aligns with the 2010 Dietary Guidelines for Americans. Ten component scores are calculated and summed to tabulate the total score. A higher total score (scale, 0-100) indicates better diet quality. 27
bData source: National Health and Nutrition Examination Survey. 22
c P value determined using linear regression, with P < .05 considered significant.
dModel 1: Adjusted for day of the week (weekday vs weekend).
eModel 2: Adjusted for day of the week, age range, and education level.
fModel 3: Adjusted for day of the week, age range, education level, poverty level, marital status, number of household members, and body mass index.
Discussion
This research contributes to the literature on the diet of NHB men in the United States, which is limited. 33 -38 We hypothesized that NHB men would have poorer diet quality than NHW men after reviewing the literature on black–white disparities in diet quality among US adults. 14 -19 Our findings revealed that NHB and NHW men had similar diet quality after adjusting for sociodemographic factors such as education and poverty level. This finding suggests that education and poverty level may be important contributors to racial/ethnic disparities in dietary intake often observed among men. 1,2,17 -19
NHB and NHW men in our study differed in their consumption of certain nutrients and food types (eg, total vegetables, dietary fiber, saturated fat, cholesterol, and sodium). These results mirror findings from other studies that described white differences in dietary intake. 14 -19,39,40 In our study, HEI-2010 component scores for total vegetables and dairy were, on average, lower among NHB men than among NHW men. Studies by Hiza et al 14 and Kirkpatrick et al 15 found that black men and women who participated in NHANES had significantly lower total vegetable and milk component scores than white men and women. Kant et al 16 observed that black men and women who participated in NHANES reported a lower intake of vegetables and calcium than white men and women. Furthermore, Fulgoni et al 39 reported that black persons consumed significantly fewer calories per day from dairy than non-black persons. Similar to the study by Fulgoni et al, our findings on dairy consumption among NHB men may be explained by the high prevalence of lactose intolerance among NHB adults in the United States. Findings on vegetable intake among NHB men, however, are important and warrant additional research. Vegetable consumption is low in the United States 41 -43 ; studies show that NHB adults consume significantly fewer vegetables than other racial/ethnic groups. 42,43 Because vegetable intake is associated with a decreased risk of chronic disease, additional research is needed to describe the relationship between vegetable consumption and racial/ethnic disparities in the prevalence of chronic disease among men. 44
In our study, NHB men had lower odds of meeting dietary recommendations for dietary fiber and cholesterol intake than NHW men. Go et al 45 found similar results when comparing black and white adults who participated in NHANES. High fiber intake is associated with a reduced risk of type 2 diabetes and colorectal cancer 46,47 ; high cholesterol intake substantially increases the risk of cardiovascular disease. 48 NHB men in our study fared better than NHW men in 2 key areas: saturated fat and sodium. NHB men had significantly higher odds of meeting dietary recommendations for saturated fat and sodium intake than NHW men. Newby and colleagues 33 reported that total fat and sodium intake were lower among black men than among white men who participated in the Reasons for Geographic and Racial Differences in Stroke study. Like cholesterol, saturated fat, when consumed in excess, increases the risk of cardiovascular disease. 49 Excess sodium consumption is an ongoing public health concern in the United States because of its association with hypertension. 50,51 These findings on racial/ethnic differences in nutrient intake among men further highlight the need for research on how these dietary factors contribute to men’s health.
It is important to note that high percentages of men in both groups failed to meet specific dietary recommendations. Only half of NHB and NHW men met recommendations for cholesterol intake, and fewer than half met recommendations for saturated fat intake. More than 90% of men in both groups exceeded the daily allowance of sodium, and fewer than 6% of men in both groups met recommendations for dietary fiber intake. These findings indicate that both groups need to improve consumption of key nutrients to improve overall diet quality.
Strengths and Limitations
This study had 2 strengths. One strength was the use of NHANES data, which included a large sample of NHB and NHW men. Another strength was use of the HEI-2010, which directly measures how an individual’s diet aligns with the DGAs.
This study also had several limitations. First, we examined only 1 day of dietary intake. Thus, we were not able to assess usual dietary intake and long-term dietary patterns. A detailed examination of dietary patterns would provide more accurate information on the dietary deficiencies of men that should be targeted for intervention. Second, we did not include geographic measures (eg, proximity to grocery stores) in the analysis; as such, we were unable to account for environmental factors that have previously been linked to diet quality in adults. 52 Third, the study was limited by the self-reporting of information, which increased the potential for recall errors. Finally, this study offered no insight into other diet-related measures (eg, food purchasing behavior, access to healthy food) that may affect the diets of men. Diet-related measures are a promising area of research for those currently examining the diet and diet-related behaviors of NHB men in the United States.
Conclusions
Our study contributes to an understanding of the dietary intake of NHB men and the dietary differences between NHB and NHW men. Although the diet quality of NHB and NHW men participating in NHANES 2007-2012 was similar after adjusting for sociodemographic and health measures, NHB and NHW men differed in their intake of nutrients and food types. These differences may be explained by myriad sociocultural factors, such as cooking practices, household structure, and cultural attitudes toward healthy eating. 35 -38 Additional research is needed to examine how these sociocultural factors relate to racial/ethnic differences in the dietary intake of men. Unhealthy behaviors, such as excessive consumption of convenience foods with poor nutritional profiles, may explain why most men did not meet DGA recommendations. 35,36 Future research should measure the dietary patterns, food purchasing behaviors, and food preferences of NHB men and evaluate how racial/ethnic differences in dietary intake among men are related to differences in chronic disease risk.
Footnotes
Acknowledgments
The authors acknowledge Victor Fulgoni III, PhD, and his staff at Nutrition Impact, LLC (Battle Creek, Michigan), for their support in calculating the HEI-2010 total and component scores for the NHANES participants in our analytic sample.
Declaration of Conflicting Interests
The authors declared no potential conflicts of interest with respect to the research, authorship, and/or publication of this article.
Funding
The authors declared the following financial support with respect to the research, authorship, and/or publication of this article: Research reported in this article was supported by the National Cancer Institute of the National Institutes of Health (NIH) (R25CA057699); the National Heart, Lung, and Blood Institute of NIH (T32HL007034); and the National Institute of Minority Health and Health Disparities of NIH (P60MD000214). The content is solely the responsibility of the authors and does not necessarily represent the official views of NIH.