
Abstract
Objectives:
High-risk opioid-prescribing practices contribute to a national epidemic of opioid-related morbidity and mortality. The objective of this study was to determine whether the adoption of state-level opioid-prescribing guidelines that specify a high-dose threshold is associated with trends in rates of opioid overdose hospitalizations, for prescription opioids, for heroin, and for all opioids.
Methods:
We identified 3 guideline states (Colorado, Utah, Washington) and 5 comparator states (Arizona, California, Michigan, New Jersey, South Carolina). We used state-level opioid overdose hospitalization data from 2001-2014 for these 8 states. Data were based on the State Inpatient Databases and provided by the Healthcare Cost and Utilization Project (HCUP), Agency for Healthcare Research and Quality, via HCUPnet. We used negative binomial panel regression to model trends in annual rates of opioid overdose hospitalizations. We used a multiple-baseline difference-in-differences study design to compare postguideline trends with concurrent trends for comparator states.
Results:
For each guideline state, postguideline trends in rates of prescription opioid and all opioid overdose hospitalizations decreased compared with trends in the comparator states. The mean annual relative percentage decrease ranged from 3.2%-7.5% for trends in rates of prescription opioid overdose hospitalizations and from 5.4%-8.5% for trends in rates of all opioid overdose hospitalizations.
Conclusions:
These findings provide preliminary evidence that opioid-dosing guidelines may be an effective strategy for combating this public health crisis. Further research is needed to identify the individual effects of opioid-related interventions that occurred during the study period.
During the past 2 decades, changes in opioid-prescribing practices for chronic noncancer pain—including increases in average morphine-equivalent daily dose (MEDD)—contributed to a national epidemic of opioid-related hospitalizations and deaths. 1 -5 Numerous emerging state and national opioid-prescribing guidelines focused initially on best practices, such as opioid treatment agreements and patient risk evaluation, rather than on dosing guidance. 6
High-dose opioid use is associated with substantial depression of central respiratory drive 7,8 and higher opioid-related morbidity and mortality compared with lower doses. 9 -14 A large health plan–based study demonstrated a 9-fold increase in overdose risk at doses ≥100 mg MEDD compared with doses <20 mg MEDD. 11 Although there is no manifest dose-response inflection point at which risk markedly increases, 14 and consensus is lacking on the most appropriate high-dose threshold, 15 opioid-prescribing guidelines that recommend avoiding high doses may decrease unintentional prescription opioid overdose. 15 In 2007, Washington State became the first state to implement an opioid guideline specifying a high-dose threshold (120 mg MEDD) and associated clinical guidance. 16 Other jurisdictions and organizations followed suit, including Utah in 2009 (120-200 mg MEDD) and Colorado in 2012 (120 mg MEDD). 17 High-dose thresholds vary widely, from a high of 200 mg MEDD (eg, the 2009 American Pain Society/American Academy of Pain Medicine guideline) to a low of 50 mg MEDD (eg, the 2014 Centers for Disease Control and Prevention guideline) but have tended to become lower over time as more has been learned about the risks of high-dose opioids. 6,15,18
Washington State workers’ compensation pharmacy data 19 and Medicaid data 20 showed reductions—of 50% and 16%, respectively—in the percentage of patients who were prescribed high-dose opioids (≥120 mg MEDD) after adoption of the 2007 guideline (2010 vs 2006). However, few studies have systematically evaluated the effects of opioid-prescribing guidelines on health outcomes such as mortality and opioid overdose. Prescription opioid-related mortality continued to rise in the Washington State workers’ compensation population through 2009, then dropped by about 50% in 2010. 21 Studies of prescription opioid overdose using Washington State workers’ compensation data 22 and Medicaid data 23 were inconclusive regarding the effect of the 2007 guideline, in part because no rigorous comparison group was used. However, during the same period, national data showed a steady increase in opioid-related morbidity. 22 A 2016 difference-in-differences study found that the combined implementation of a mandated prescription drug monitoring program (state-based electronic databases that collect dispensing data for controlled prescription drugs) review and pain clinic laws (which impose requirements such as state registration, physician ownership, prescribing restrictions, and record keeping) reduced prescribed opioids by 80 morphine equivalents per state resident per year and reduced annual prescription opioid overdose mortality by 1.2 per 100 000 state residents; however, the study did not assess opioid-dosing guidelines. 24
Although the increase in the prescription opioid-related death rate slowed after 2014, the heroin-related death rate continues to increase. 2 A 2013 study of national overdose hospitalizations during 1993-2009 showed strong bidirectional associations: each prescription opioid overdose admission predicted an increase in the subsequent year’s heroin overdose admissions by a factor of 1.26, and each heroin overdose admission predicted an increase in the subsequent year’s prescription overdose admissions by a factor of 1.57. On the basis of these findings, the authors suggested that policies restricting prescription opioid availability could have the unintended consequence of increasing heroin-related morbidity. 25 However, Dowell et al 24 found no evidence that mandated prescription drug monitoring program review and pain clinic laws resulted in increased heroin-related overdose death rates (ie, no association between restricted prescription opioid supply and consequent heroin substitution); rather, the authors suggested that such policies may reduce heroin initiation by reducing population exposure to prescription opioids. A 2017 study by Tedesco et al 26 found that national emergency department and inpatient discharge rates for prescription opioid overdose began to decline around 2010, whereas discharge rates for heroin overdose began to increase around 2008. Although many factors drive opioid overdose trajectories, the pattern reported by Tedesco et al 26 is more compatible with the hypothesis that exposure to high-risk opioid prescribing led to an increase in heroin misuse and morbidity than with the hypothesis that effective opioid guidelines and policies caused the increase via restriction of the prescription opioid supply. To support the latter hypothesis, the increase in heroin overdose rates should have occurred at or after the downturn in prescription opioid overdose trends. Finally, a review in 2016 found no consistent evidence of an association between prescription opioid policies and increases in heroin use or overdose. In most studies reviewed, increased rates of heroin use preceded implementation of prescription opioid policies. 27
To reduce opioid-related morbidity and mortality, state agencies need better evidence to underpin and refine available policy approaches. In this study, we assessed associations between adoption of state-level opioid-dosing guidelines and subsequent trends in rates of opioid overdose hospitalizations—for prescription opioids, for heroin, and for all opioids.
Methods
Study Design
We compared postguideline trends in 3 guideline states with concurrent trends in 5 comparator states by using 14 years of state-level panel data on opioid overdose hospitalizations. (Panel refers to pooling data by both state and time, rather than only by time, resulting in trend estimates that account for individual state variation; using panel data and panel regression techniques minimizes aggregation bias.) Numerous factors may have played a role in reducing opioid-related morbidity, independent of state-based guidelines and policies: opioid-prescribing guidelines promulgated by national organizations (Table 1), 36 -38 changes in health services delivery (eg, shifts from inpatient care to outpatient care, improvements in emergency medical systems, widening naloxone distribution), increasing awareness of opioid-related risks among health care providers that might have led to improved standards of practice, and increasing public awareness of such risks that might have reduced demand for opioid prescriptions. Use of concurrent comparators was particularly important because national rates of prescription opioid overdose hospitalizations began to decline around 2010. 26 The 3 guideline states adopted their opioid-dosing guidelines in different years (2007, 2009, and 2012), setting the stage for a multiple-baseline natural experiment. 39 We used a difference-in-differences study design 40 to compare postguideline trends in each guideline state with concurrent trends in the 5 comparator states, controlling for state-level baseline rates and for trends before the guideline adoption year. On the basis of the steep increases in rates of opioid overdose hospitalizations observed nationally during most of this period, we would expect average postguideline rates to remain higher than average preguideline rates. Therefore, this analysis focused on assessing changes in trends across periods: whether adoption of state-based guidelines and policies was associated with a flattening or a reversal of the rapidly increasing preguideline trends.
State and national opioid-dosing guidelines and policies, 2001-2014a
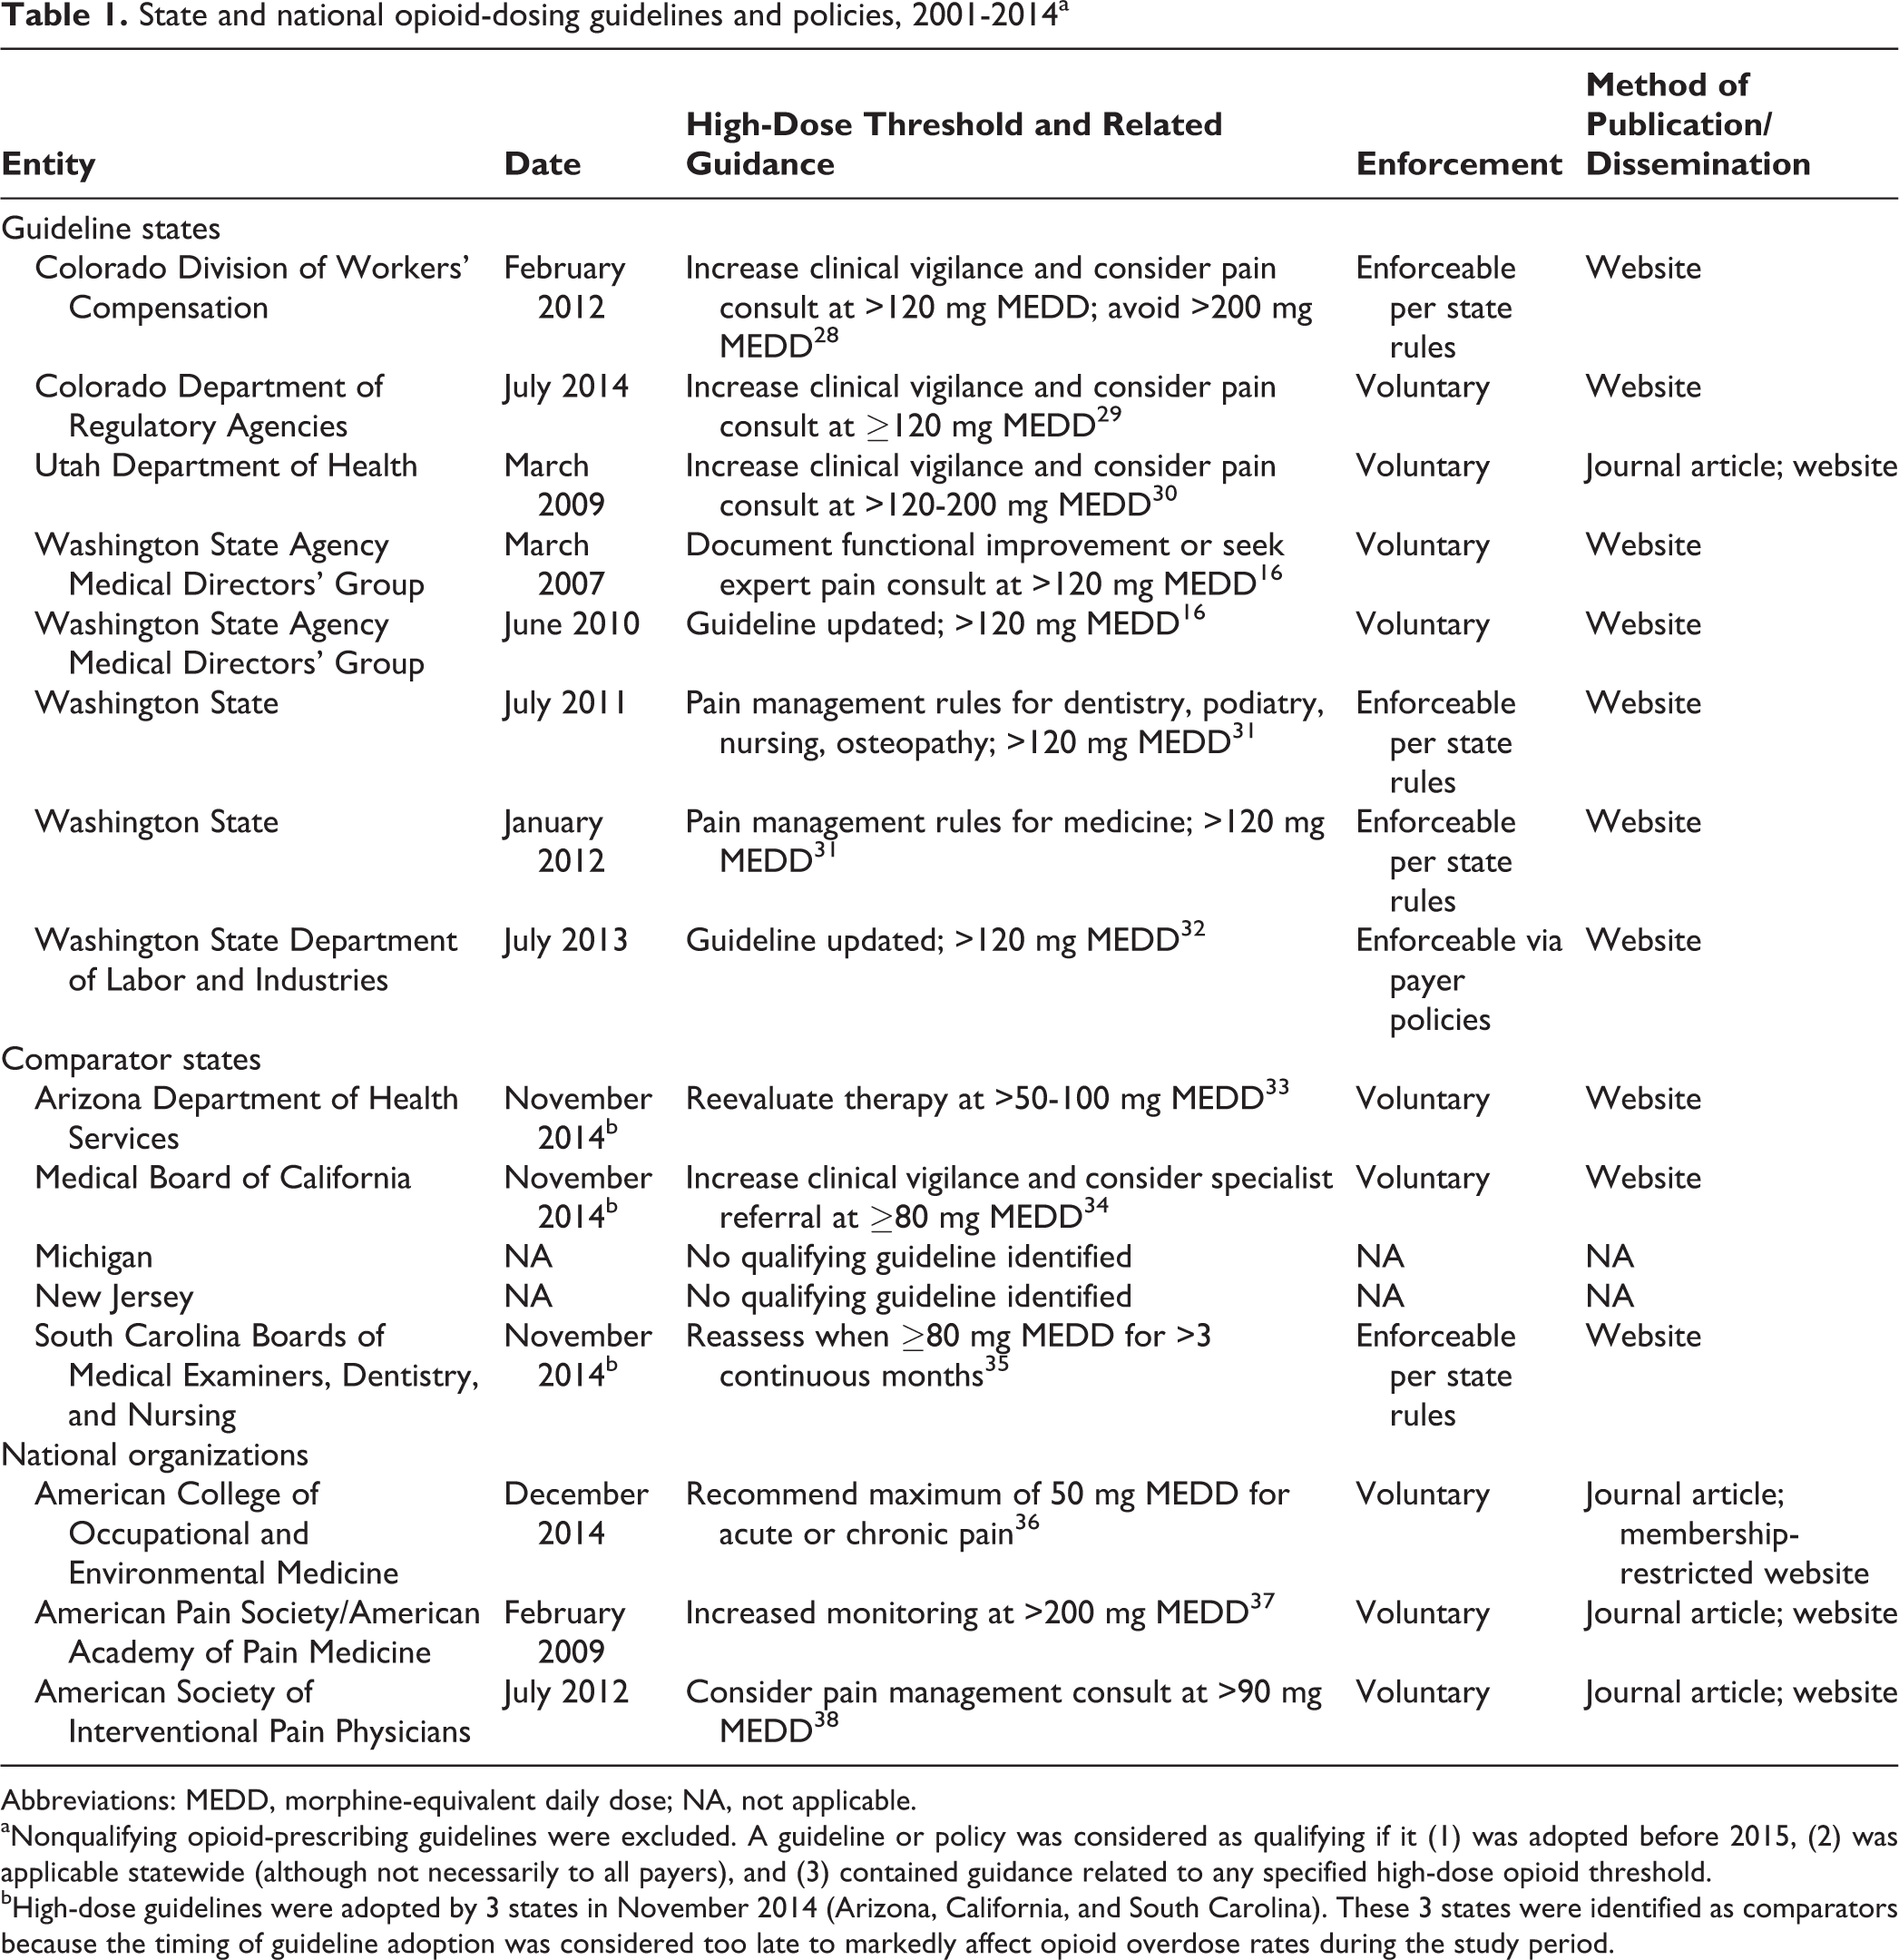
Abbreviations: MEDD, morphine-equivalent daily dose; NA, not applicable.
aNonqualifying opioid-prescribing guidelines were excluded. A guideline or policy was considered as qualifying if it (1) was adopted before 2015, (2) was applicable statewide (although not necessarily to all payers), and (3) contained guidance related to any specified high-dose opioid threshold.
bHigh-dose guidelines were adopted by 3 states in November 2014 (Arizona, California, and South Carolina). These 3 states were identified as comparators because the timing of guideline adoption was considered too late to markedly affect opioid overdose rates during the study period.
Data Source and Samples
HCUPnet is a free online resource for data summaries from the Agency for Healthcare Research and Quality’s Healthcare Cost and Utilization Project (HCUP). 41 Using HCUPnet, we downloaded annual state-level hospital discharge data summaries from the State Inpatient Databases (SID) for a convenience sample of 8 states that satisfied 2 selection criteria. The first criterion was that we had definitively identified timing and the presence or absence of statewide opioid guidelines with a high-dose threshold. (We had conducted this work in preparation for a separate planned study focused on injured workers; our SID sample was limited by criteria not relevant to the present study, such as workers’ compensation being a distinct payer category.) The second criterion was that SID data were publicly available via HCUPnet from 2001 through 2014 for each diagnosis code listed in the Opioid Overdose Hospitalizations section (ie, data had not been redacted by HCUPnet because of small numbers). Application of these criteria resulted in 3 guideline states (Colorado, Utah, and Washington) and 5 comparator states (Arizona, California, Michigan, New Jersey, and South Carolina).
Qualifying Opioid Guidelines and Policies
We searched peer-reviewed literature, gray literature, and the internet for qualifying opioid-prescribing guidelines or policies. A qualifying guideline or policy (1) was adopted before 2015, (2) was applicable statewide (but might apply only to a subset of patients, such as injured workers under state workers’ compensation rules), and (3) contained guidance related to any specified high-dose opioid threshold. We queried state agencies as needed to resolve ambiguity in policy details or timing. In addition, we queried workers’ compensation agencies in each state for which a qualifying workers’ compensation-specific guideline was not identified to confirm absence of such policies through December 2014. We identified Colorado, Utah, and Washington State as states that had implemented qualifying opioid-prescribing guidelines and policies with a high-dose threshold; threshold-related guidance varied by state (Table 1). We based postguideline periods on adoption date of the first qualifying guideline or policy in each guideline state, beginning in 2012 for Colorado, 17,28 2009 for Utah, 30 and 2007 for Washington State. 16 Each guideline state adopted the initial qualifying guideline or policy in the first quarter of the postguideline period. In Colorado 29 and Washington State, 32 updates and implementation by different state agencies led to multiple adoption dates.
The 2012 Colorado guideline, adopted by the Division of Workers’ Compensation, was enforceable with respect to chronic pain treatment of injured workers and recommended clinical vigilance >120 mg MEDD and avoidance of doses >200 mg MEDD. 28 The 2009 Utah guideline, adopted by the Utah Department of Health, was voluntary and recommended increasing clinical vigilance at daily doses higher than 120-200 mg MEDD. 30 The 2007 Washington State guideline, adopted by the Washington State Agency Medical Directors’ Group (representing all publicly funded health insurance plans in Washington State), recommended avoiding doses >120 mg MEDD for patients who did not have clinically meaningful improvement in pain and function, without first obtaining a pain specialist consultation. 16 This voluntary guideline was implemented as an educational pilot consisting of presentations to provider groups and free web-based continuing medical education trainings. The 2007 guideline was followed by legislation (effective June 10, 2010) 31 mandating that new administrative opioid-prescribing rules be developed for professions that prescribe opioids; those rules took effect in July 2011 and January 2012. 42
Three states implemented high-dose guidelines in November 2014 (Arizona, 33 California, 34 and South Carolina 35 ). We classified these states as comparator states because their guideline adoption dates occurred too late to markedly affect overdose rates during the study period.
Opioid Overdose Hospitalizations
We classified opioid overdose hospitalizations by using the following International Classification of Diseases, Ninth Revision, Clinical Modification codes 43 : (1) prescription opioid overdose (965.00, 965.02, or 965.09), (2) heroin overdose (965.01), and (3) all opioids (prescription opioid overdose and heroin overdose combined). We used the principal diagnosis code rather than all available diagnosis codes (1) to ensure a consistent case definition, because differences in the number of available diagnosis fields—over time and across states—can affect the degree of case ascertainment, and (2) to avoid incidental inclusion of opioid-related events that occurred during the hospital stay, rather than being its principal cause. 44,45 We calculated rates by using US Census Bureau estimates of resident population by state and year. 46
Analytic Approach
We used negative binomial panel regression to model trends in annual opioid overdose hospitalizations, adjusting for resident population denominators and controlling for state-level baseline rates and for trends before the guideline adoption year. 47 -49 We bootstrapped bias-corrected and accelerated 95% confidence intervals (CIs), which correct for bias and skewness in the distribution of bootstrap estimates, 50 by using 1000 replications (random sampling with replacement), while accounting for state-level panel structure. We conducted analyses by using Stata/SE 15.0 for Windows. 51
For each of the 3 guideline states, we specified separate models for overdose hospitalizations resulting from (1) prescription opioids, (2) heroin, and (3) all opioids. Each model included 1 guideline state panel and 5 comparator state panels; trends for all 6 states in each model were interrupted at the relevant guideline adoption year (ie, Washington State preguideline period [2001-2006] and postguideline period [2007-2014], Colorado preguideline period [2001-2008] and postguideline period [2009-2014], Utah preguideline period [2001-2011] and postguideline period [2012-2014]). Thus, trends for the 5 comparator states were interrupted at 3 different years in separate models, enabling the multiple-baseline design. Each model included variables representing guideline state vs comparator state (binary), calendar year (continuous), pre-post guideline adoption year (binary), and saturated interaction terms. The 3-way interaction term (guideline state × year × pre-post guideline period) represented the postguideline trend for the guideline state relative to the 5 comparator states (ie, divergence in opioid overdose trend associated with dosing guideline implementation). Because of observed variation among comparator states, we conducted sensitivity analyses to assess each state’s contribution. For each regression model, we omitted 1 of 5 comparator states in turn (ie, using 5 sets of 4 comparators each). We also conducted post hoc sensitivity analyses for Washington State—specifying the guideline year as 2010 or 2012 instead of 2007—in alignment with later policy events in that state (Table 1).
Results
The postguideline fitted linear trend in rates of prescription opioid overdose hospitalizations for Washington State decreased compared with the 5 comparator states combined (Figure 1). We observed similar guideline vs comparator patterns during the postguideline periods for Utah (Figure 2) and Colorado (Figure 3). As the guideline years progressed (ie, across the baselines of 2007, 2009, and 2012), the trajectories for postguideline rates of prescription opioid overdose hospitalizations began to decrease for the comparator states collectively, yet trajectories for each guideline state decreased even more than for comparator states. These figures show linear regression lines fit to rate data and can be considered approximate representations of the negative binomial regression models; however, they do not incorporate control for state-level rates and preguideline trends, as the regression models do.
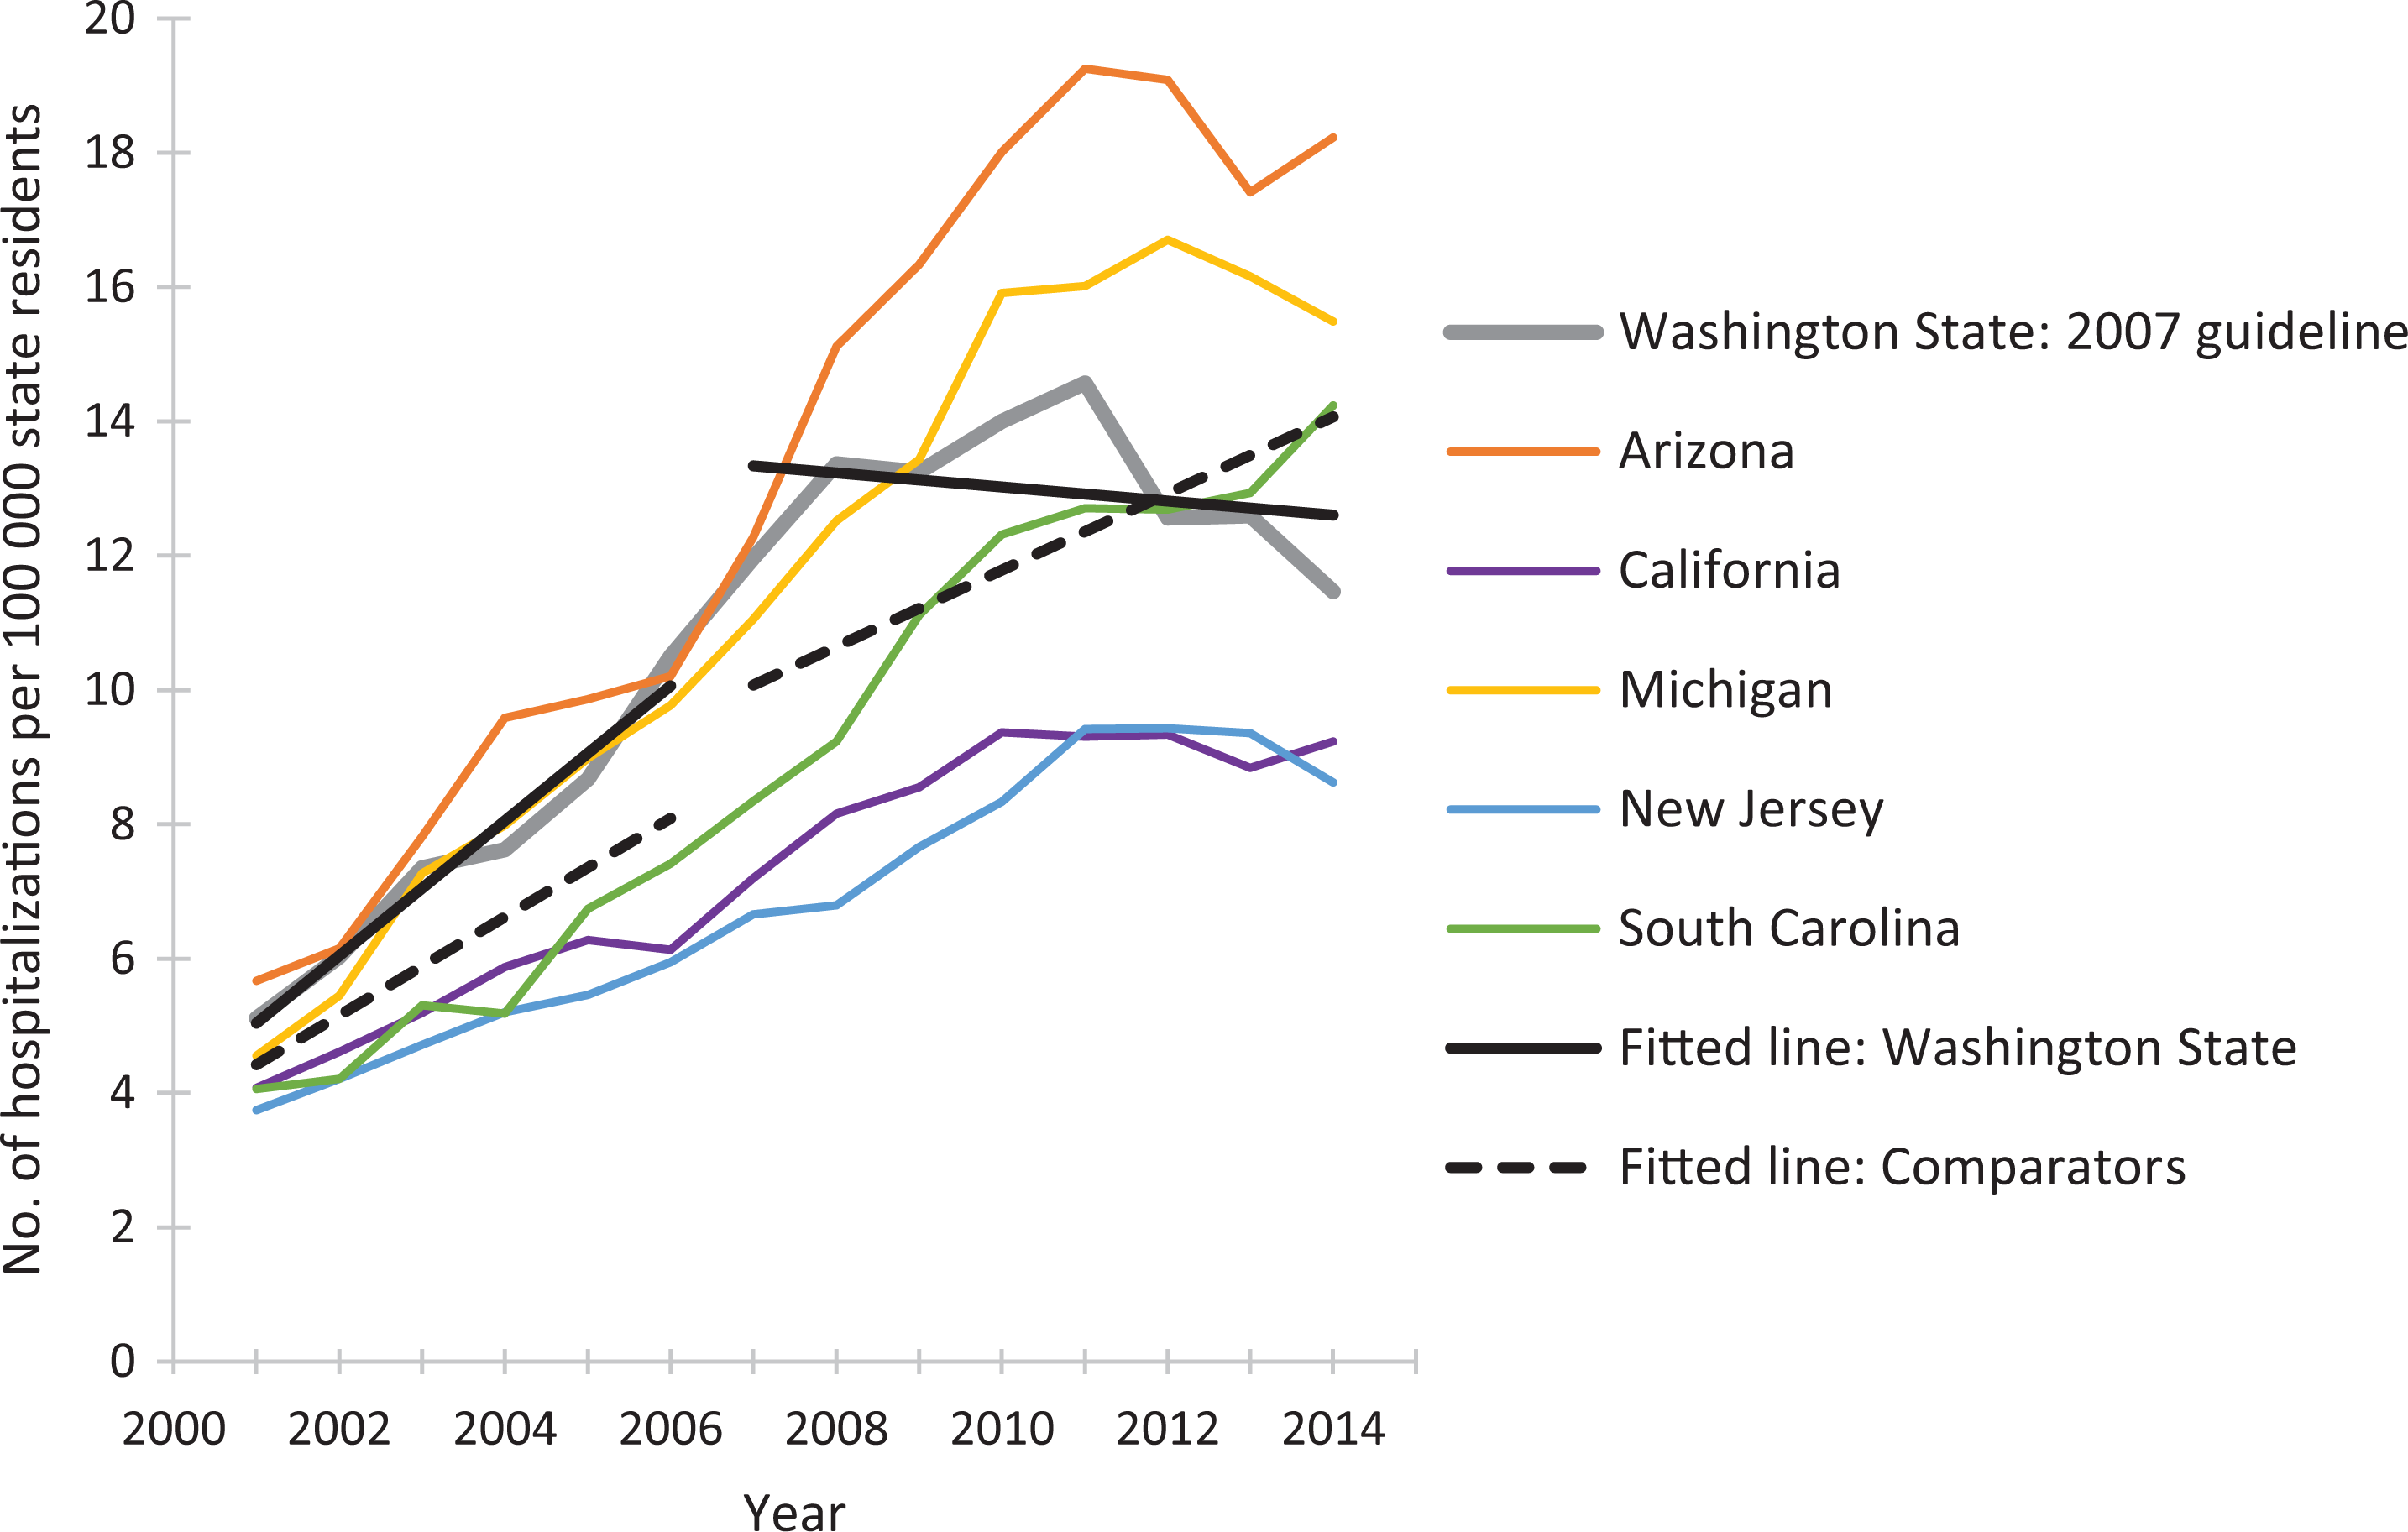
Rates of prescription opioid overdose hospitalizations for Washington State and for 5 comparator states, 2001-2014. Linear-fitted trend lines were interrupted as of 2007, the year at which a guideline for opioid dosing was implemented in Washington State. The linear-fitted trend segments running from 2007 through 2014 represent postguideline trend divergence. Data source: Healthcare Cost and Utilization Project, HCUPnet. 41
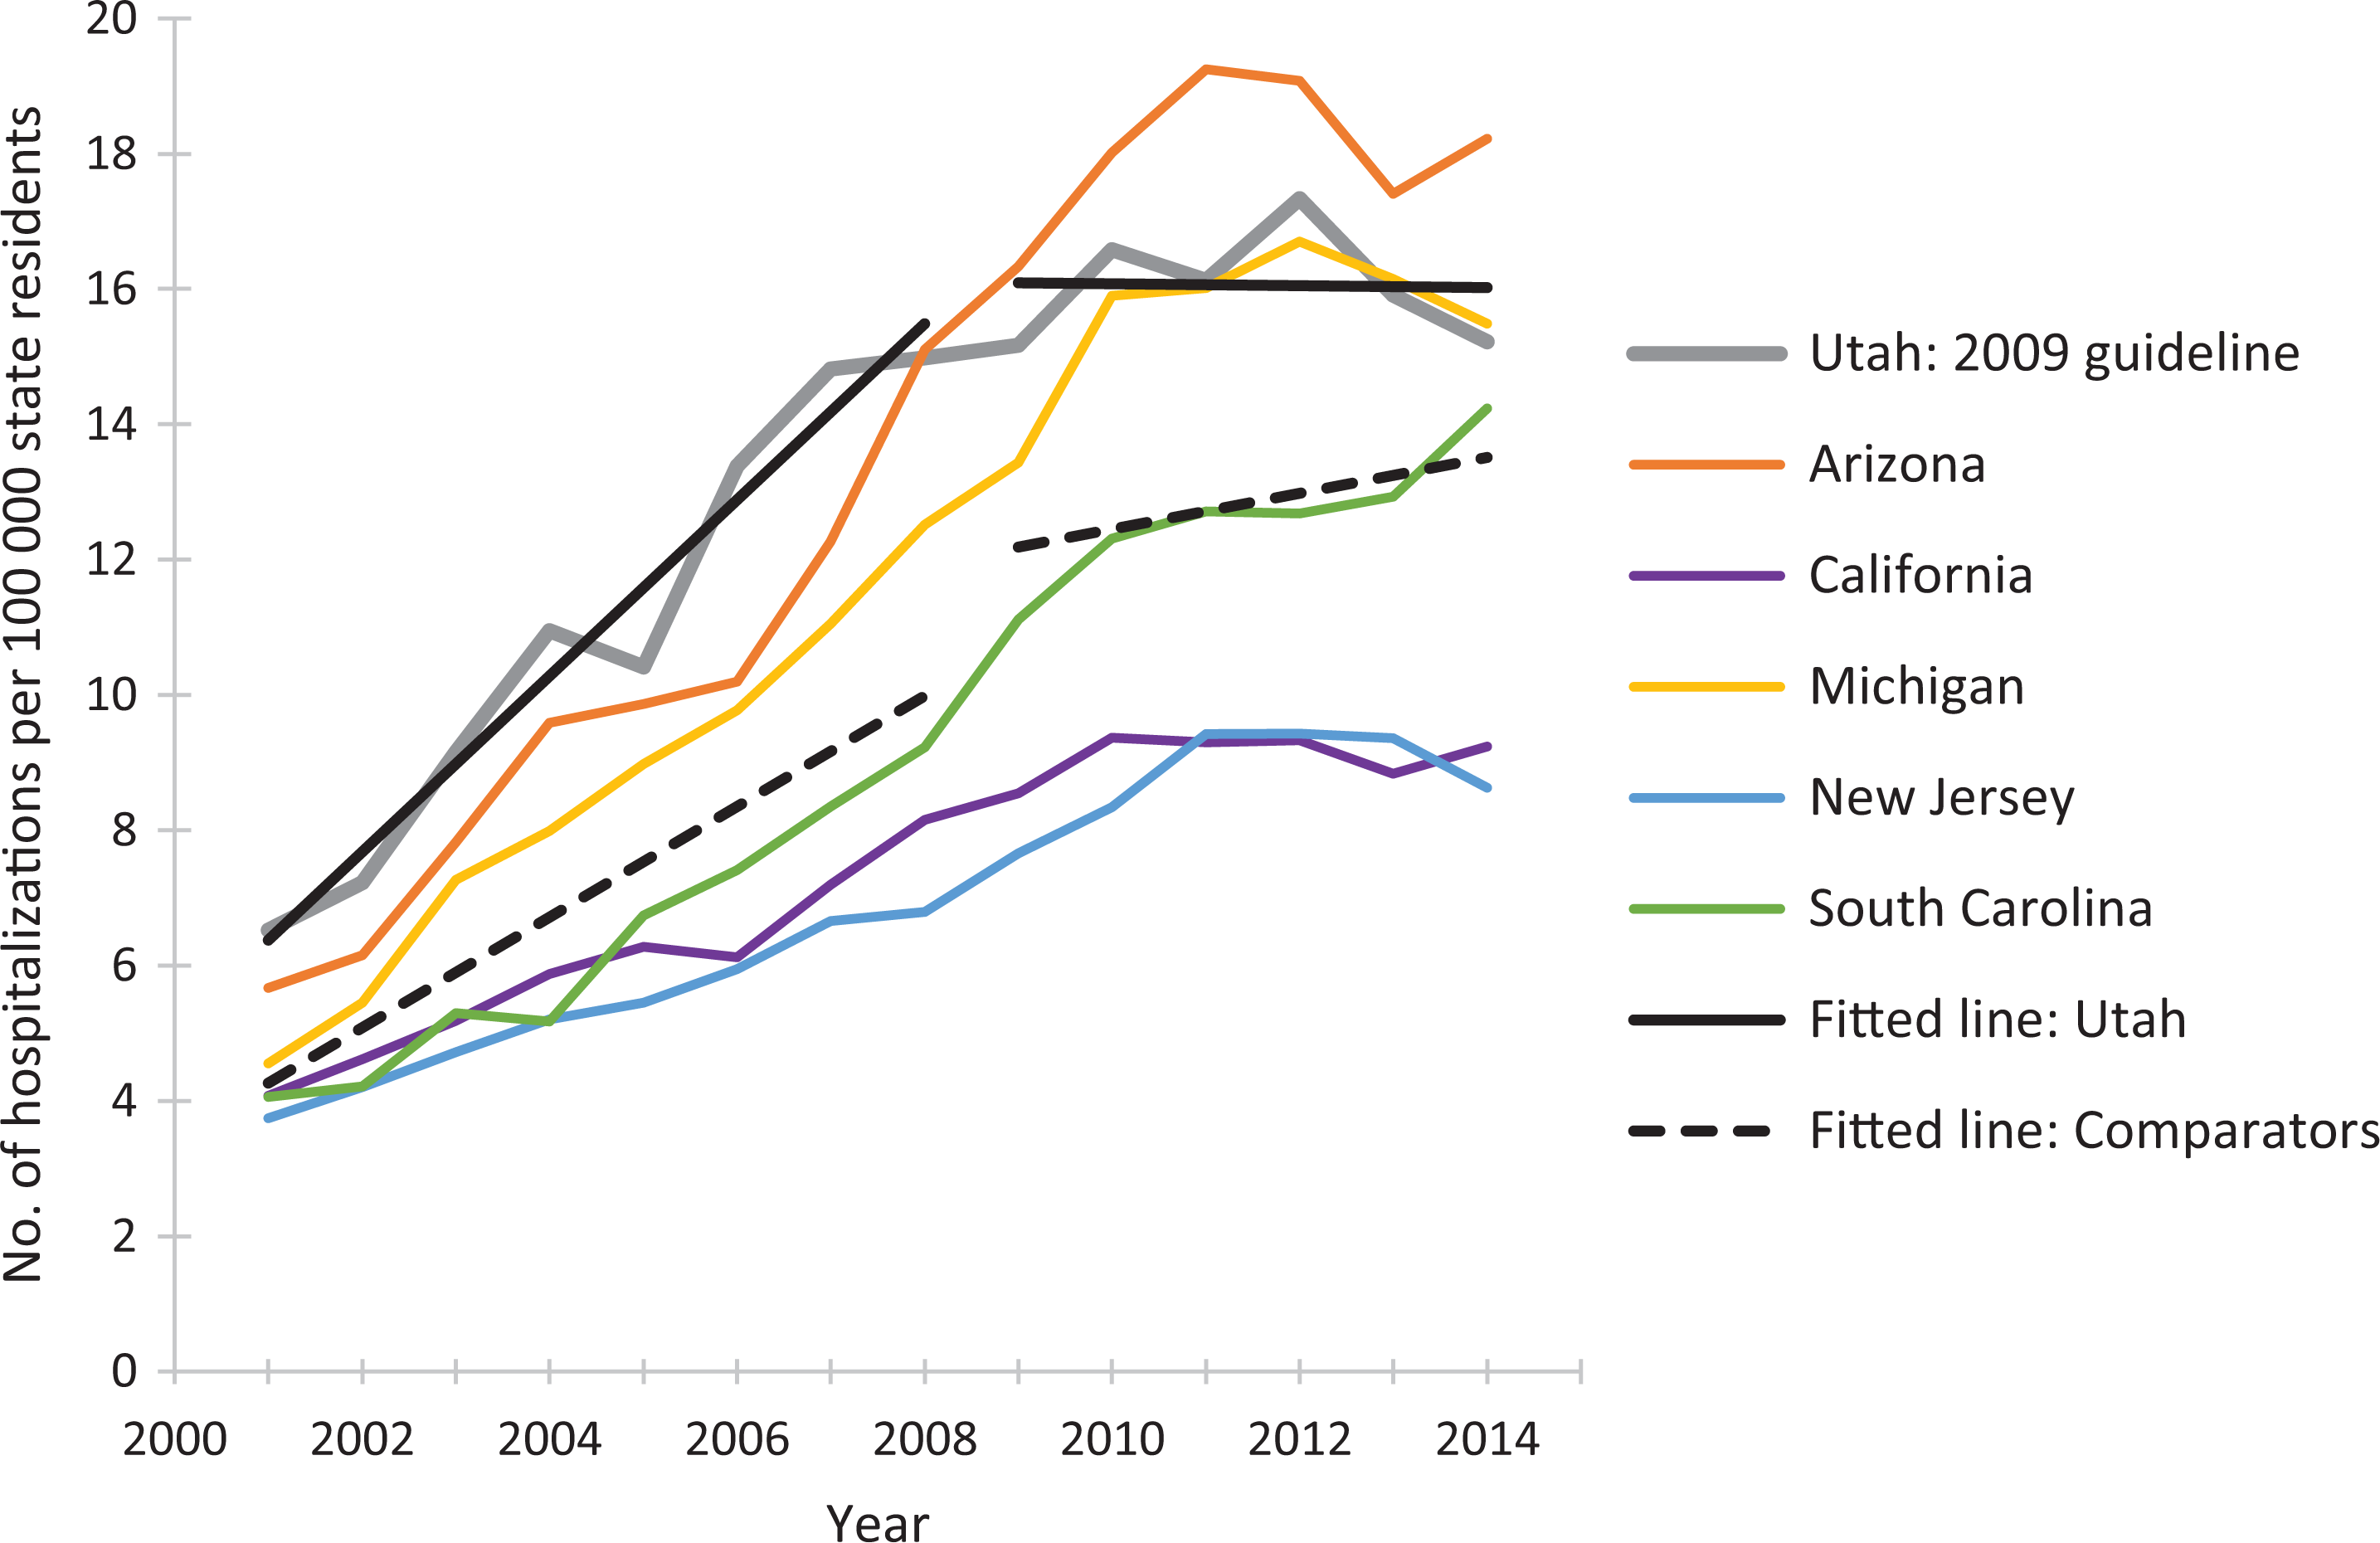
Rates of prescription opioid overdose hospitalizations for Utah and for 5 comparator states, 2001-2014. Linear-fitted trend lines were interrupted as of 2009, the year at which a guideline for opioid dosing was implemented in Utah. The linear-fitted trend segments running from 2009 through 2014 represent postguideline trend divergence. Data source: Healthcare Cost and Utilization Project. 41
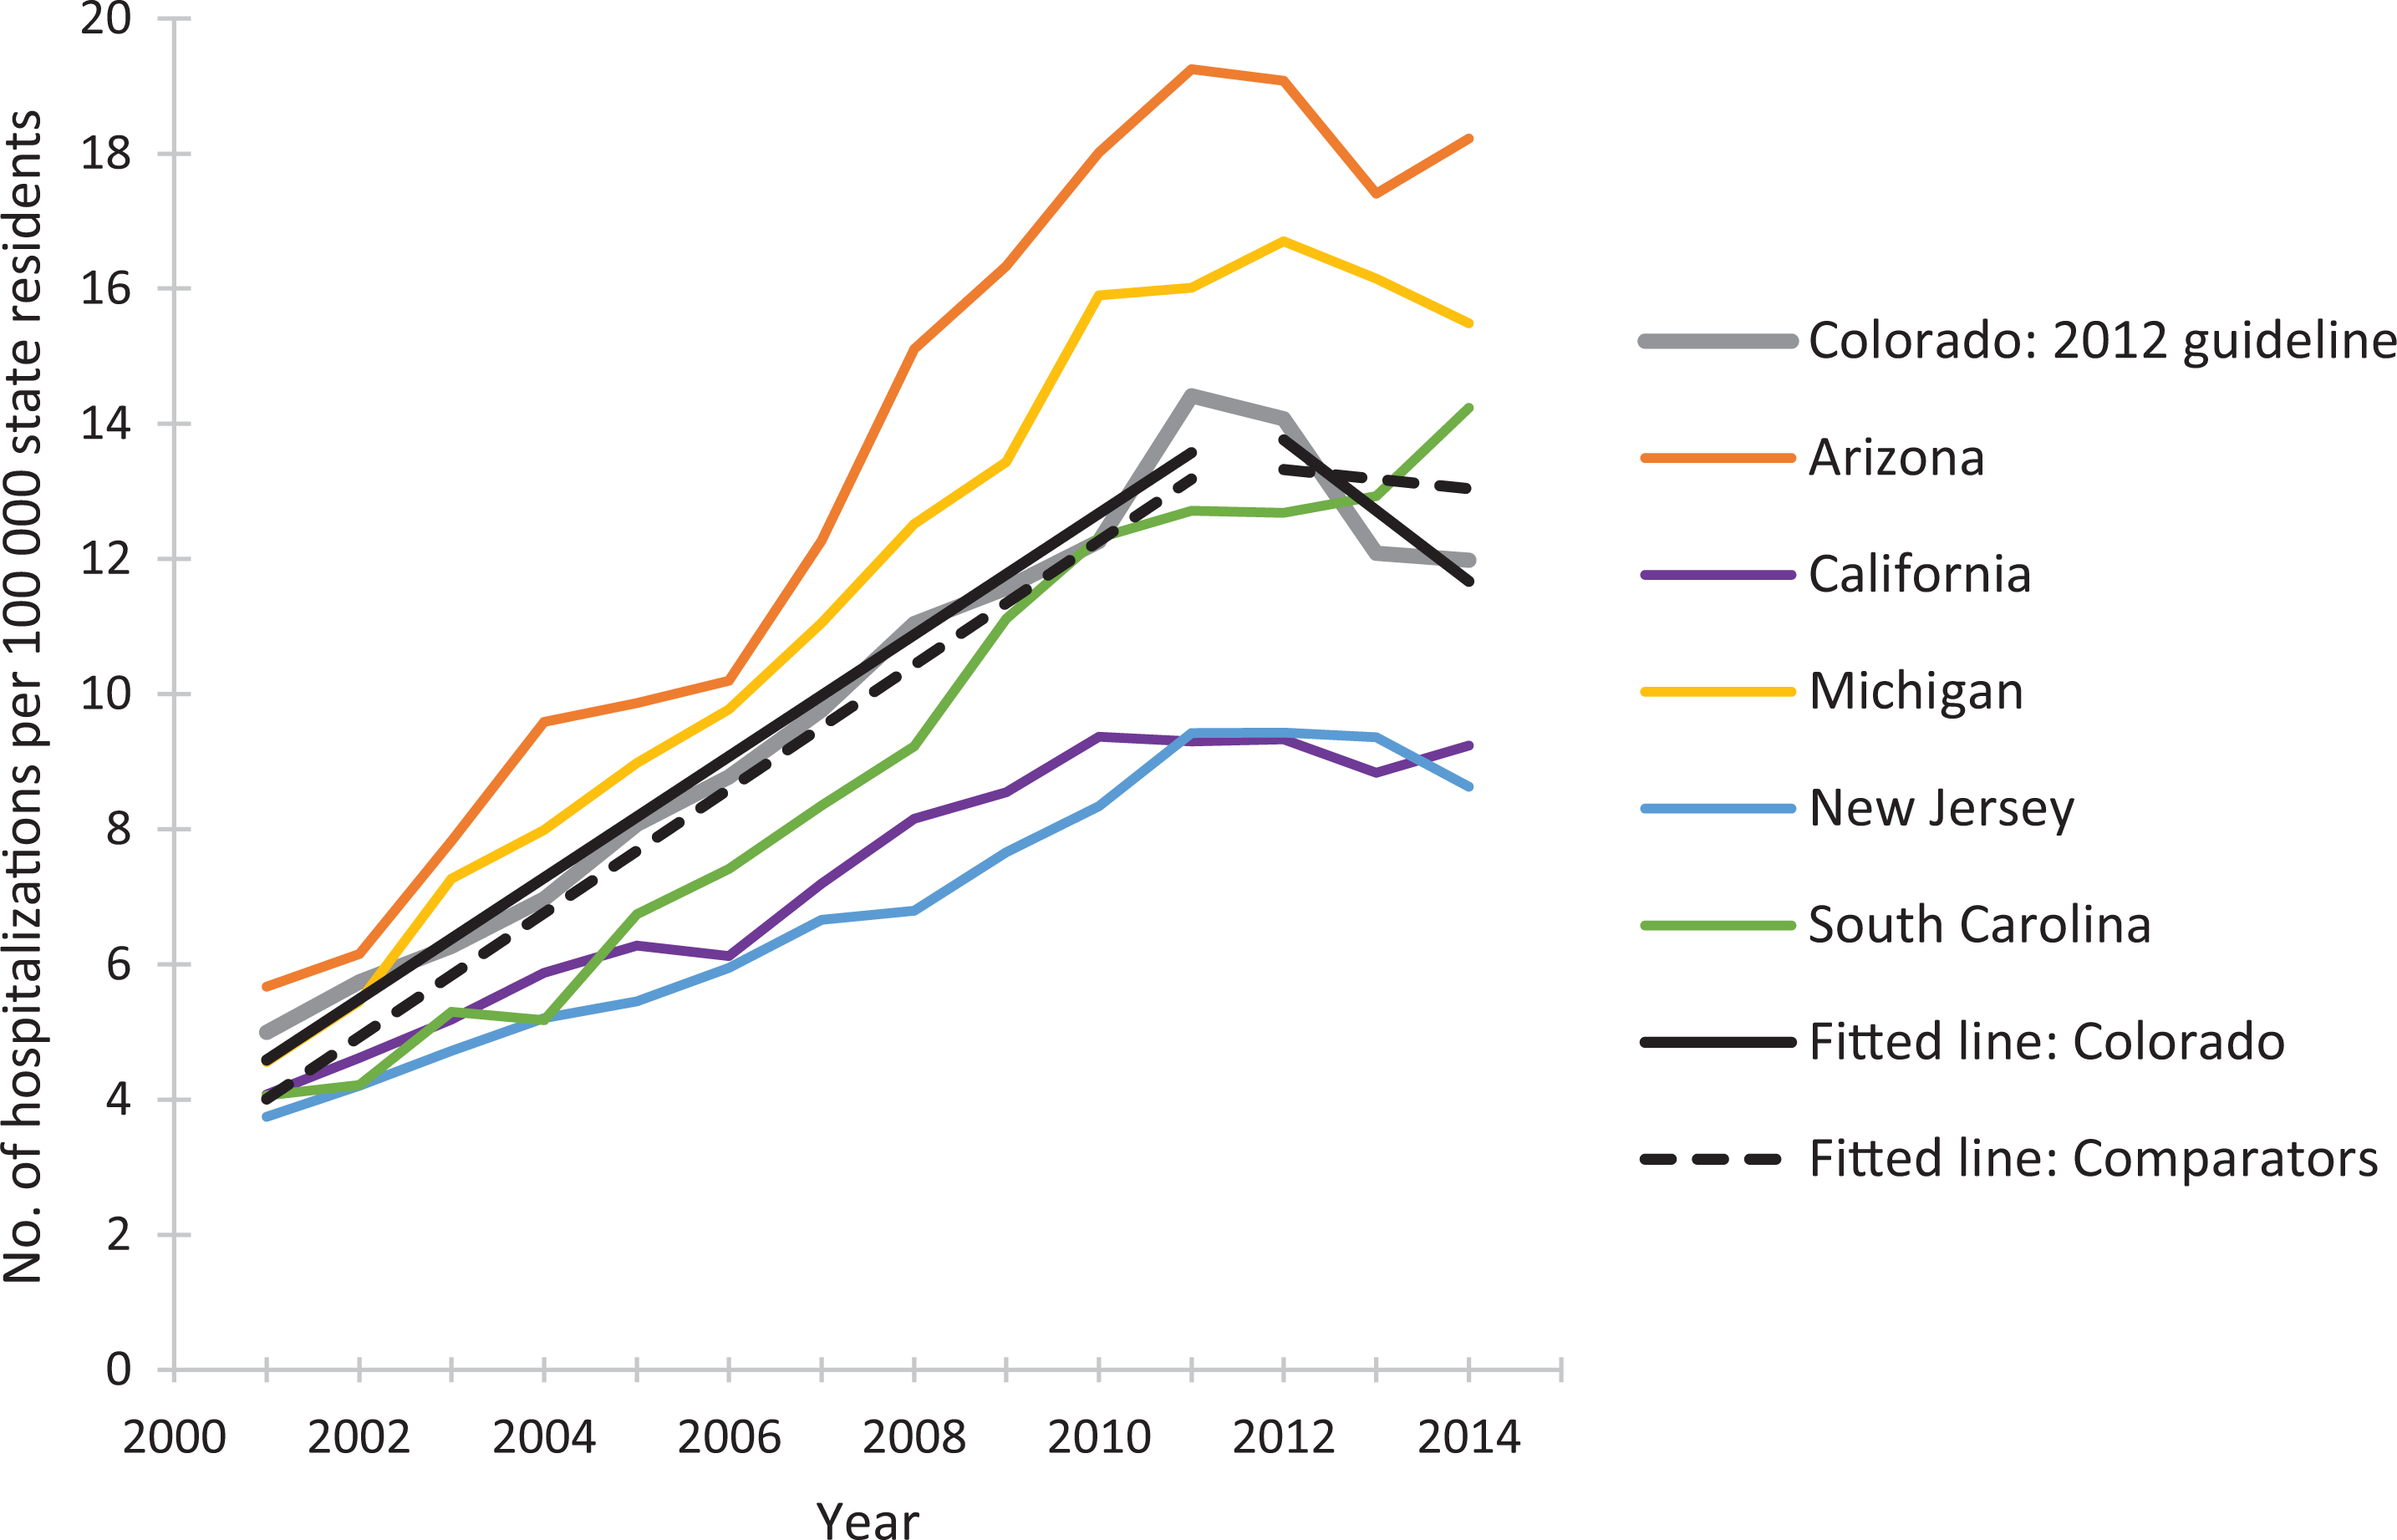
Rates of prescription opioid overdose hospitalization for Colorado and 5 comparator states, 2001-2014. Linear-fitted trend lines were interrupted as of 2012, the year at which a guideline for opioid dosing was implemented in Colorado. The linear-fitted trend segments running from 2012 through 2014 represent postguideline trend divergence. Data source: Healthcare Cost and Utilization Project. 41
The results of the negative binomial regression models confirmed the impressions made by the figures, and all reported results were significant (Table 2). Sensitivity analyses, which omitted each of the 5 comparator states in turn, had no substantial effect on findings.
Mean annual trends in rates of opioid overdose hospitalizations for 3 states with opioid-prescribing guidelines and 5 states without opioid-prescribing guidelines, beginning in the guideline adoption year, United States, 2001-2014a
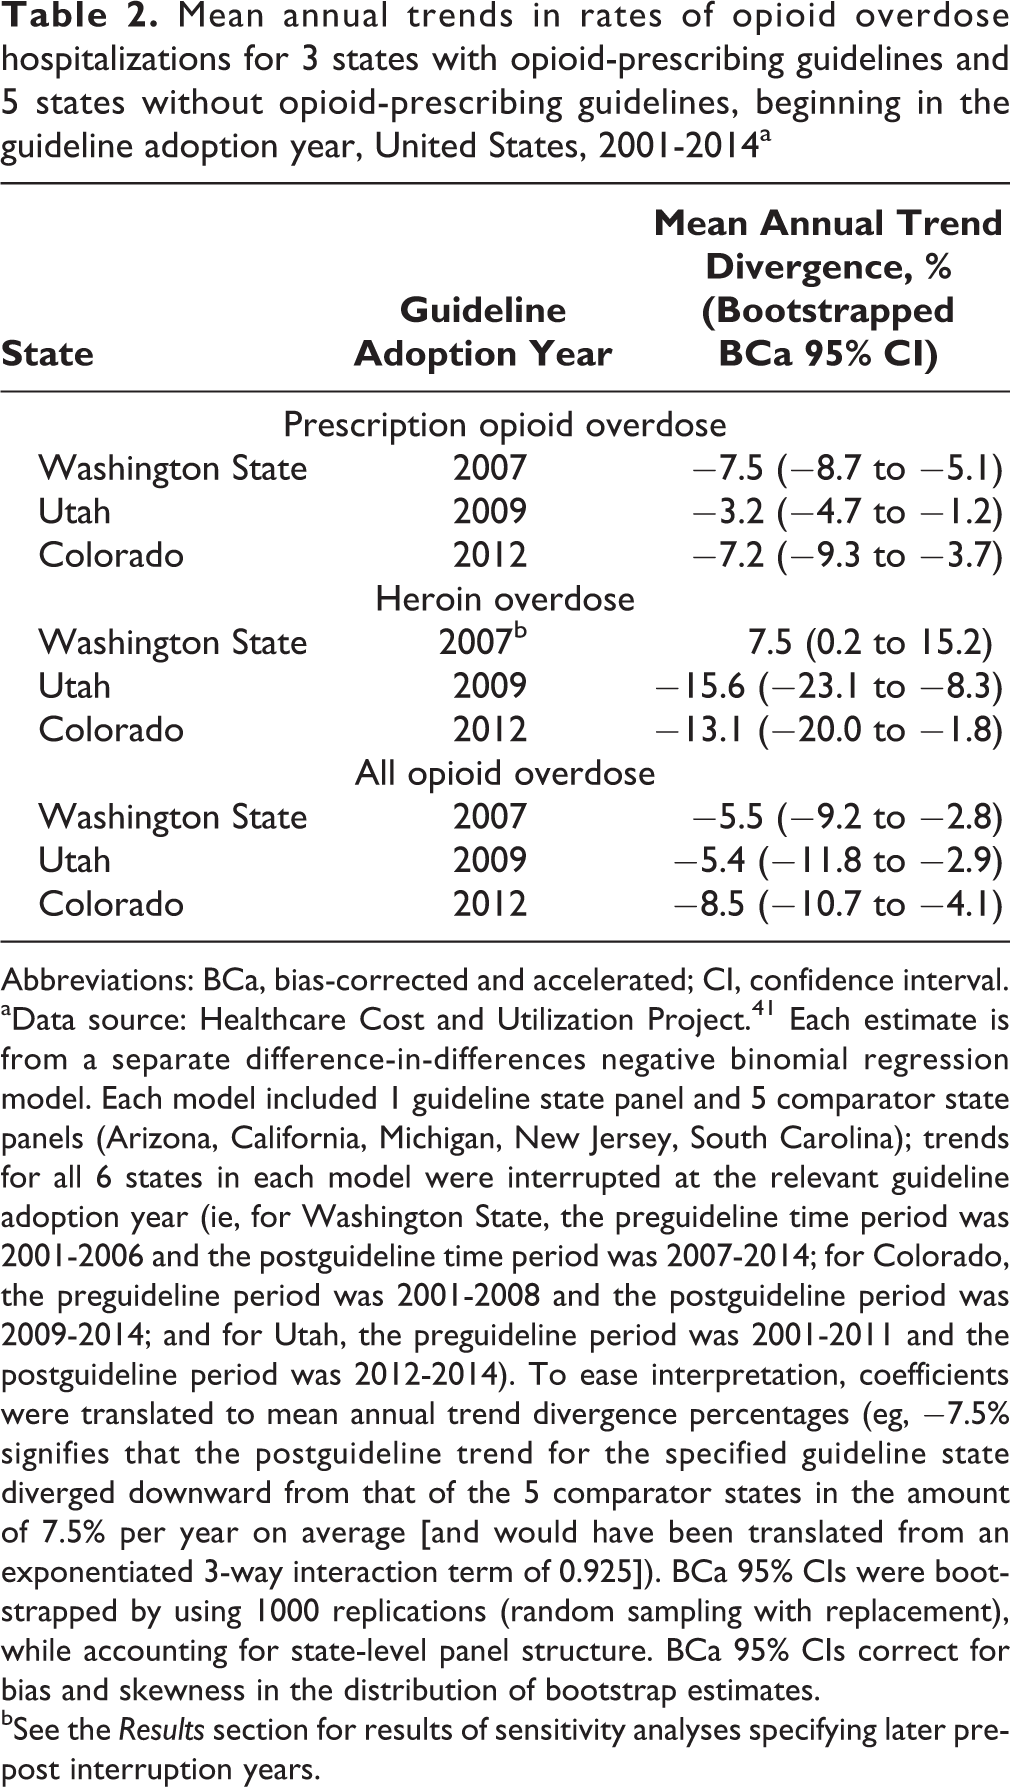
Abbreviations: BCa, bias-corrected and accelerated; CI, confidence interval.
aData source: Healthcare Cost and Utilization Project. 41 Each estimate is from a separate difference-in-differences negative binomial regression model. Each model included 1 guideline state panel and 5 comparator state panels (Arizona, California, Michigan, New Jersey, South Carolina); trends for all 6 states in each model were interrupted at the relevant guideline adoption year (ie, for Washington State, the preguideline time period was 2001-2006 and the postguideline time period was 2007-2014; for Colorado, the preguideline period was 2001-2008 and the postguideline period was 2009-2014; and for Utah, the preguideline period was 2001-2011 and the postguideline period was 2012-2014). To ease interpretation, coefficients were translated to mean annual trend divergence percentages (eg, −7.5% signifies that the postguideline trend for the specified guideline state diverged downward from that of the 5 comparator states in the amount of 7.5% per year on average [and would have been translated from an exponentiated 3-way interaction term of 0.925]). BCa 95% CIs were bootstrapped by using 1000 replications (random sampling with replacement), while accounting for state-level panel structure. BCa 95% CIs correct for bias and skewness in the distribution of bootstrap estimates.
bSee the Results section for results of sensitivity analyses specifying later pre-post interruption years.
For each guideline state, trends in postguideline rates of overdose hospitalizations for prescription opioids and for all opioids decreased significantly compared with trends in comparator states, adjusting for state-based differences in preguideline rates and trends. The mean annual relative percentage decrease ranged from 3.2% to 7.5% for trends in rates of prescription opioid overdose hospitalizations and from 5.4% to 8.5% for trends in rates of all opioid overdose hospitalizations (Table 2).
In parallel models for heroin overdose hospitalizations in Colorado and Utah, trends in postguideline rates of heroin overdose hospitalizations decreased significantly in guideline states compared with trends in the 3 comparator states, even more steeply than for prescription opioid overdoses (Table 2). In contrast, trends in postguideline rates of heroin overdose hospitalizations in Washington State increased significantly relative to trends in the 5 comparator states. To explore this finding, we conducted sensitivity analyses, specifying the guideline year as 2010 or 2012. During 2010 through 2014, the mean annual trend divergence for heroin overdose was not significantly different for Washington State compared with the comparator states (–0.02%; 95% CI, –11.2% to 9.0%). During 2012 through 2014—after the new professional rules for opioid prescribers had been implemented—trends in rates of heroin overdose hospitalizations in Washington State decreased significantly compared with trends in the comparator states (–13.1%; 95% CI, –22.4% to –3.1%), to a similar degree as for Colorado and Utah.
Discussion
We found that trends in rates of opioid overdose hospitalizations for prescription opioids and for all opioids decreased significantly in each of the guideline states compared with the 5 comparator states, after adoption of opioid-prescribing guidelines. These findings suggest a net beneficial effect on trends in rates of opioid overdose hospitalizations in all 3 guideline states.
The postguideline effect in Colorado was similar to that in other guideline states, even though Colorado’s guideline was promulgated by the Division of Workers’ Compensation and, thus, not applicable to patients covered by other payers. It may be that providers changed their opioid-prescribing practices for all patients as they changed them for injured workers. 52
In Colorado and Utah, guideline adoption was associated with subsequent relative decreasing trends in rates of heroin overdose hospitalizations. In Washington State, although postguideline trends in rates of heroin overdose hospitalizations increased significantly compared with trends in comparator states, this pattern shifted when we conducted sensitivity analyses specifying 2010 or 2012 in place of 2007 as the guideline year. By 2012—when the Washington State guideline had become compulsory—trends in rates of heroin overdose hospitalizations in Washington State were decreasing significantly compared with trends in comparator states. This pattern suggests the importance of preguideline contributors to rising trends in rates of heroin overdose hospitalizations, including high-risk prescribing itself, and is not well-explained simply by restrictions in prescription opioid supply related to prescribing guidelines—if it were the latter, the effect of any such supply restrictions should have increased as prescribing guidelines became more effective. These findings comport with research showing that rates of heroin overdose hospitalizations began to increase in 2008, before rates of prescription opioid overdose hospitalizations began to decline. 26,27
Opioid-prescribing guidelines can serve as (1) primary prevention by reducing unnecessary initial opioid exposure, (2) secondary prevention by minimizing the risks associated with high-dose opioid prescribing and certain concurrent medications, and (3) tertiary prevention by providing clear guidance for dosage tapering and treatment of opioid use disorder. If effective, prescribing guidelines may serve as an important primary prevention tool. Opioid-prescribing interventions may be less effective if targeted after a high-dose or chronic prescribing threshold has already been reached. 53
States have experimented with various policy approaches to stem the tide of opioid-related morbidity and mortality. In addition to prescribing guidelines and policies, these efforts include pain clinic laws, naloxone distribution (intended to increase access to the medication used for reversal of opioid overdose), and prescription drug monitoring programs. 24,54 Ongoing systematic evaluation of interventions aimed at reducing opioid-related morbidity and mortality is crucial to inform public health efforts. However, identifying which policy components are most effective and identifying suitable comparators can pose major challenges. 54 -56 A centralized catalog of all opioid-related state and national guidelines and policies, including features, intervention details, and implementation timing, may facilitate future evaluation efforts. Early efforts at such catalogs are promising 57 -59 but have limited scope or lack sufficient detail about intervention features and/or implementation timing to be adequate for the complex models required to isolate the individual effects of each policy intervention. Publicly available quarterly hospital discharge data would facilitate assessing lags in implementation and dissemination, testing effects of serial updates and improvements, and pinpointing changes in outcome trajectories.
Strengths and Limitations
This study had several strengths. First, to our knowledge, this study is the first to assess state-level opioid-dosing guidelines using comparator states to control for secular trends related to national guidelines, changes in health service delivery, and other factors that might affect opioid overdose trends across states. Second, guideline implementation dates differed across states, providing 3 baseline years for assessing guideline impact. This multiple-baseline approach allowed us to demonstrate repeated patterns of association between the policy intervention and outcome, at various points in time and in various jurisdictions, which adds to the weight of evidence that the policy intervention had an effect. 39 Third, the inclusion of 8 states, representing various geographic regions and more than a quarter of the US population, enhanced the generalizability of our findings. Finally, our findings were robust to the specification of differing sets of comparator states.
This study also had several limitations. First, using hospital discharge data, we captured a large share of opioid-related morbidity but not the full scope. For example, >40% of injured workers with an opioid overdose covered by Washington State workers’ compensation were treated on an inpatient basis 22 ; nationally, >50% of persons presenting to an emergency department with a prescription opioid overdose were admitted to the hospital. 60 In emergency department data, unlike hospital discharge data, first-listed diagnosis is not equivalent to principal diagnosis. 61 Hence, to enable a consistent case definition based on principal diagnosis, and comporting with surveillance recommendations, we did not include emergency department visits in this study. Basing our opioid overdose definitions on principal diagnosis presumably undercounted cases but should minimize bias in cross-state comparisons over time.
Second, trends in rates of opioid overdose hospitalizations are known to vary substantially by region 62 ; we partially addressed this issue by including states from all 4 US Census regions. Opioid overdose rates for the comparator states were similar to rates for the guideline states in 2001, and they all trended steeply upward in roughly comparable fashion through at least 2007. The study design and statistical models adjusted for differences in state-level opioid overdose hospitalization rates and trends before each guideline year.
Third, although we found a strong association between guideline implementation and opioid-related morbidity trends, the observational study design could not rule out other causal factors, including national, state, and local opioid-related interventions. The difference-in-differences design mitigated the effects of national policies and secular trends, but other effective state-level opioid policies may interfere with identifying the effect of opioid-dosing guidelines. For example, the Utah Department of Health conducted a media campaign and launched a statewide provider education intervention during roughly the same time frame that the 2009 guideline was adopted. Guideline states may have internal characteristics or policy environments leading both to guideline adoption and to reduced opioid-related morbidity (ie, policy endogeneity 63 ). By including 3 comparator states that adopted opioid-prescribing guidelines in November 2014 (Arizona, California, and South Carolina), we strengthened comparison group validity and at least partially mitigated potential policy endogeneity. Their classification as comparator states was also a conservative approach that would serve to shrink postguideline trend differences between comparator states and guideline states and reduce the ability to detect any actual guideline effect, because trends for these 3 comparison states would be subject to potential guideline effects at the end of 2014.
Fourth, opioid-prescribing guidelines may have a varying effect based on being voluntary or enforceable or based on their source. For example, guidelines adopted by a medical board may be disseminated primarily to physicians, and guidelines adopted by a workers’ compensation agency may not pertain to all opioid prescribers. Although we included policies imposed by state agencies, other payers may set their own high-dose thresholds or prior-authorization requirements, and we were not able to identify or control for such policies. Finally, other features of opioid-prescribing guidelines, such as recommendations against prescribing opioids concurrently with other medications that increase overdose risk (eg, sedatives, hypnotics, benzodiazepines, muscle relaxants), 10,12 may be as important as the high-dose threshold.
Conclusions
We found that the adoption of opioid-prescribing guidelines by 3 states between 2007 and 2012 was associated with decreasing trends in rates of prescription opioid—and all opioid—overdose hospitalizations, relative to 5 concurrent comparator states. These findings provide preliminary evidence that opioid-dosing guidelines may be an effective state- and national-level strategy for combating this public health crisis. Further research is needed to identify the individual effects of the many opioid-related interventions that occurred during the study period.
Footnotes
Declaration of Conflicting Interests
The authors declared no potential conflicts of interest with respect to the research, authorship, and/or publication of this article.
Funding
The authors received no financial support for the research, authorship, and/or publication of this article.