
Abstract
Objective:
The Centers for Disease Control and Prevention’s Prevention Research Centers (PRCs) collaborate on public health activities with community agencies and organizations. We evaluated these collaborations by studying the relationships between co-authors from the PRCs and community agencies that published at least 1 article together in the first year of the program.
Methods:
We identified all the authors of articles published by PRCs and collaborating members in peer-reviewed journals between September 2014 and September 2015 and constructed a network showing the links between and among all the authors. We characterized the network with 4 measures of social structure (network components, network density, average clustering coefficient, average distance) and 3 measures of individual author performances (degree-, betweenness-, and closeness-centrality).
Results:
The 413 articles had 1804 individual authors and 7995 co-authorship relationships (links) in 212 peer-reviewed journals. These authors and co-authors formed 44 separate, nonoverlapping groups (components). The largest “giant” component containing most of the links involved 66.3% (n = 1196) of the authors and 73.7% (n = 5889) of the links. We identified 136 “information brokers” (authors with high closeness centrality: those who have the shortest links to the most authors). Two authors with high betweenness centrality (who had the highest number of co-authors; 104 and 107) had the greatest ability to mediate co-authorships. Network density was low; only 0.5% of all potential co-authorships were realized (7995 actual co-authorship/1 628 110 potential co-authorships).
Conclusion:
Information brokers and co-authorship mediators should be encouraged to communicate more with each other to increase the number of collaborations between network members and, hence, the number of co-authorships.
Keywords
In 2014, the Centers for Disease Control and Prevention (CDC) Prevention Research Centers (PRCs) program funded 26 academic research centers located at either a school of public health or a medical school with a preventive medicine residency program, for a new 5-year funding cycle (September 30, 2014, through September 29, 2019). 1 –3 These PRCs and their community partners (eg, local employers, nonprofit organizations, health centers) collaborate on health promotion and disease prevention activities. 2,3 Centers are required to participate in an annual evaluation of the network, which includes reporting on the number of peer-reviewed articles completed by PRC authors and their community colleagues. 4
For academic researchers and some authors in the PRC program, publishing articles in the peer-reviewed literature has long been required for salary raises and promotions. 4 –6 Participating in scientific collaborations increases both the number of studies to which an author contributes and the number of opportunities to publish. 7 –10 This increase holds true in fields of study that value co-authored articles, such as public health. 4,7 –10 Not all collaborative efforts result in published articles 11,12 ; nevertheless, article co-authorship is an accepted measure of scientific collaboration and collective impact of organizational performance. 7 –12
Two recent studies determined the value of studying networks of co-authors to evaluate health-related scientific collaborations. 11,12 Such analyses can also identify individuals or organizations that are influential in funding, implementing, and translating health-related scientific activities. 11 –13 We built on this evidence and examined the network of co-authors of articles that were written by PRCs and local cooperating agencies or community groups and that were published during the first year of the 2014-2019 funding cycle (September 30, 2014, through September 29, 2015) to assess the degree of scientific collaboration. The PRC articles published during the first year of the funding cycle were used in this exploratory study to establish a baseline for the evolution of the PRCs’ scientific collaboration across the 2014-2019 funding cycle.
Methods
Articles from PRCs are written by faculty or staff members who receive at least some of their salary from the PRC budget. In year 1, the PRCs reported 486 published articles, which included in-press publications, ahead-of-print e-publications, and print publications. We excluded 19 duplicate articles and 54 articles that were not peer-reviewed, not confirmed as peer-reviewed, or published outside of the year 1 period, leaving 413 articles for data analysis.
The network we studied consists of authors and the links to their co-authors. 14,15 For example, consider an article written by authors A and B and another written by authors B and C. Co-authorship pairs were created for each article: A and B are directly linked co-authors, B and C are directly linked co-authors, and A and C are indirectly linked to each other through B. A communication pathway is the sequence of authors and links that connects any 2 authors. In the example, the communication pathway between authors A and C goes through author B. We analyzed and visualized the PRC co-authorship network by using Gephi, 16 a free, publicly available network analysis computer program. We examined the network’s structure by using standard network metrics and individual author performance metrics as described hereinafter. 11 –15
Network Metrics
Our network consisted of all the authors listed on the 413 identified publications and their links to co-authors. A network component is a subgroup of authors in the network who are not connected to other subgroups of authors. The giant component is the component that has the most linkages to the most authors (Figure).
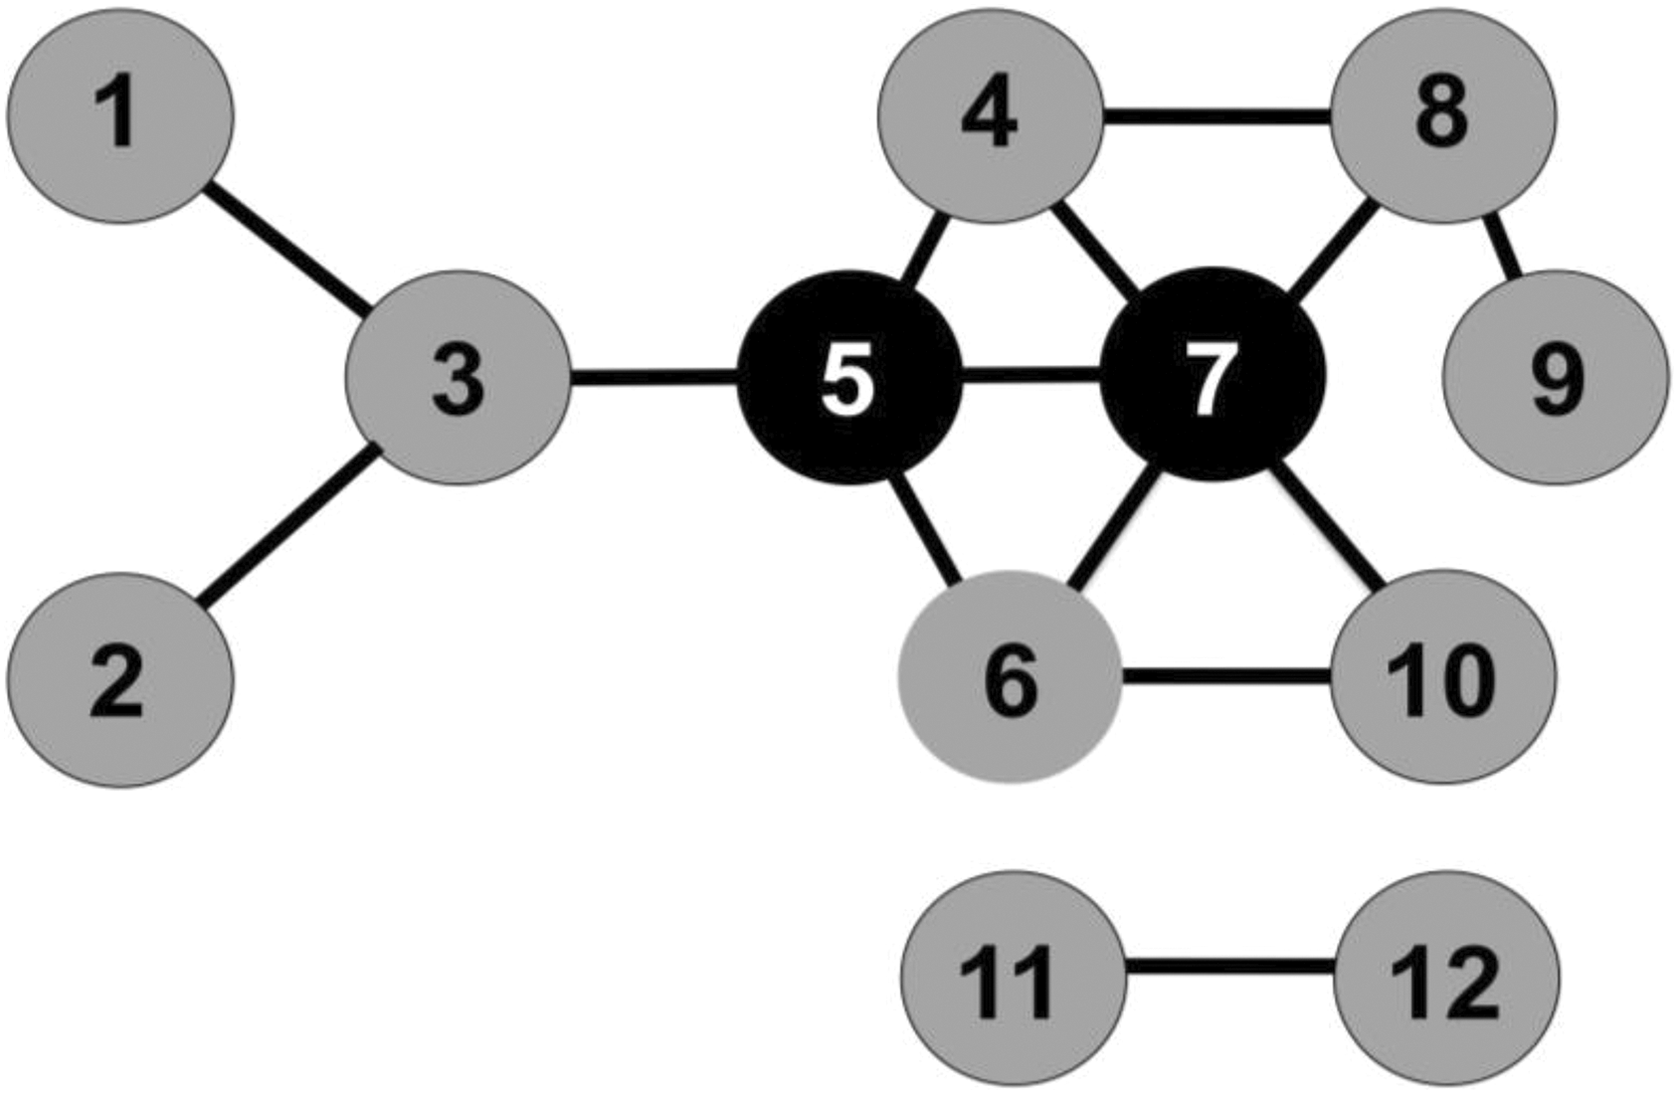
A network of 12 authors, 14 direct links, and 2 components—one with authors 1 through 10, and the other with authors 11 and 12. Author 7 has the most links and, therefore, the highest degree of centrality. Author 5 has high betweenness centrality: the highest number of times a node lies on the shortest path between other nodes. Author 3 has 3 direct links and is indirectly linked to authors 4, 6, 7, 8, 9, and 10. The communication pathway between author 1 and author 9 is mediated by authors 3, 5, 7 (or 4), and 8; author 1 is 5 links or “degrees of separation” away from author 9. The network density is 0.2 (14 actual direct links/66 potential links among all 12 authors).
Network density is a measure of how closely knit a network is. It is the number of actual linkages divided by the total number of possible linkages (Figure). A network of 6 authors has 15 possible co-authors or pair-wise links. If only 5 of those links are actually established in the network, the network density is 0.3 (5 of 15). A dense network has a density closer to 1 and is a tight-knit network of authors who have more communication pathways to other authors. A non-dense network has a density closer to 0 and is a looser network in which authors have fewer communication pathways to other authors. The average clustering coefficient is based on the number of linkages among the co-authors of a given author. The clustering coefficient is zero if the co-authors are not linked to each other and 1 if all co-authors are linked. The average clustering coefficient is the mean of all the authors’ clustering coefficients.
The average distance is the average number of links in the communication pathway between all possible co-authorships, along the shortest path (Figure). A small average distance indicates a cohesive network; a given author can connect to more other authors with fewer intermediary authors. A large average distance indicates a less cohesive network with more intermediary authors between any 2 authors. A network with an average distance of 6 or fewer links is called a small-world network 17 (sometimes referred to as “less than 6 degrees of separation”). That is, a given author can get a message to any other author using, on average, only 6 intermediaries, a standard regarded as offering efficient information transfer. 17
Individual Author Metrics
We assessed individual author performance with 3 measures of their centrality in a network. Centrality measures address the question, “Who is (are) the most central (most connected) and therefore the most important author(s) in a network?” Degree centrality is simply the number of an author’s direct links to co-authors (Figure). Authors with more degree centrality have many such links; they are highly connected and well-positioned network members. In addition, such authors have greater autonomy than authors with less degree centrality because they are linked more closely to other co-authors. Authors with more degree centrality tend to have more influence than do authors with low degree centrality and, hence, are more likely to be focal points in communicating co-authorship opportunities.
Betweenness centrality is the number of times an author lies on the shortest communication pathway between other authors (Figure). Authors with more betweenness centrality serve as a bridge to other authors who are not connected to each other. As such, they have the potential to control information and can act as gatekeepers about co-authorship opportunities in the network. They may also mediate co-authorships by introducing authors to other authors.
Closeness centrality is the average number of direct and indirect linkages in the shortest communication pathway between an author and all other authors in the network. The shorter the communication pathway between a given author and other authors, the closer he or she is to all other authors in the network and, thus, the faster he or she can share information about co-authorship opportunities. This ability means these authors can act as information brokers for other authors in the network.
Results
Collectively, the 26 PRCs and their community partners published 413 articles in 212 peer-reviewed journals (Table 1), including in several top-tier journals (Table 2) such as Science and the New England Journal of Medicine. The 5 peer-reviewed journals publishing the most PRC articles (61 of 413, 14.8%) were the American Journal of Public Health (n = 19, 4.6%), Preventing Chronic Disease (n = 12, 2.9%), Frontiers in Public Health (n = 11, 2.7%), Preventive Medicine (n = 10, 2.4%), and the Journal of Public Health Management and Practice (n = 9, 2.2%). These articles had an average of 7 (range, 1 to 104) authors per article.
Co-authorship network characteristics of 26 Prevention Research Centers and their community partners during year 1 of a 5-year study, September 30, 2014, through September 29, 2015a
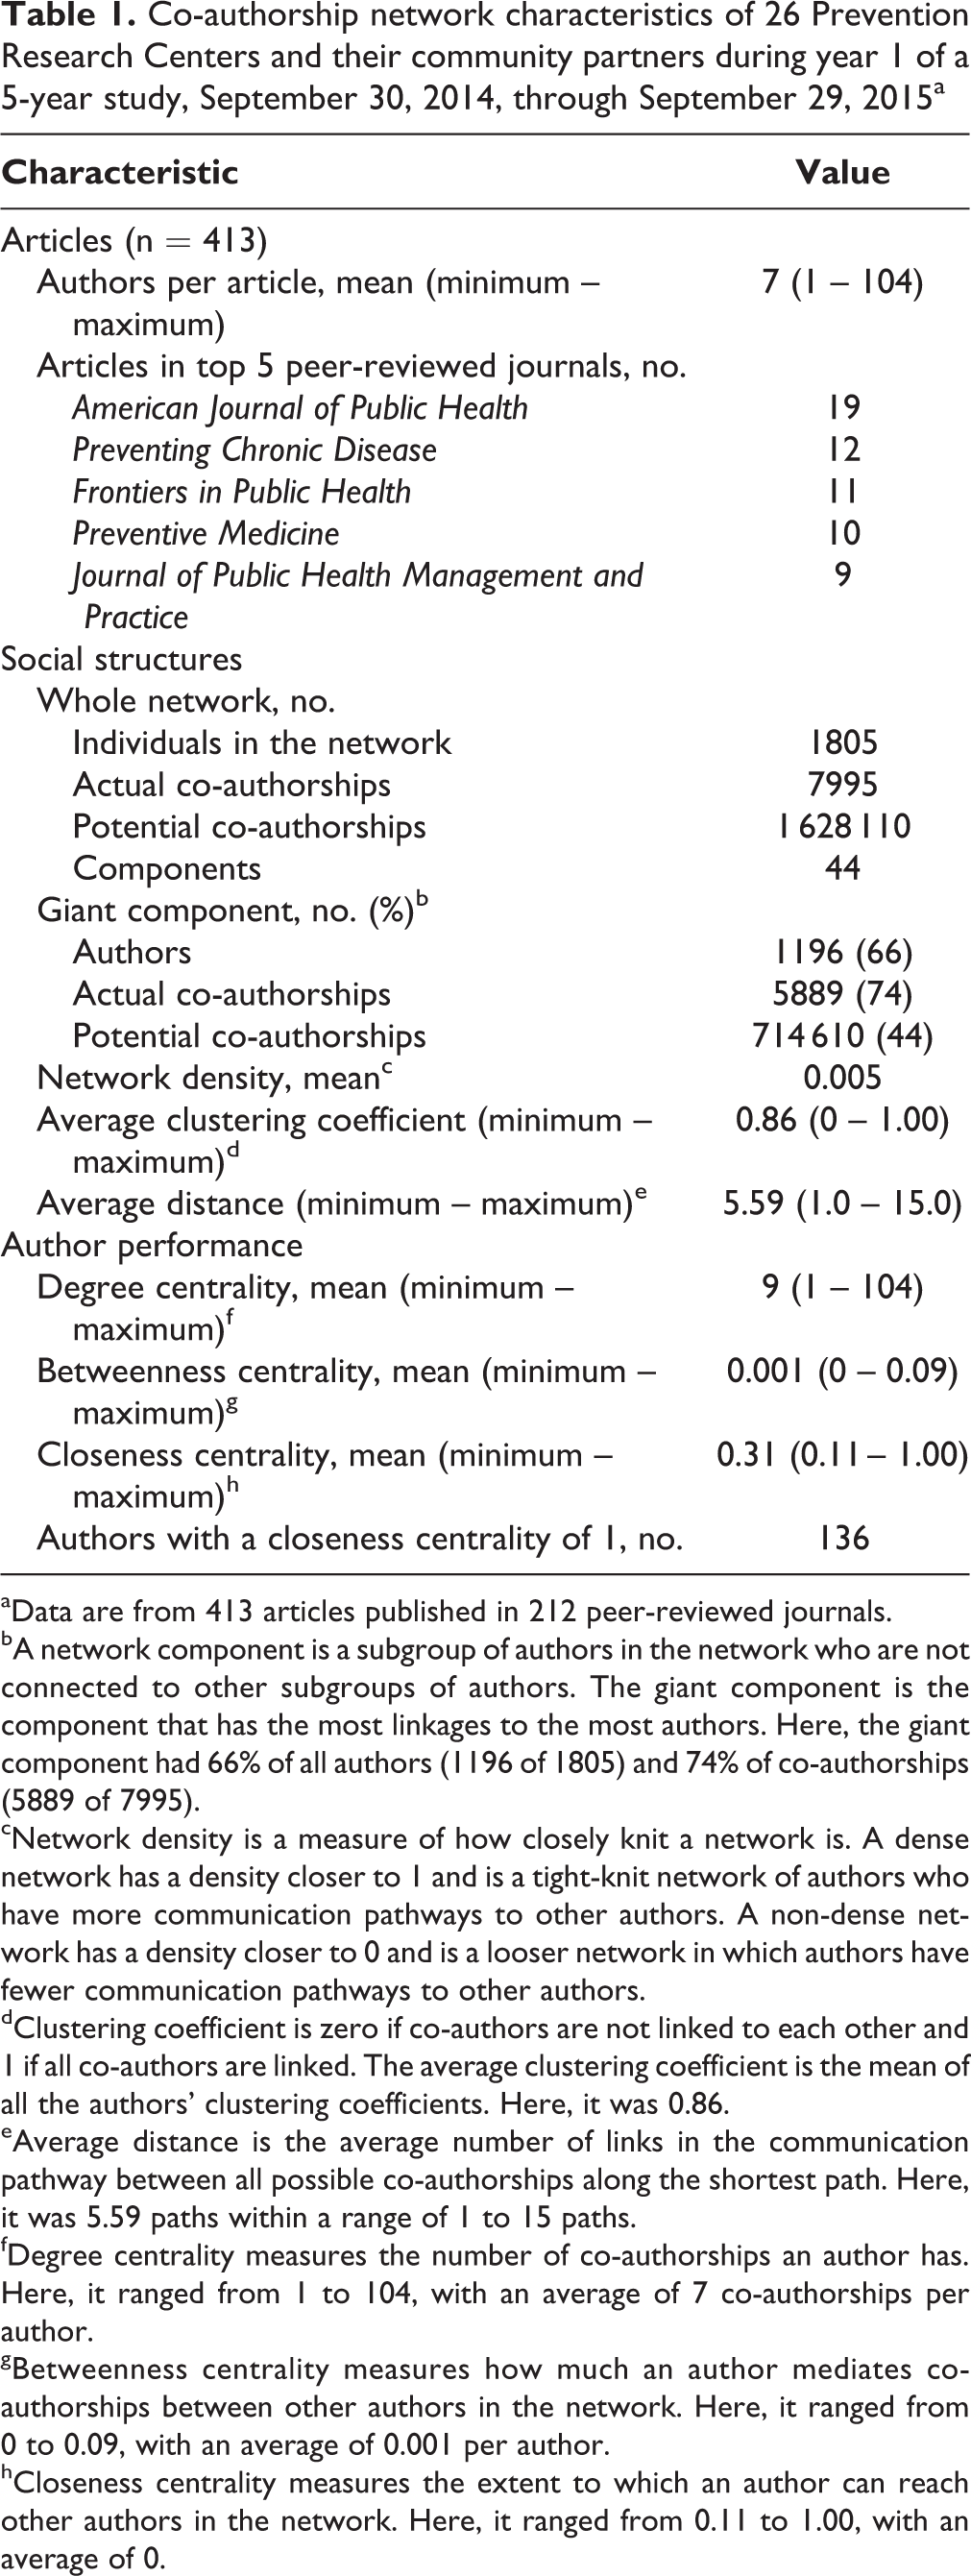
aData are from 413 articles published in 212 peer-reviewed journals.
bA network component is a subgroup of authors in the network who are not connected to other subgroups of authors. The giant component is the component that has the most linkages to the most authors. Here, the giant component had 66% of all authors (1196 of 1805) and 74% of co-authorships (5889 of 7995).
cNetwork density is a measure of how closely knit a network is. A dense network has a density closer to 1 and is a tight-knit network of authors who have more communication pathways to other authors. A non-dense network has a density closer to 0 and is a looser network in which authors have fewer communication pathways to other authors.
dClustering coefficient is zero if co-authors are not linked to each other and 1 if all co-authors are linked. The average clustering coefficient is the mean of all the authors’ clustering coefficients. Here, it was 0.86.
eAverage distance is the average number of links in the communication pathway between all possible co-authorships along the shortest path. Here, it was 5.59 paths within a range of 1 to 15 paths.
fDegree centrality measures the number of co-authorships an author has. Here, it ranged from 1 to 104, with an average of 7 co-authorships per author.
gBetweenness centrality measures how much an author mediates co-authorships between other authors in the network. Here, it ranged from 0 to 0.09, with an average of 0.001 per author.
hCloseness centrality measures the extent to which an author can reach other authors in the network. Here, it ranged from 0.11 to 1.00, with an average of 0.
Top 5 peer-reviewed journals publishing articles from 26 Prevention Research Centers (PRCs) 10 from September 30, 2014, through September 29, 2015
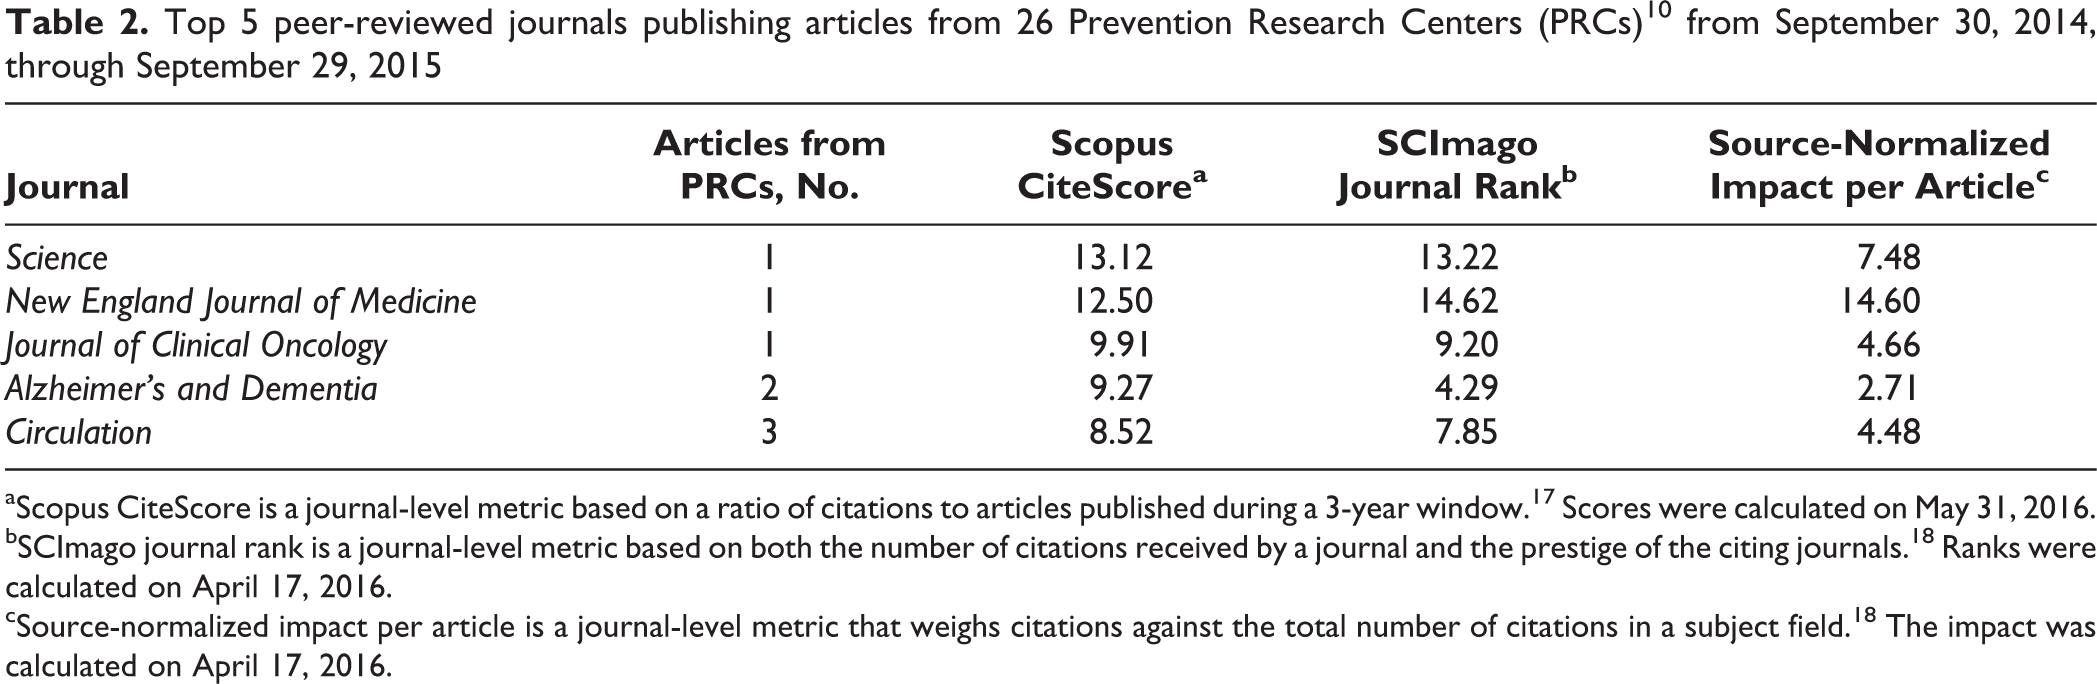
aScopus CiteScore is a journal-level metric based on a ratio of citations to articles published during a 3-year window. 17 Scores were calculated on May 31, 2016.
bSCImago journal rank is a journal-level metric based on both the number of citations received by a journal and the prestige of the citing journals. 18 Ranks were calculated on April 17, 2016.
cSource-normalized impact per article is a journal-level metric that weighs citations against the total number of citations in a subject field. 18 The impact was calculated on April 17, 2016.
The Structure of the Network
The network consisted of 1805 individual authors and co-authors and 7995 co-authorships (and therefore links), which were distributed across 44 components (Table 1). The giant component had 66.3% of all authors (1196 of 1805) and 73.7% of co-authorships (5889 of 7995). With an overall network density of 0.005, only 0.5% of all potential co-authorships (7995 actual co-authorships/1 626 306 potential co-authorships) in the network were realized. The density of the 44 components ranged from 0.008 to 1. The network had an average clustering coefficient of 0.86 and an average distance of 5.59 links.
Performance of Individual Authors
Degree centrality for the top 5 authors based on number of co-authorships ranged from 43 to 104. The average number of co-authorships per author was 9 (range, 1 to 104) (Table 1). Betweenness centrality was low (range, 0 to 0.09). Betweenness centrality for the top 5 collaboration mediators ranged from 0.05 to 0.09 (Table 1). The network had 136 authors with a closeness centrality of 1 (Table 1). These authors represented 9180 potential co-authorship opportunities and were located outside of the giant component. The closeness centrality of the entire network ranged from 0.11 to 1.00.
Discussion
We found evidence of collaboration in the PRC co-authorship network, but there is room for improvement. Although the PRCs are members of the 26 academic research centers with members charged and encouraged to work together, 1 –4 their citation network had a density of only 0.005. With only 0.5% of their potential co-authorships realized, the PRCs took minimal advantage of their collaborative potentials when compared with other health-related citation networks that had higher network densities of 0.49 to 0.68, or 49% to 68% of potential co-authorships. 14,15,19,20 Given the average distance of 6 links between any 2 authors, information about collaboration opportunities could flow easily and frequently among network members.
The Small-World Network
In 1969, Stanley Milgram proposed the “small-world effect” when he discovered that any person on the planet could connect with any other person through an average of only 6 sequential acquaintances (“the concept of 6 degrees of separation”). 17 The PRC co-authorship network is a small-world network because it has an average degree of separation of fewer than 6 authors; the average clustering coefficient was 0.86 (range, 0 to 1). In such networks, 2 authors who have common co-authors will possibly become co-authors with one another in the future. 11 –15 For example, if authors A and B separately have co-authorships with author C in a network with an average clustering coefficient of 0.86, authors A and B are better positioned to co-author an article in the future.
The PRCs are part of a formal network of 26 academic research centers funded to study health promotion and disease prevention with community partners. 1 –4 This organization itself would explain the clustered aspect of their co-authorship network. Authors belonging to a particular PRC would naturally form PRC-specific collaborative clusters because these authors collaborate by design. In addition, other components emerge because some PRCs might participate in other research networks. 21
Performance of Individual Authors
Considering the low level of actual co-authorships (0.5% of potential co-authorship opportunities) in the network, influential authors could facilitate creating co-authorships between other network members. In turn, authors seeking co-authorship opportunities could contact these influential authors for information. Network members outside of the giant component that includes the influential authors could consider engaging with authors inside the giant component to increase their co-authorship opportunities.
Another area of improvement for the network is the ease of information flow through the network. The 136 authors with highest closeness centrality were not in the giant component. These authors were “information brokers” who, in theory, could more easily reach other authors in the network and share information, but they were located outside the giant component, where the co-authorship mediators were located. Thus, if the information brokers and co-authorship mediators could increase their engagements with each other, the number of collaborations between network members would likely increase, and more co-authorships in the network would be realized.
Strengths and Limitations
This study had several limitations. First, it included only the first year of a 5-year study. Given the time needed to conceive, plan, fund, conduct, and publish a study, we would expect the number of publications from the partnership to be low in this first year and to increase over time. The study was an exploratory study, a first look, and designed to record baseline data to which the results in subsequent years can be compared. Second, the study included only collaborative efforts that resulted in peer-reviewed publications. We did not measure other collaborative activities among the PRCs and their partners, such as community engagement activities in health education or training programs. Third, we did not have the resources or data to determine the network components specific to PRCs’ networks, which they might actually represent. Studies that identify which authors belong to which PRC could provide more strategic information on how to best improve collaboration in the overall network.
Conclusions
Our findings support the value of network analysis for describing health-related scientific collaborations and the collective impact of organizational performance. 11 –13 Network analysis provided measurable ways to assess the performance of the PRC collaborative work among 26 academic research centers, in this case, on publication output. The exploratory analyses presented here provide a baseline for future evaluations of the evolution of the PRC co-authorship network structure, individual author performance, individual PRC performance, and the collective impact for the rest of the 5-year funding cycle. Examples of future studies include assessing the relationship between PRC characteristics (eg, types of partners and health topics, geographic location) and clustering behavior within the network.
We found that the number of co-authorships could probably be increased substantially, which it may do anyway, with time. In addition, we identified specific, influential authors within the network who could likely increase these collaborative activities among network members. Our results support a recommendation that the program encourage these influential authors to expand their efforts in facilitating collaborative activities among their colleagues in the network.
Footnotes
Authors’ Note
The findings and conclusions in this article are those of the authors and do not necessarily represent the official position or views of the Centers for Disease Control and Prevention (CDC), the Association of Schools and Programs of Public Health (ASPPH), or the University of Texas Rio Grande Valley. Rose Marcelin’s present address is Aveshka, Inc, Vienna, Virginia.
Acknowledgments
The authors thank Connie L. Bish, Gyan Chandra, and Jennifer An for managing the Prevention Research Centers Program Evaluation and Reporting System, which enabled us to easily access the peer-reviewed articles included in our study data.
Declaration of Conflicting Interests
The authors declared no potential conflicts of interest with respect to the research, authorship, and/or publication of this article.
Funding
The authors disclosed receipt of the following financial support for the research, authorship, and/or publication of this article: Ms Marcelin was supported by cooperative agreement no. U36/CCU300430 from CDC and ASPPH.