
Abstract
Objectives:
Tennessee was 1 of 8 states that received funding from the Care and Prevention in the United States Demonstration Project, which aimed to reduce HIV-related morbidity and mortality among racial/ethnic and sexual minority populations. The objective of this study was to describe implementation of a social network strategy (SNS) program, which leverages personal connections in social networks, to reach people with undiagnosed HIV infection for HIV testing. We targeted young black men who have sex with men (MSM) at 3 agencies in Memphis and Nashville, Tennessee, during 2013-2016.
Methods:
Specialists at the 3 agencies identified MSM with and without diagnosed HIV infection (ie, recruiters) who could recruit members from their social networks for HIV testing (ie, network associates). Both recruiters and network associates received OraQuick rapid and confirmatory HIV tests. We used χ2 and Fisher exact tests to assess differences in demographic characteristics, HIV testing, and care engagement status by agency.
Results:
Of 1752 people who were tested for HIV in the SNS program, 158 (9.0%) tested positive; of these, 80 (50.6%) were newly diagnosed with HIV. Forty-seven of the 78 (60.3%) people who were previously diagnosed with HIV were not in care in the previous 12 months; of these, 27 (57.4%) were reengaged in medical care. Of 80 people newly diagnosed with HIV, 44 (55.0%) were linked to care.
Conclusions:
The SNS program ascertained HIV status among a high-risk population in a heavily burdened region. Further program evaluation is needed to understand how to improve linkage to care among people with newly diagnosed HIV.
An estimated 39 782 people were newly diagnosed with HIV infection in 2016; as of that same year, a total of 973 846 people were diagnosed and living with HIV infection in the United States. 1 Residents of the southern United States, young adults aged 20-29, black people, and men who have sex with men (MSM) remain disproportionately diagnosed with HIV infection. 1 -5 In 2016, Tennessee was tied with Illinois for the 17th highest rate of HIV diagnoses among US states; Memphis ranked 8th, and Nashville ranked 50th for the highest rate of HIV diagnoses among US metropolitan statistical areas. 1 That same year, metropolitan statistical areas in Memphis and Nashville accounted for more than 50% of new HIV diagnoses in the state. 6
As of 2015, an estimated 15% of people living with HIV (PLWH) in the United States were unaware of their HIV-positive status, more than half of whom resided in the South. Furthermore, as of 2015, an estimated 16%-19% of PLWH in Tennessee were undiagnosed. In the same year, the estimated time from HIV infection to diagnosis was longer among non-Hispanic black people (3.3 years) than among non-Hispanic white people (2.2 years) nationally. 7
These data inform the National HIV/AIDS Strategy. One goal of the National HIV/AIDS Strategy is to increase the proportion of PLWH who know their HIV status to 90%, with an emphasis on the “right people, right places, right practices” (referring to key populations, priority areas, and evidence-based strategies, respectively), including residents of the South and young black MSM. 8 In 2012, the Tennessee Department of Health received funding from the Centers for Disease Control and Prevention (CDC) for the Care and Prevention in the United States (CAPUS) Demonstration Project, a 4-year (2012-2016) cross-agency demonstration project funded by the US Department of Health and Human Services Secretary’s Minority AIDS Initiative Fund with the goal of reducing HIV- and AIDS-related morbidity and mortality among racial/ethnic minority groups in the United States. 9
In Tennessee, CAPUS funds supported a social network strategy (SNS) approach to recruit young black MSM at high risk for HIV infection to be tested for HIV. The SNS approach assumes that people who engage in high-risk behaviors cluster in networks with people who engage in similar behaviors. Recruiters are identified to bring their social network members in for HIV testing services. 10 This strategy has been effective for identifying black MSM who are unaware of their HIV status in several mid-Atlantic and Northeast cities; however, data from the South are limited. We describe the implementation of the SNS approach among young black MSM in Memphis and Nashville, Tennessee, from 2013 through 2016. We report SNS HIV testing results, linkage to care for participants newly diagnosed with HIV, and reengagement in care for participants who were previously diagnosed with HIV. We also compare overall results with SNS goals designed by staff members in consultation with program officers and required as part of the grant application by the Tennessee Department of Health to gauge the effectiveness of implementation.
Methods
The Tennessee Department of Health implemented the SNS program from June 1, 2013, through June 30, 2016, at 3 agencies: agency 1 and agency 2 in Memphis and agency 3 in Nashville. All 3 agencies are long-standing AIDS service organizations. The SNS program goals were to (1) conduct 900 HIV tests (300 per agency) per year for 3 years (n = 2700 tests total); (2) reach a high level of testing efficiency, whereby the rate of new diagnoses justified the cost and implementation of expanded testing, indicated by a high rate of HIV positivity (≥5%), as part of the SNS program, including newly diagnosed infections and previously diagnosed infections; and (3) link ≥80% of participants with newly diagnosed HIV to care. We based the goal for percentage HIV positivity on recent HIV testing positivity results across Tennessee (most programs in nonclinical settings yielded 1%-2% total positivity); the prevalence of diagnosed HIV infection in Tennessee; and published reports from programs that had received CAPUS funding, implemented similar strategies, and reported high overall positivity. 9 ,11 This analysis of deidentified programmatic data was considered exempt by the Tennessee Department of Health Institutional Review Board.
Personnel
Personnel for the SNS program consisted of 1 SNS program coordinator at the Tennessee Department of Health HIV/Sexually Transmitted Disease/Viral Hepatitis Section (Nashville) and 1 SNS program specialist who was a young gay black man at each participating agency. The SNS program coordinator provided technical assistance and training to SNS program specialists at the 3 agencies, conducted quarterly site visits to assess performance, and ensured SNS program specialists focused on program goals. A contractor who was a master trainer for the SNS program and a training specialist at the Tennessee Department of Health (M.M.) trained each SNS staff member by using the CDC Social Networks Testing Interim Guide for HIV Counseling, Testing, and Referral Program. 11 The series of trainings included training on “I Know” (the Tennessee curriculum for HIV testing based on the CDC “Fundamentals of HIV Prevention Counseling” and “Issues of Clients Who Test Positive” courses), HIV testing and counseling, antiretroviral therapy and access to services (the CDC HIV Prevention training curriculum that contains skill building, motivational interviewing, and strengths-based counseling), and the OraQuick Rapid HIV Test (OraSure, Bethlehem, PA). 12 -16
Recruitment
We targeted black MSM aged 15-34 in Memphis and Nashville for participation in the SNS program. However, we encouraged agencies to not turn people away for testing regardless of race, age, or sexual risk behaviors. As such, the final recruited population included some people (eg, women, those aged ≥35) who fell outside of the target population. SNS program specialists identified MSM with and without diagnosed HIV (ie, recruiters) to recruit members of their own social networks (ie, network associates) to be tested for HIV. Recruiters received a $20 gift card for each network associate they referred who completed HIV testing. Network associates received a $20 gift card for completing their own HIV testing. SNS program specialists used gay family networks (support networks that gay, bisexual, and transgender people of color may create in response to societal marginalization and rejection from biological families), 17 gay-friendly Greek lettered/underground Greek/gay social organizations (http://www.nuphizeta.com), 18 social media, 19,20 and alternative venue testing (ie, HIV testing available outside of a laboratory or clinical setting, such as a testing booth at a fair or bar) 11 to identify recruiters and network associates.
Laboratory Testing
We performed HIV tests by using oral swabs via OraQuick Rapid tests, with confirmatory testing. We documented HIV test results in EvaluationWeb, a CDC-funded online data collection and reporting system for HIV testing and prevention activities. 21 Participants who tested positive for HIV and were either linked to or reengaged in HIV care had HIV-1 viral load testing performed as part of routine medical care, and we entered results along with data on demographic characteristics and risk behavior into the Enhanced HIV/AIDS Reporting System (eHARS), CDC’s National HIV Surveillance System. 22 All laboratories performing viral load testing for patients in Tennessee were required to report these test results to the Tennessee Department of Health effective January 1, 2012. 23 Tennessee met CDC criteria for designation as a complete viral load laboratory-reporting jurisdiction in 2013. 24
Data Collection and Definitions
We collected data on demographic characteristics and laboratory test results for all SNS participants who completed HIV testing. Demographic data included age at HIV testing (<15, 15-24, 25-34, 35-44, 45-54, 55-64, and ≥65), gender identity (male, female, or transgender), race/ethnicity (Hispanic, non-Hispanic white, non-Hispanic black, and non-Hispanic other), and self-reported HIV transmission risk factors (MSM, people who inject drugs [PWID], both MSM and PWID [MSM/PWID], heterosexual contact, other [including perinatal infection, blood transfusion, tattoos], and unknown). We extracted data from eHARS for participants testing positive for HIV and from EvaluationWeb for participants testing negative for HIV.
Consistent with CDC surveillance definitions, 25 we used data on viral load to ascertain linkage to and reengagement in care. We used all data on viral load in eHARS for up to 9 months after a participant tested positive for HIV. We defined participants as newly diagnosed with HIV infection if there was no previous HIV-positive test result in eHARS. We defined participants as having previously diagnosed HIV if they had a previous HIV-positive test result in eHARS. For participants newly diagnosed with HIV, we defined linkage to care as having ≥1 viral load after HIV diagnosis (in <1 month, 1 to <3 months, or 3-9 months), and we defined lost to care as having no viral load before the end of follow-up at 9 months. We considered participants with previously diagnosed HIV infection to be in care if they had ≥1 viral load within 12 months of the most recent HIV-positive test result, and we considered participants to be out of care if no data on viral load were available in the previous 12 months. We considered previously diagnosed and out-of-care individuals to be reengaged in care if they had ≥1 viral load within 9 months of their most recent HIV-positive test result.
Statistical Analysis
We reported data on age, race/ethnicity, gender, transmission risk factor, HIV test result (positive or negative), HIV-positive test result type (previously diagnosed HIV positive or newly diagnosed HIV positive), participants previously diagnosed with HIV who were in care, participants previously diagnosed with HIV who were out of care, participants previously diagnosed with HIV who were reengaged in care, participants newly diagnosed with HIV who were linked to care (in <1 month, 1 to <3 months, or 3-9 months), and participants newly diagnosed with HIV who were lost to care, overall and by agency. We compared data on the number and percentage of categorical variables among agencies by using the Pearson χ2 test and Fisher exact test, as appropriate.
We calculated the network index (ie, the number of network associates divided by the number of recruiters, with a range of 5.0-15.4) as another measure of the efficiency of the SNS program, overall and by agency. 10,26 Higher index numbers indicated referral of more people per recruiter; this may have included more individuals than each recruiter truly had within their network (perhaps to take advantage of the recruitment incentives). Lower index numbers indicated an inability of recruiters to recruit network associates and, therefore, a reduced likelihood of identifying people with newly diagnosed HIV to reach program goals. Each agency also reported the number of HIV tests administered throughout the study period. We then used a nonparametric method to estimate the distribution of the number of tests provided over time (assuming the number of tests provided behaved as a random variable). The kernel density plot derived from this data-smoothing approach used an Epanechnikov kernel function, in which the area under the agency-specific curves summed to 1. We conducted all analyses by using Stata version 12.1. 27
Results
The overall network index was 6.7 (1752 network associates divided by 262 recruiters); network indices were 15.4 (632 network associates, 41 recruiters) at agency 1, 5.0 (614 network associates, 123 recruiters) at agency 2, and 5.2 (506 network associates, 98 recruiters) at agency 3 (Figure 1). The number of HIV tests conducted fluctuated during the study period: the frequency of testing increased initially until it peaked at agency 2 in January through March of 2014, although it dipped during that same period at agency 1 and agency 3; it dipped sharply in January through February of 2015, particularly at agency 2 and agency 3; and then it increased sharply thereafter until a final decline near the end of the testing period in early 2016 (Figure 2).
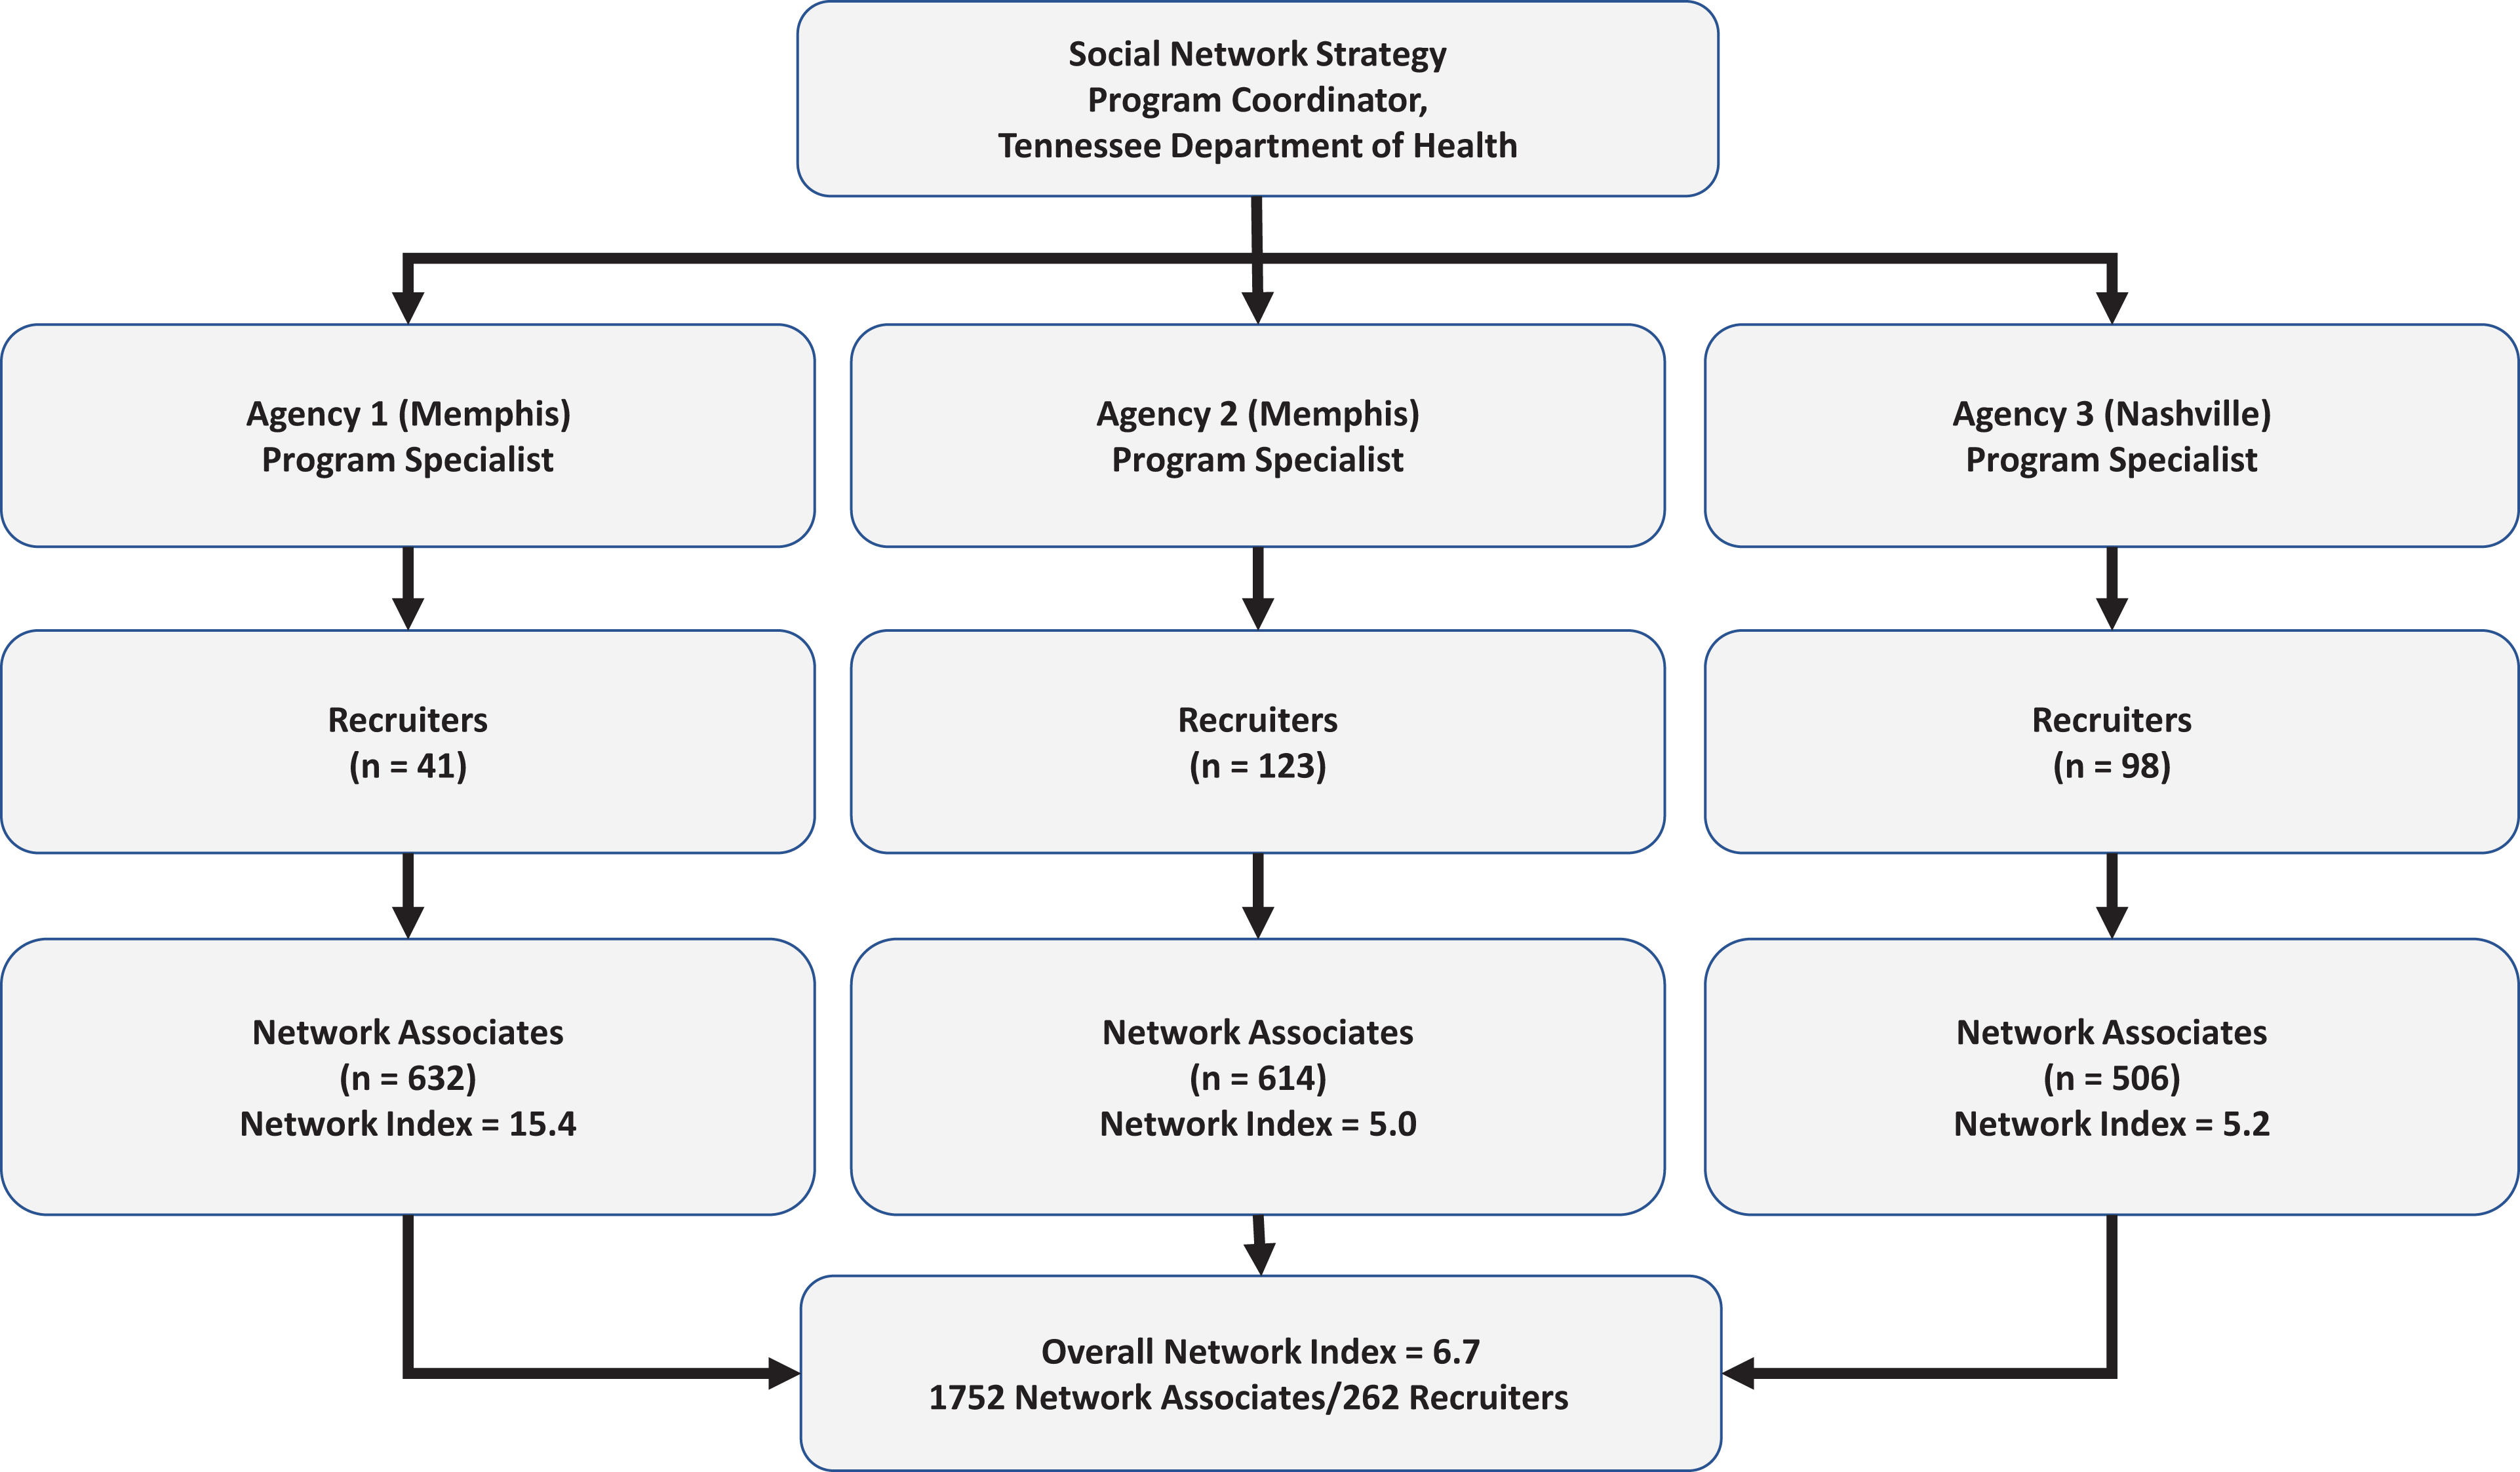
Hierarchical structure of the social network strategy (SNS) program to reach people with undiagnosed HIV infection for HIV testing, among primarily young black men who have sex with men in Memphis and Nashville, Tennessee, June 1, 2013–June 30, 2016. The SNS approach assumes that people who engage in high-risk behaviors cluster in networks with people who engage in similar behaviors. Social network strategy program specialists identified MSM with and without diagnosed HIV (“recruiters”) to bring in members of their social network (“network associates”) for HIV testing services. All network associates and recruiters were tested for HIV. The network index (the number of network associates divided by the number of recruiters) was a measure of the efficiency of the SNS program. The program was part of the Care and Prevention in the United States Demonstration Project, a 4-year (2012-2016) cross-agency demonstration project led by the Centers for Disease Control and Prevention to reduce HIV/AIDS-related morbidity and mortality among racial/ethnic minority groups in the United States. 9
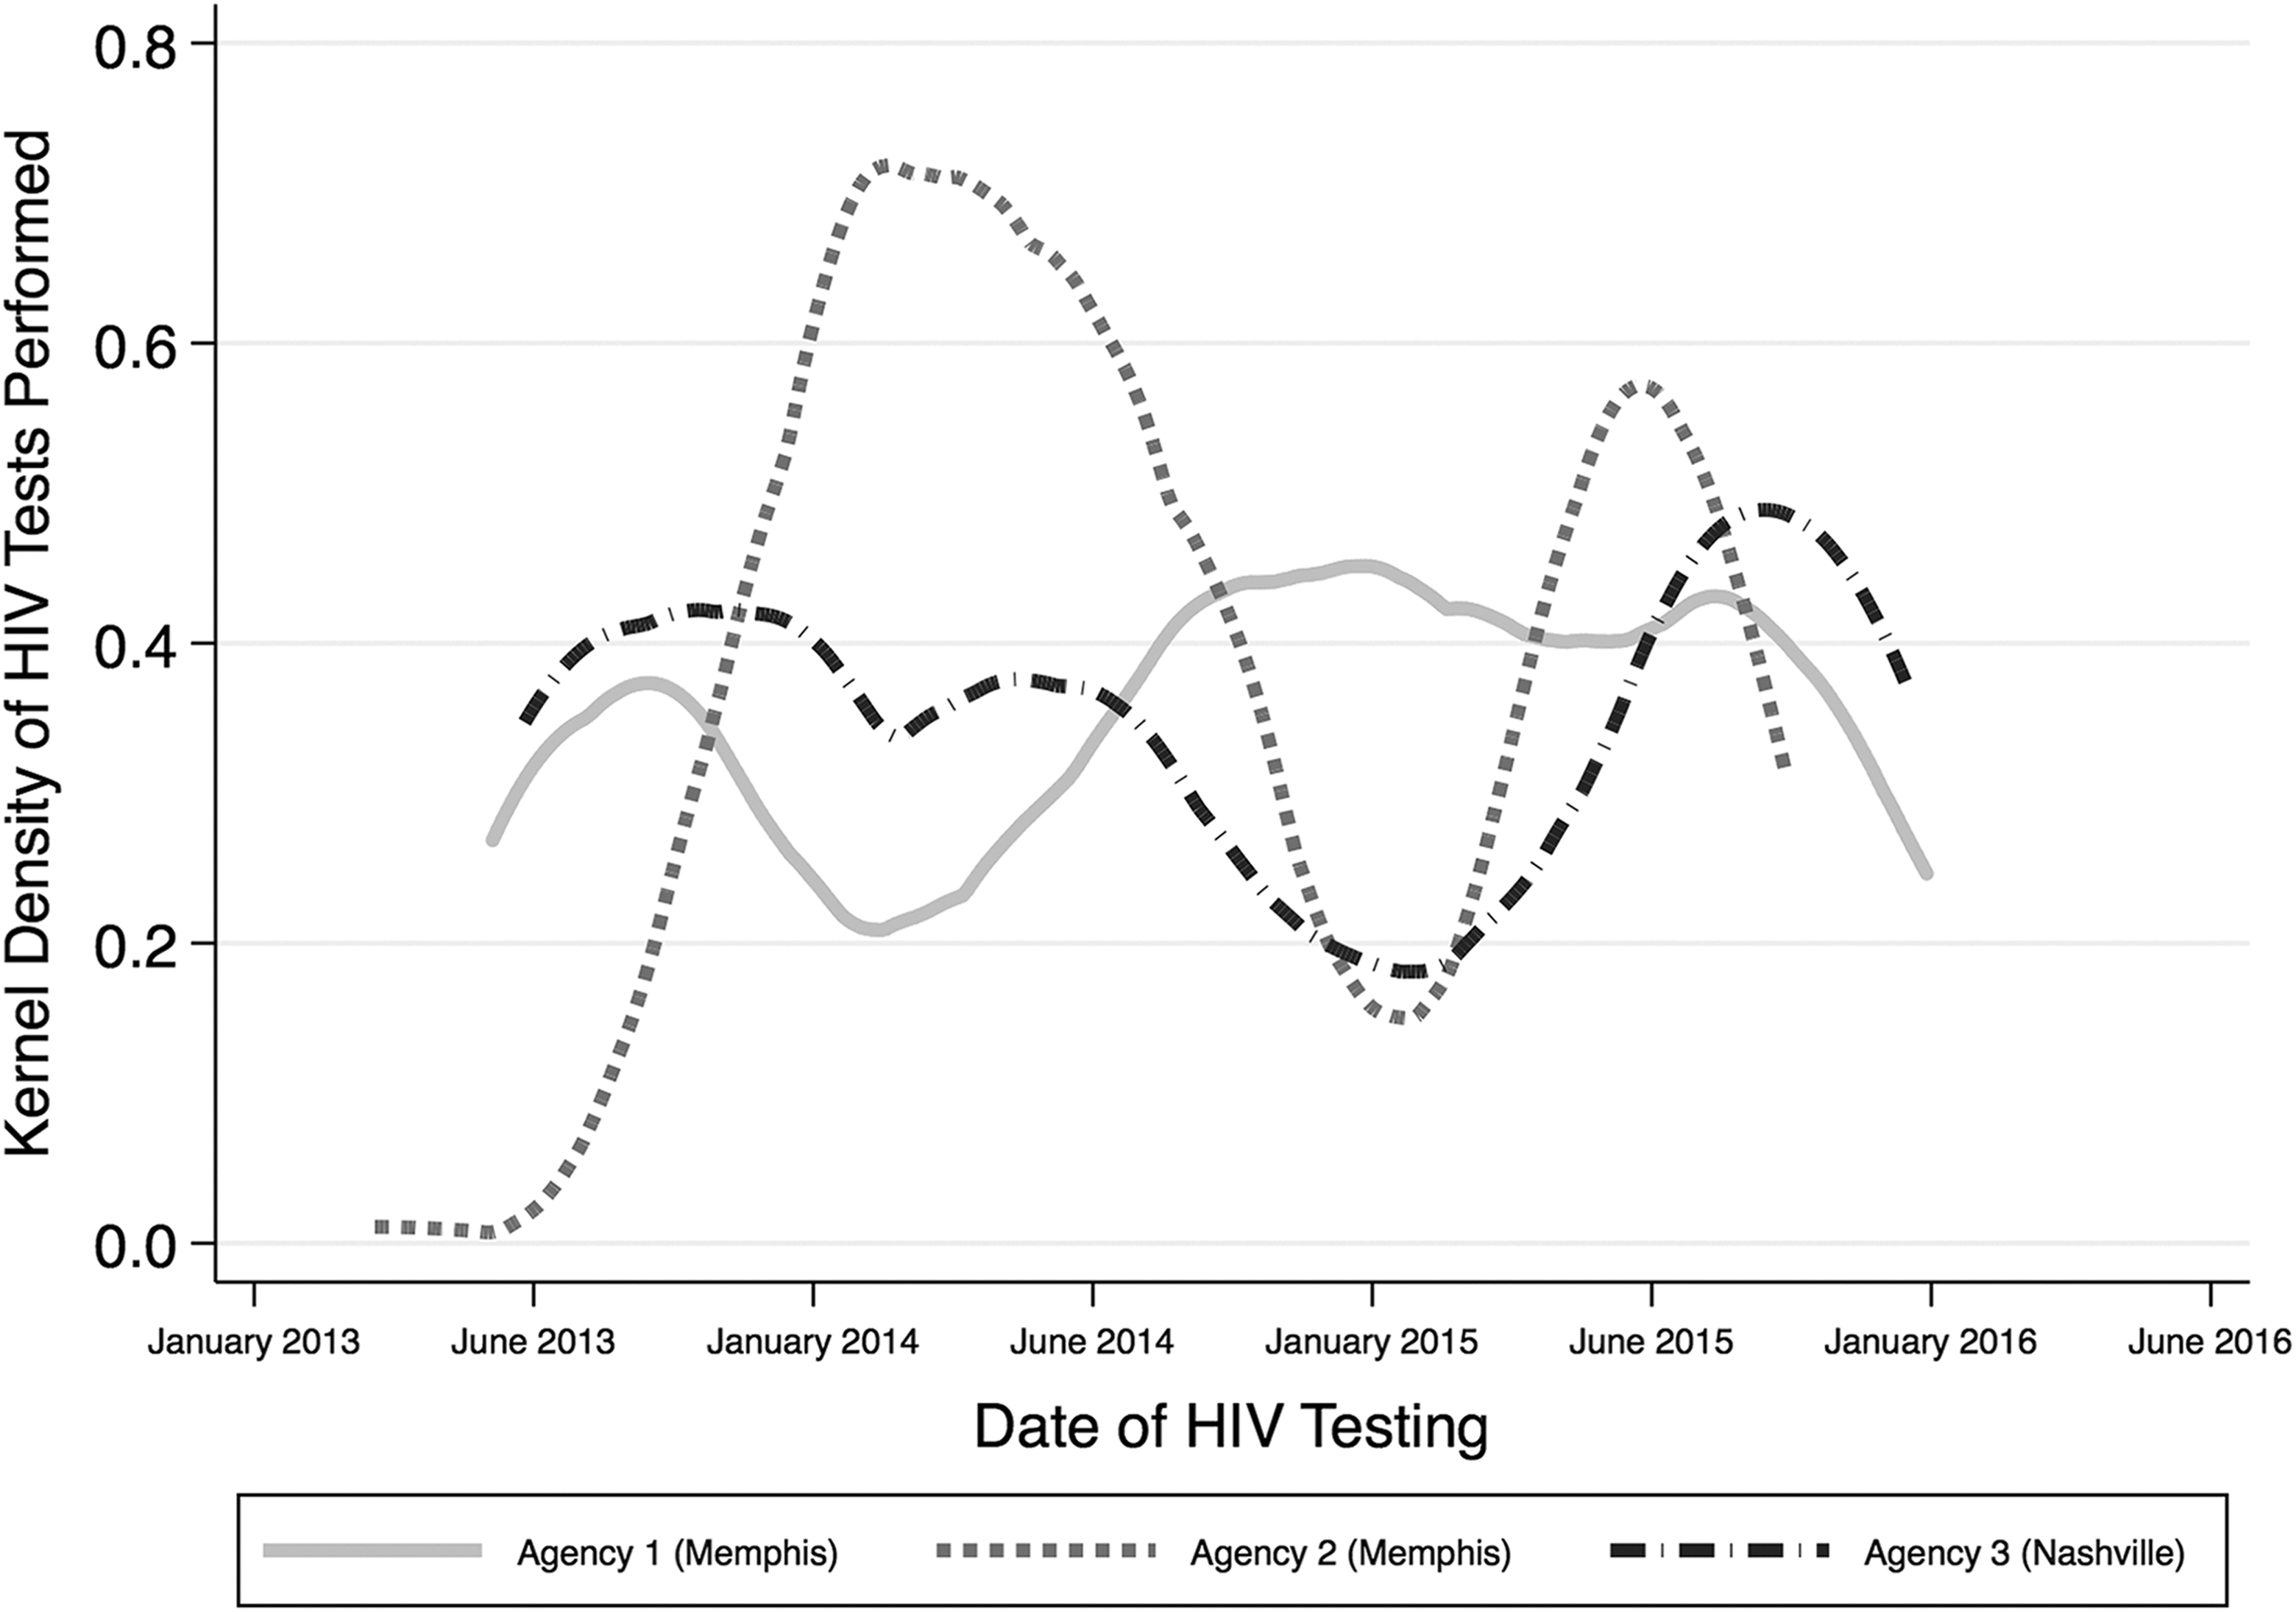
Kernel density distribution of HIV tests, by agency, as part of a social network strategy program that leveraged social networks to reach primarily young black men who have sex with men with undiagnosed HIV infection for HIV testing, Memphis and Nashville, Tennessee, June 1, 2013–June 30, 2016. The smoothed curves depict the instantaneous probability and frequency of HIV testing over time. The program was part of the Care and Prevention in the United States Demonstration Project, a 4-year (2012-2016) cross-agency demonstration project led by the Centers for Disease Control and Prevention to reduce HIV/AIDS-related morbidity and mortality among racial/ethnic minority groups in the United States. 9
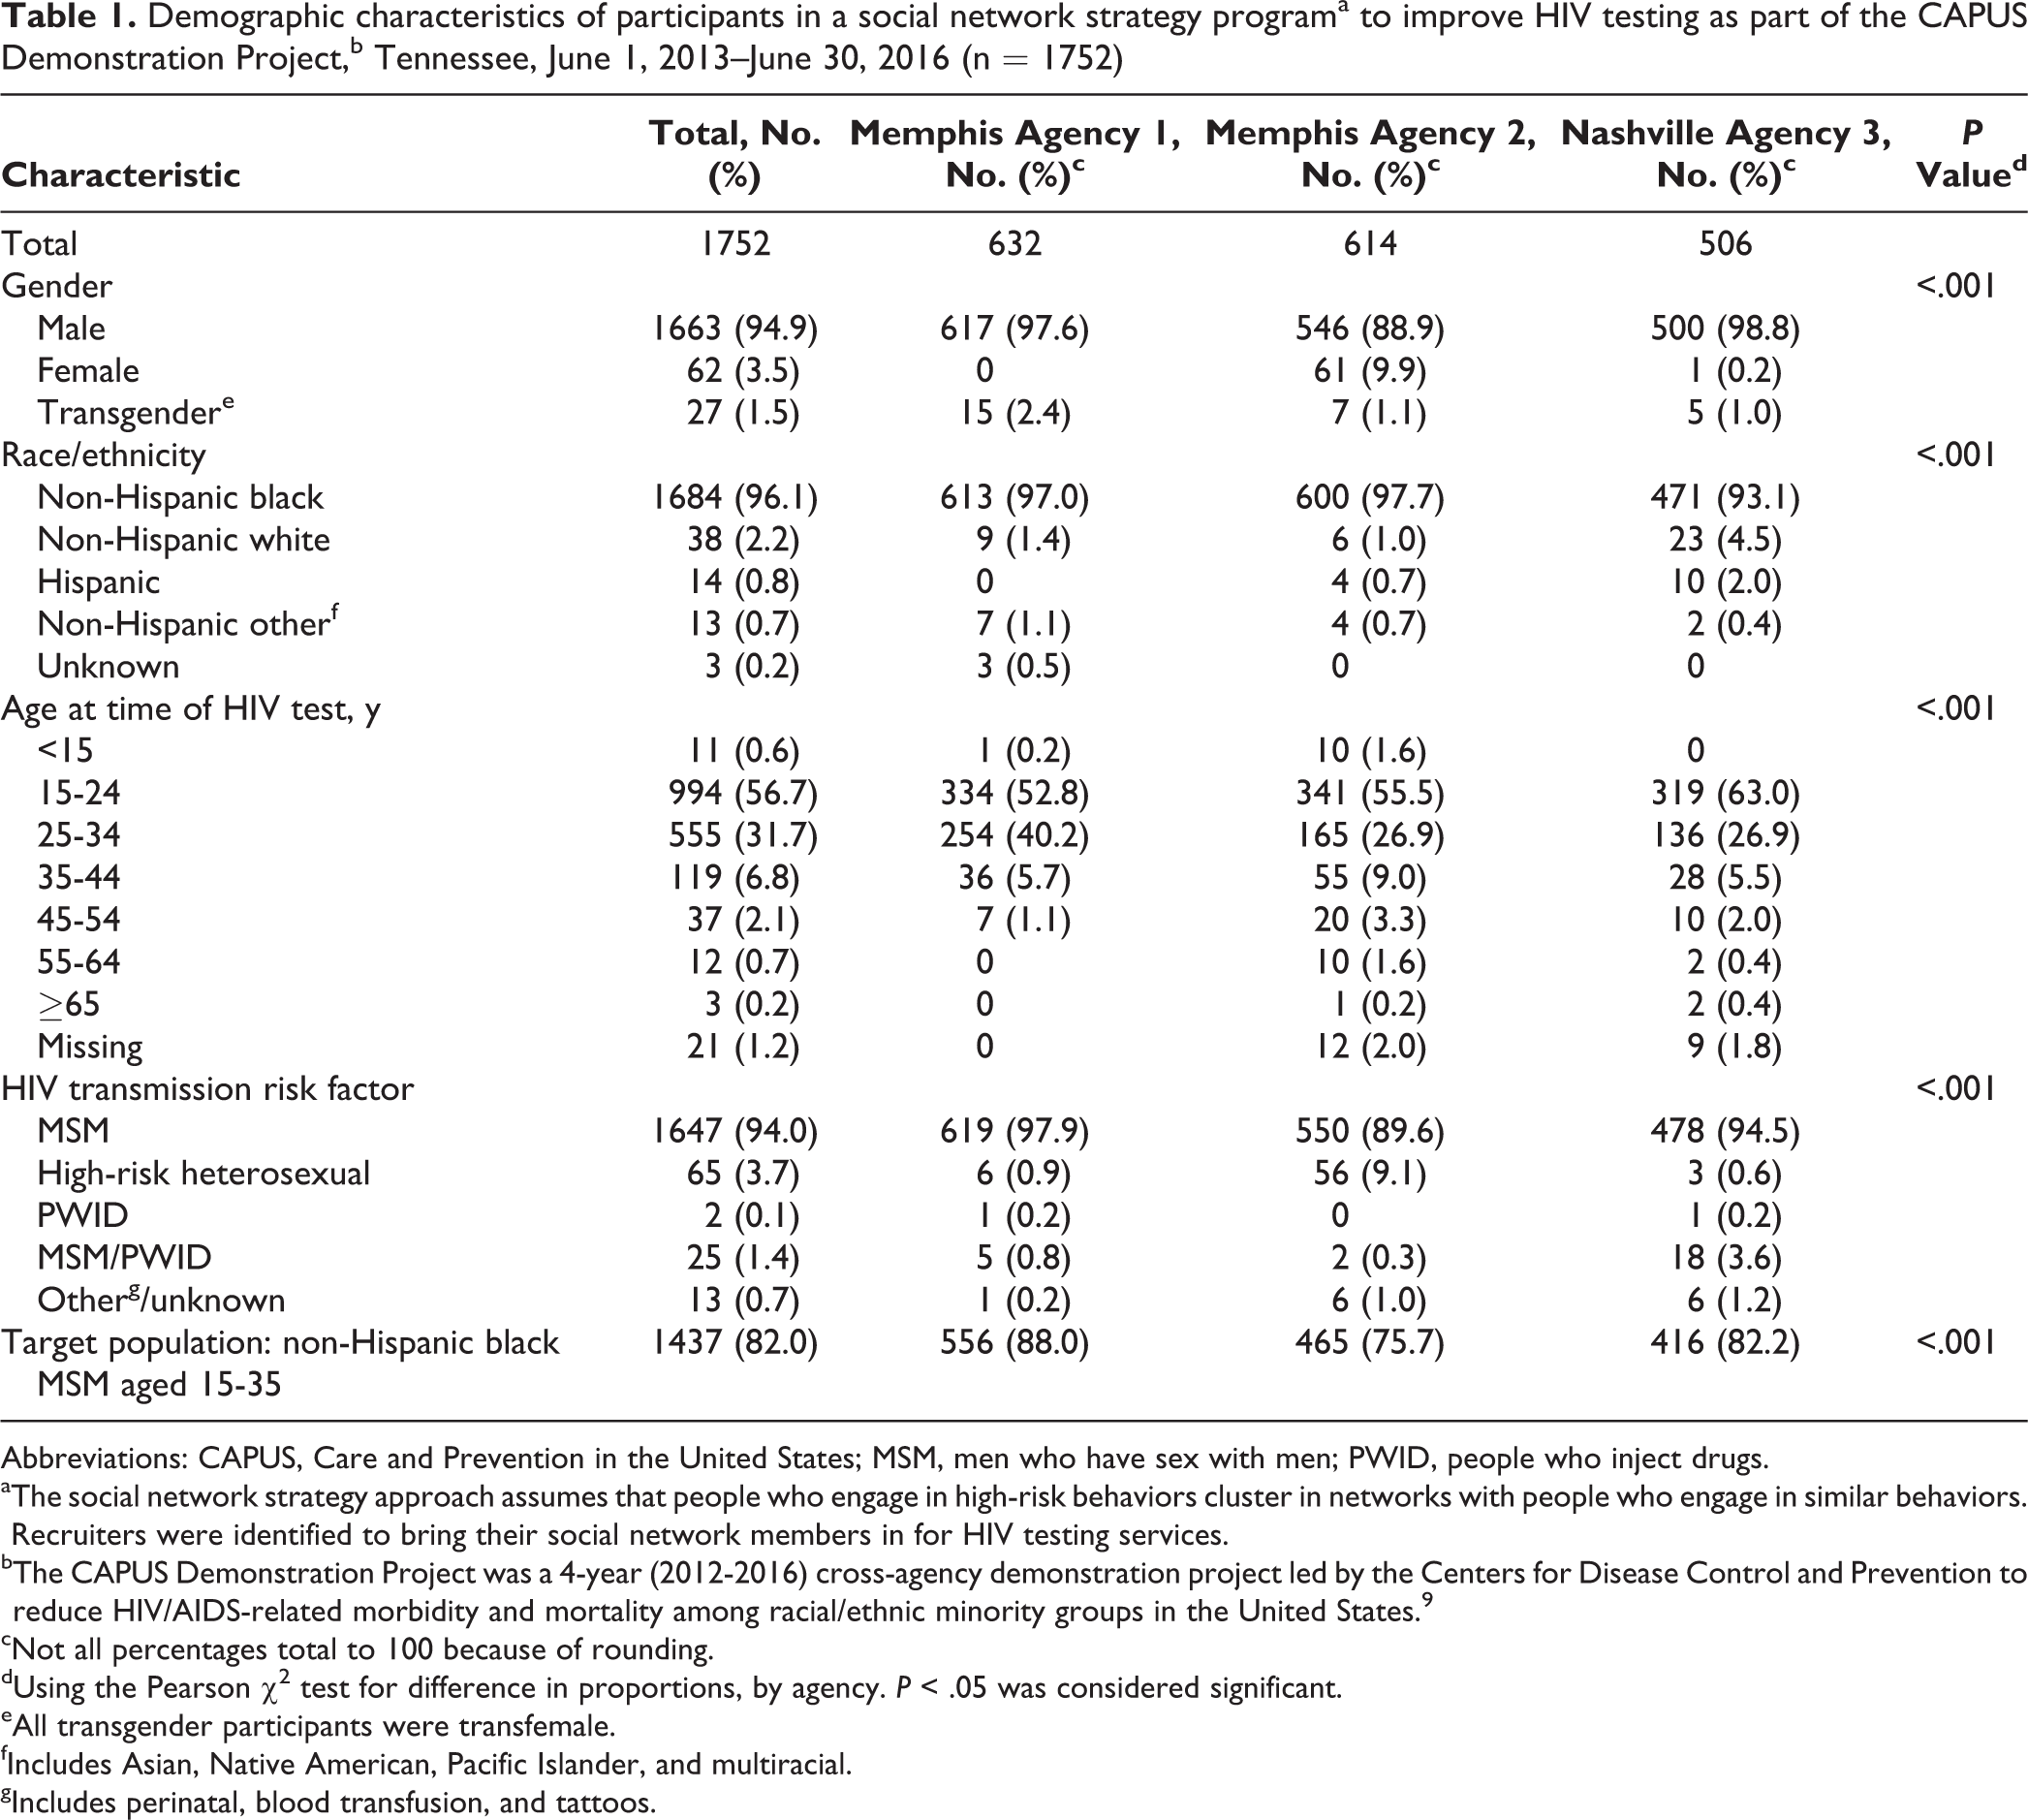
Of 1752 participants tested for HIV, 1549 (88.4%) were aged 15-34, 1663 (94.9%) were male, 1684 (96.1%) were non-Hispanic black, and 1647 (94.0%) were MSM. A total of 1437 (82.0%) had characteristics associated with the target population (ie, non-Hispanic black MSM aged 15-34; Table 1). Of note, 27 (1.5%) participants self-identified as transfemale. A significantly lower percentage of participants tested in Nashville compared with Memphis were non-Hispanic black: 471 of 506 (93.1%) at agency 3, 613 of 632 (97.0%) at agency 1, and 600 of 614 (97.7%) at agency 2 (P < .001). A significantly higher percentage of participants tested at agency 2 compared with agency 1 and agency 3 were aged 15-34: 506 (82.4%) at agency 2, 588 (93.0%) at agency 1, and 455 (89.9%) at agency 3 (P < .001). A significantly higher percentage of participants tested self-identified as transfemale at agency 1 (n = 15, 2.4%) than at agency 2 (n = 7, 1.1%) or agency 3 (n = 5, 1.0%; P = .01). In addition, a significantly higher percentage of participants tested at agency 1 (88.0%) than at agency 2 (75.7%) or agency 3 (82.2%) were members of the target population (P < .001).
Demographic characteristics of participants in a social network strategy programa to improve HIV testing as part of the CAPUS Demonstration Project,b Tennessee, June 1, 2013–June 30, 2016 (n = 1752)
Abbreviations: CAPUS, Care and Prevention in the United States; MSM, men who have sex with men; PWID, people who inject drugs.
aThe social network strategy approach assumes that people who engage in high-risk behaviors cluster in networks with people who engage in similar behaviors. Recruiters were identified to bring their social network members in for HIV testing services.
bThe CAPUS Demonstration Project was a 4-year (2012-2016) cross-agency demonstration project led by the Centers for Disease Control and Prevention to reduce HIV/AIDS-related morbidity and mortality among racial/ethnic minority groups in the United States. 9
cNot all percentages total to 100 because of rounding.
dUsing the Pearson χ2 test for difference in proportions, by agency. P < .05 was considered significant.
eAll transgender participants were transfemale.
fIncludes Asian, Native American, Pacific Islander, and multiracial.
gIncludes perinatal, blood transfusion, and tattoos.
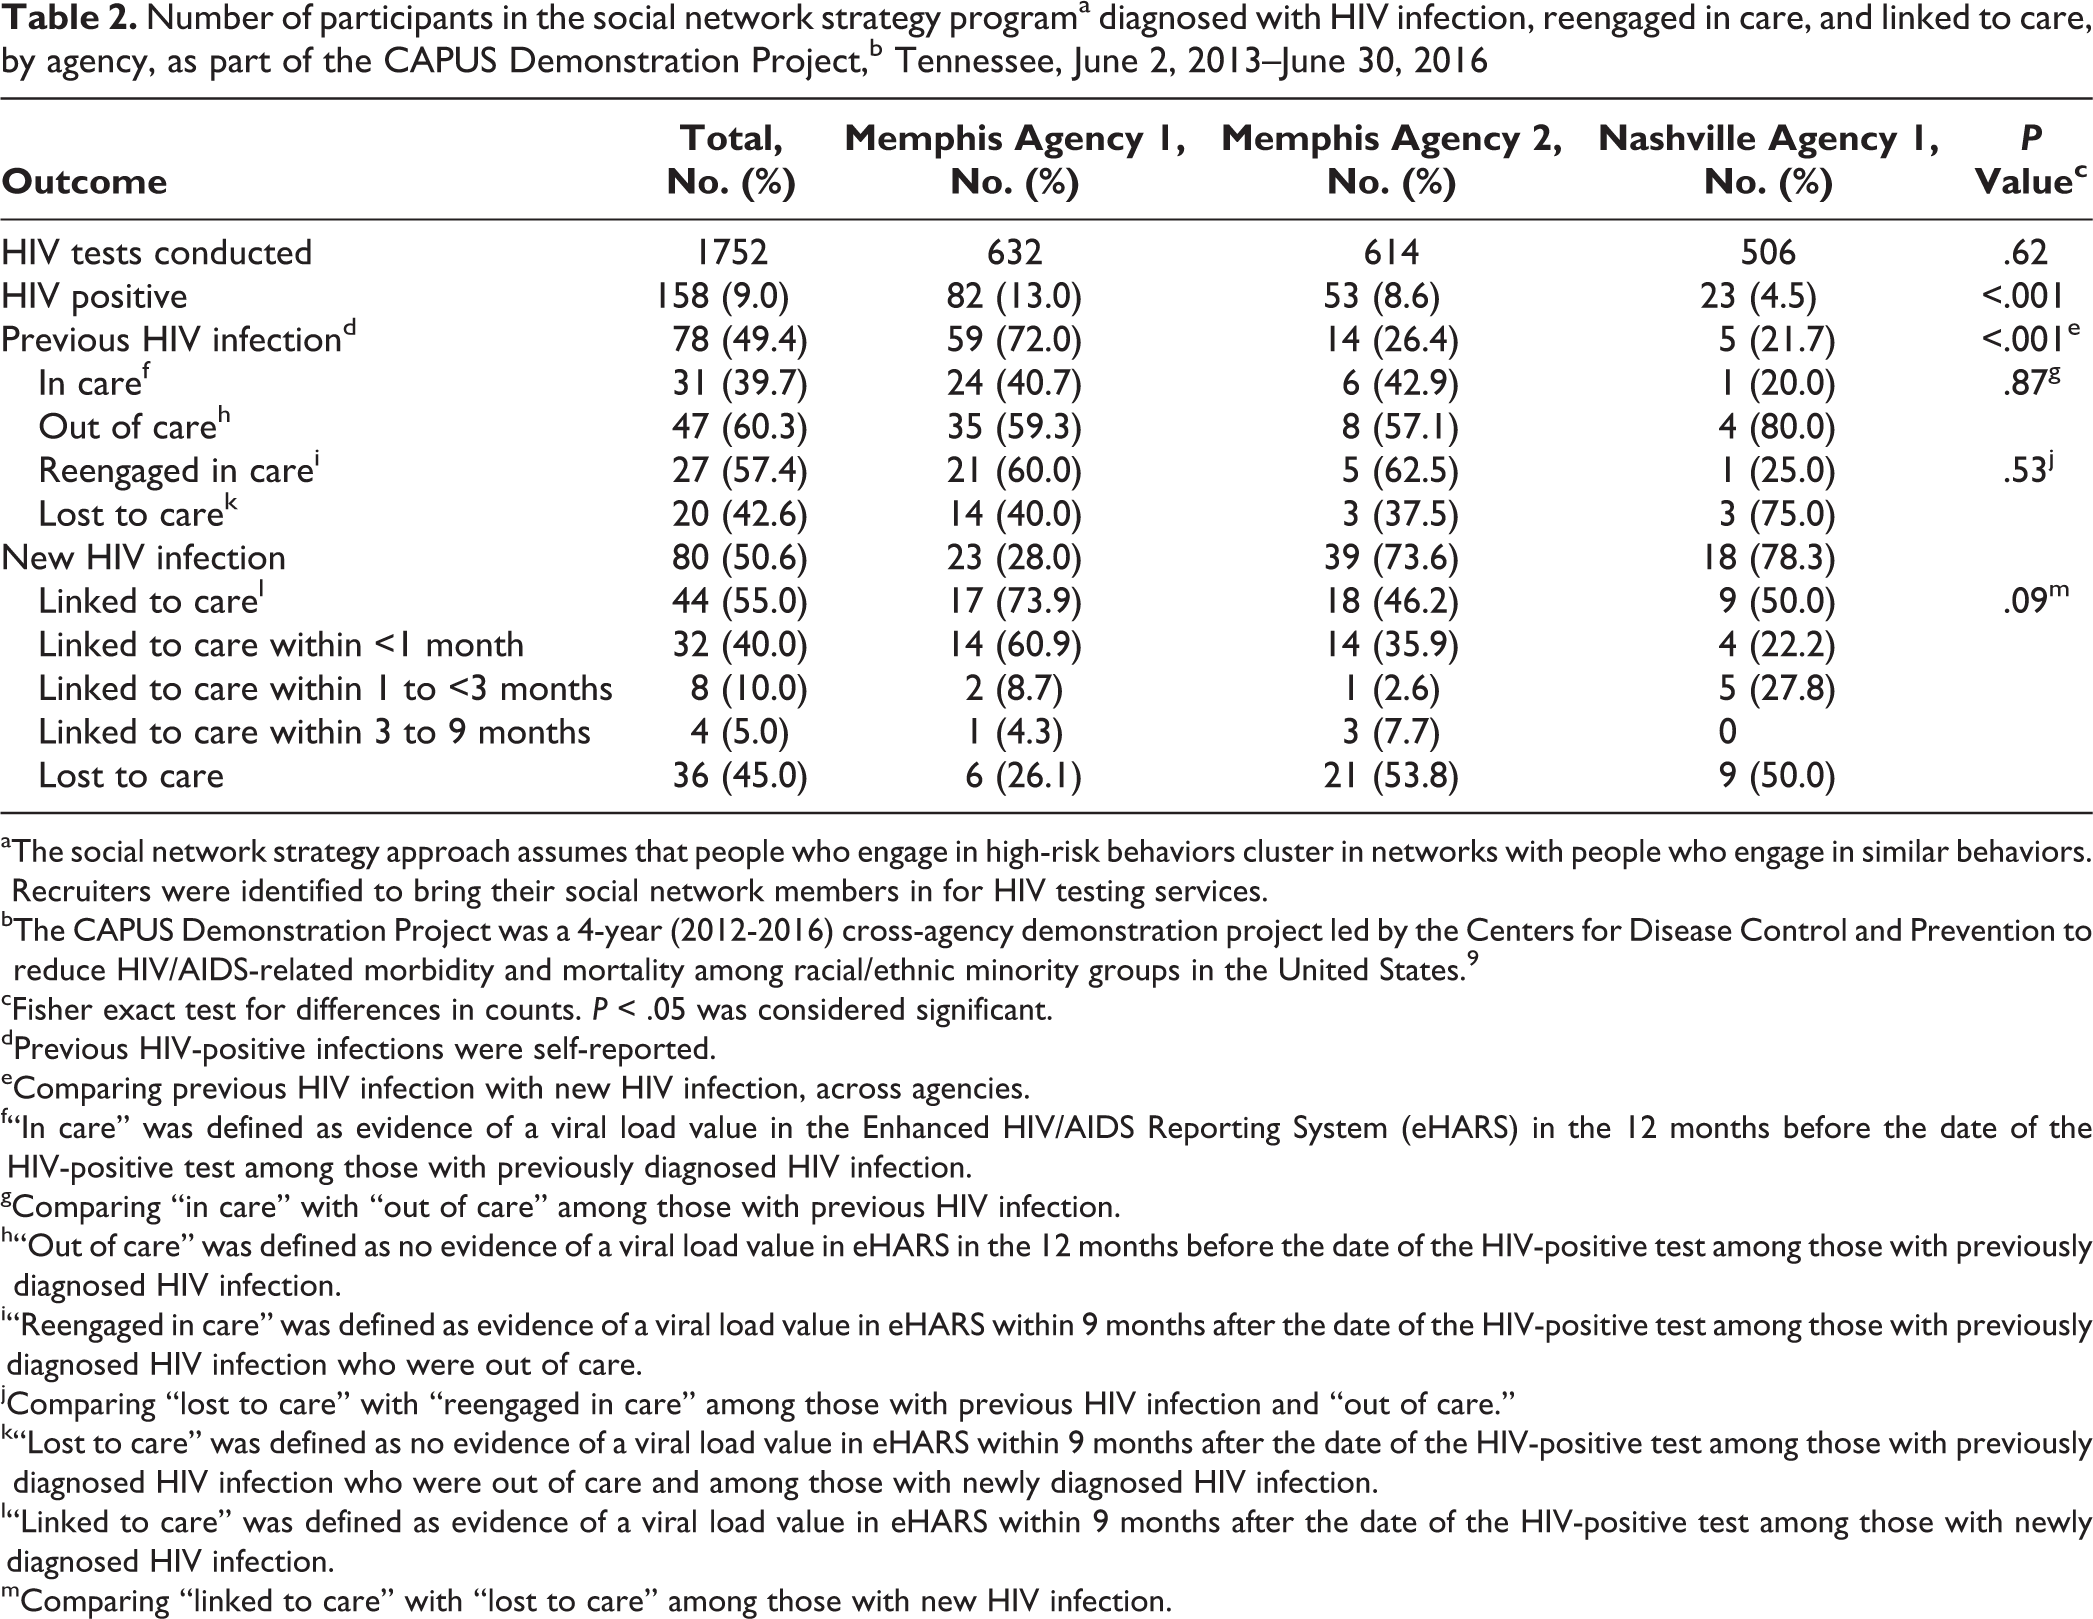
Of 1752 participants tested, 158 (9.0%) tested positive for HIV: 82 of 632 (13.0%) at agency 1, 53 of 614 (18.6%) at agency 2, and 23 of 506 (4.5%) at agency 3. The proportion of HIV-positive test results differed significantly by agency (13.0% at agency 1, 8.6% at agency 2, and 4.5% at agency 3; P < .001; Table 2). Of the 158 participants with positive test results, 78 (49.4%) were previously diagnosed with HIV and 80 (50.6%) were newly diagnosed with HIV. The highest percentage of participants previously diagnosed with HIV was at agency 1 (59 of 82 [72.0%], P < .001). A higher percentage of participants newly diagnosed with HIV were at agency 2 (39 of 53 [73.6%] and agency 3 (18 of 23 [78.3%]) than at agency 1 (23 of 82 [28.0%]; P < .001; Table 2).
Number of participants in the social network strategy programa diagnosed with HIV infection, reengaged in care, and linked to care, by agency, as part of the CAPUS Demonstration Project,b Tennessee, June 2, 2013–June 30, 2016
aThe social network strategy approach assumes that people who engage in high-risk behaviors cluster in networks with people who engage in similar behaviors. Recruiters were identified to bring their social network members in for HIV testing services.
bThe CAPUS Demonstration Project was a 4-year (2012-2016) cross-agency demonstration project led by the Centers for Disease Control and Prevention to reduce HIV/AIDS-related morbidity and mortality among racial/ethnic minority groups in the United States. 9
cFisher exact test for differences in counts. P < .05 was considered significant.
dPrevious HIV-positive infections were self-reported.
eComparing previous HIV infection with new HIV infection, across agencies.
f“In care” was defined as evidence of a viral load value in the Enhanced HIV/AIDS Reporting System (eHARS) in the 12 months before the date of the HIV-positive test among those with previously diagnosed HIV infection.
gComparing “in care” with “out of care” among those with previous HIV infection.
h“Out of care” was defined as no evidence of a viral load value in eHARS in the 12 months before the date of the HIV-positive test among those with previously diagnosed HIV infection.
i“Reengaged in care” was defined as evidence of a viral load value in eHARS within 9 months after the date of the HIV-positive test among those with previously diagnosed HIV infection who were out of care.
jComparing “lost to care” with “reengaged in care” among those with previous HIV infection and “out of care.”
k“Lost to care” was defined as no evidence of a viral load value in eHARS within 9 months after the date of the HIV-positive test among those with previously diagnosed HIV infection who were out of care and among those with newly diagnosed HIV infection.
l“Linked to care” was defined as evidence of a viral load value in eHARS within 9 months after the date of the HIV-positive test among those with newly diagnosed HIV infection.
mComparing “linked to care” with “lost to care” among those with new HIV infection.
Of the 78 previously diagnosed participants, 31 (39.7%) were engaged in care and 47 (60.3%) were out of care. We found no significant difference in the percentage of previously diagnosed participants who were in care and out of care by agency. All 47 participants who were previously diagnosed and out of care were referred for reengagement in care; 27 (57.4%) were reengaged in care and 20 (42.6%) were lost to care (Table 2).
Of the 80 newly diagnosed participants, 36 (45.0%) were lost to care and 44 (55.0%) were linked to care. Of newly diagnosed participants, 32 (40.0%) were linked to care <1 month after HIV diagnosis, 8 (10.0%) 1 to <3 months after diagnosis, and 4 (5.0%) 3-9 months after diagnosis. Linkage to care did not differ significantly by agency: 73.9% at agency 1, 46.2% at agency 2, and 50.0% at agency 3 (P = .09; Table 2).
The goal for the total number of tests conducted (n = 2700) was not met. The SNS program surpassed the goal of ≥5% HIV positivity overall (9%), at agency 1 (13%), and at agency 2 (8.6%); however, agency 3 fell short of the goal (4.5%). The goal of ≥80% linked to care among newly diagnosed participants was neither met by the SNS program overall nor by any of the agencies, although agency 1 came close to meeting the goal (73.9%; Table 3).
Social network strategy programa goals and results for HIV testing as part of the CAPUS Demonstration Project,b overall and by agency, Tennessee, June 2013–June 2016
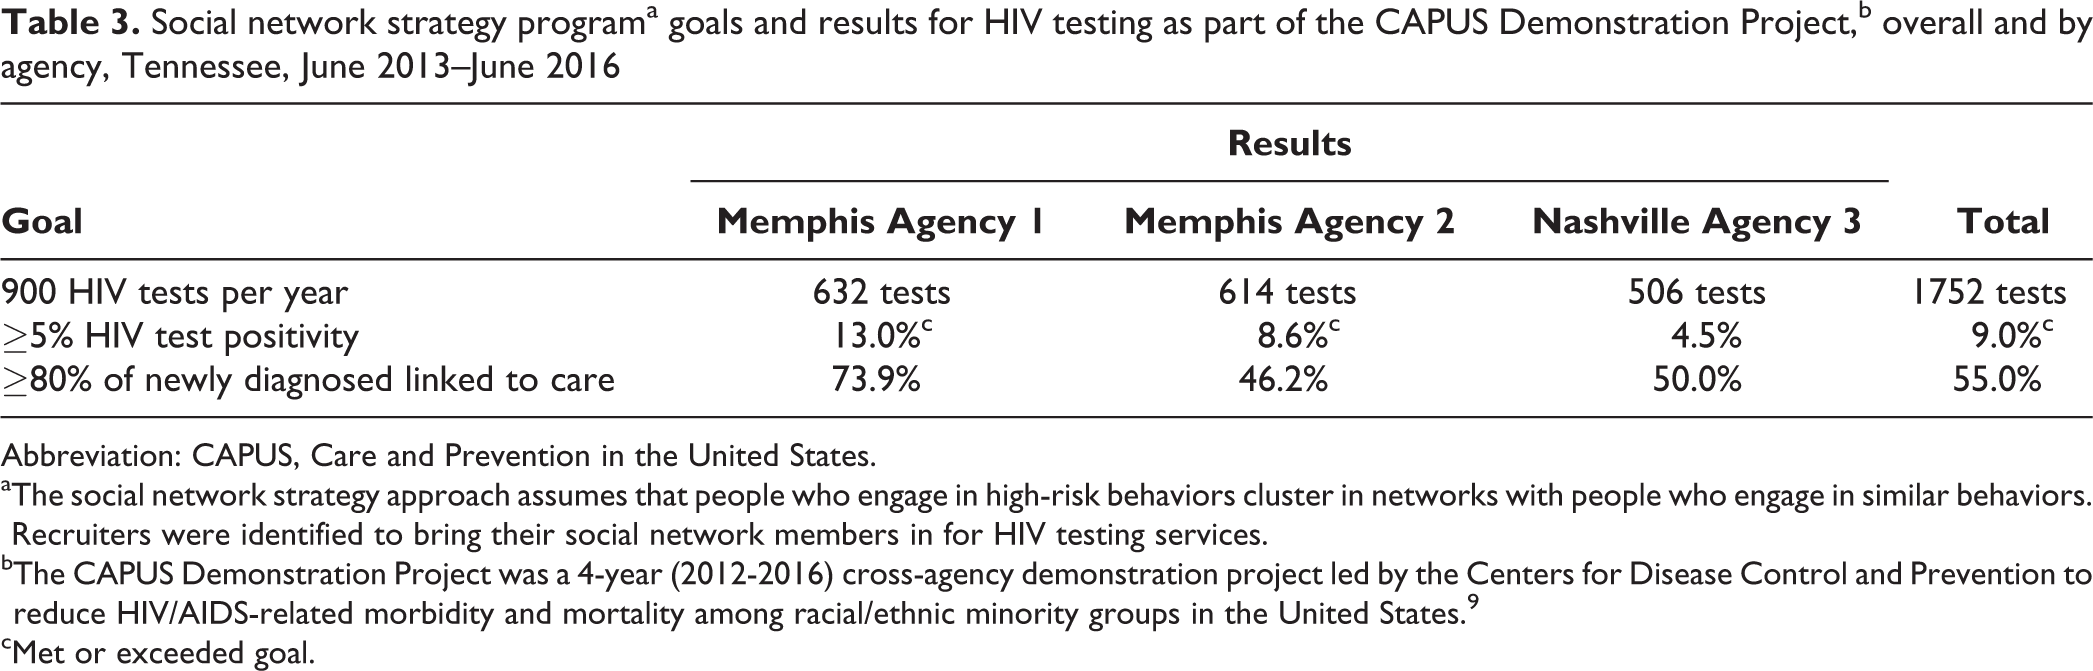
Abbreviation: CAPUS, Care and Prevention in the United States.
aThe social network strategy approach assumes that people who engage in high-risk behaviors cluster in networks with people who engage in similar behaviors. Recruiters were identified to bring their social network members in for HIV testing services.
bThe CAPUS Demonstration Project was a 4-year (2012-2016) cross-agency demonstration project led by the Centers for Disease Control and Prevention to reduce HIV/AIDS-related morbidity and mortality among racial/ethnic minority groups in the United States. 9
cMet or exceeded goal.
Discussion
Evidence of SNS program efficiency in Tennessee was the surpassed goal of ≥5% HIV test positivity. Previous SNS programs from 2003-2009 in cities such as Boston, New York, Orlando, San Francisco, and Seattle reported varying rates of HIV positivity, although not all evaluations of SNS programs differentiated results of participants with previously diagnosed HIV from participants with newly diagnosed HIV. 10,26,28 -31 For example, an SNS program in New York City reported 19.3% HIV positivity but did not distinguish participants with previously diagnosed HIV from participants with newly diagnosed HIV. 28 Another evaluation of SNS program results from Philadelphia, Boston, and Washington, DC, found percentages of HIV-positive test results ranging from 4.4% to 9.8% for participants with newly diagnosed HIV. 31 The percentage of HIV positivity in our study dropped from 9.0% to 4.6% when considering only participants with newly diagnosed HIV. However, identifying participants with previously diagnosed HIV offered an opportunity for reengagement in care. More than half of participants who were previously diagnosed with HIV but out of care for ≥12 months were reengaged in care via the SNS program in Tennessee.
Agency 1 had a higher percentage of HIV positivity than agency 2 or agency 3, which was likely related to the higher proportion of participants with previously diagnosed HIV than participants with newly diagnosed HIV. In a study conducted in New York in 2011 on a similar HIV testing strategy, other factors affecting HIV-positivity rates included differences in background HIV incidence in the region and in the target population of young non-Hispanic black MSM and differences in recruitment methods used. 26 Importantly, SNS programs, including the program in Tennessee, had higher percentages of participants with newly diagnosed and previously diagnosed HIV than all CDC-funded HIV testing programs overall (<1%), which attests to their effectiveness. 32 Within the Tennessee Department of Health, the SNS program had the highest percentage of total HIV positivity of any HIV testing initiative (unpublished data, Tennessee Department of Health, HIV/STD/Viral Hepatitis Section, 2016).
Our SNS program did not meet goals for the number of HIV tests conducted and the proportion of participants with newly diagnosed HIV who were linked to care. Few previous SNS program evaluations reported linkage to care for people with newly diagnosed HIV. One study reporting SNS program results from 7 US cities reported linking 63% of people newly diagnosed with HIV to care. 26 However, the length of follow-up used to assess linkage to care was not clear. In our study, participants were followed for 9 months, and the proportion linked to care likely would have increased with a longer follow-up time. Notably, only 40% of participants with newly diagnosed HIV in our study were linked to care within 1 month. Overall, linkage to care rose to only 55% by 9 months after HIV diagnosis. This percentage was lower than the National HIV/AIDS Strategy goal of 85% linkage within 1 month after HIV diagnosis. 8 Linkage outcomes could be improved by identifying barriers to linkage to care beyond lack of knowledge of an HIV test result, such as lack of social services (eg, drug and alcohol treatment, food stamps, housing support), poor health care provider relationships, narrow options for accessing health care and social services (eg, lack of access to community-based social service organizations), criminalization of HIV and/or immigration status, poor affect (eg, negative emotions, poor self-concept), decreased resilience or ability to respond effectively to stressors, and perceived stigma (ie, feelings of discrimination or being assigned an inferior status by others). 33,34
Although the number of tests conducted did not differ significantly by agency, agency 1 had a higher proportion of newly diagnosed participants who were linked to care within 9 months than agency 2 or agency 3. In fact, agency 1 came close to meeting the goal of ≥80% linkage. This agency also had the highest network index (15.4). The overall network index in the evaluation was consistent with other SNS program evaluation findings. One evaluation of sites reported similar findings of varying network indices by site, with an overall network index of 8.9 (range, 5.1 to 19.4). 31 Anecdotally, agency 1 relied heavily on social media to recruit participants. Further program evaluation is needed to identify characteristics of this high-efficiency agency that could inform future SNS program efforts.
Limitations
This study had several limitations. First, it is possible that we achieved saturation through our methods to identify young high-risk black MSM, thereby exhausting social networks of the priority population and obtaining fewer new diagnoses of HIV infection. Second, staffing turnover in Memphis (agency 1 and agency 2) led to a loss of SNS operations knowledge as staff members departed and operational delays as new SNS staff members were trained. However, new staff members provided access to new social networks, new recruiters, and new network associates, which extended the reach of SNS activities. Third, we did not collect data on recruitment strategies used by each recruiter; as such, we were unable to determine the effectiveness of particular recruitment methodologies.
Conclusions
Poverty, low levels of access to health care in rural areas, racial/ethnic discrimination, and stigma are notable determinants of health in the South that may make implementation of SNS programs more challenging and less likely to succeed among black MSM there than in other regions of the country with less endemic poverty, greater access to health care, less discrimination, and less perceived stigma. 35 The SNS program was a successful tool for testing young black MSM for HIV and can be a more cost-effective way to reach this population than by using traditional clinical or nonclinical HIV testing programs. Further SNS program evaluation is needed to help identify effective strategies to meet goals for additional SNS program efforts. Future work should focus on the characteristics of sites with high network indices, individual-level data on recruitment methods, and detailed data on costs.
Footnotes
Authors’ Note
Shanell L. McGoy and April C. Pettit contributed equally to the article and are co-first authors.
Acknowledgments
The authors acknowledge the following Care and Prevention in the United States (CAPUS) federal site team members: Jonny Andia, Dwayne Banks, Veronica McCants, Mesfin Mulatu, Cynthia Prather, and Kim Williams (Centers for Disease Control and Prevention [CDC]); Wendy Briscoe (Health Resources and Services Administration); Kim Thierry English (Substance Abuse and Mental Health Services Administration); and Timothy Harrison (Office of HIV/AIDS and Infectious Disease Policy).
The authors also acknowledge the following local site team members: Marcus Banks, Cillini Crump, Anthony Green, and Jimmy Lenson; and Tennessee Department of Health site team members: Elizabeth (Betsy) Cashen, David K. Fields, Dana Hughes, Detrell Southall, and Kimberly Truss.
Declaration of Conflicting Interests
The authors declared no potential conflicts of interest with respect to the research, authorship, and/or publication of this article.
Funding
The authors disclosed receipt of the following financial support for the research, authorship, and/or publication of this article: CAPUS (PS12-1210) was supported by the US Department of Health and Human Services Secretary’s Minority AIDS Initiative Fund and led by CDC (5U62PS003947). This work was also supported by the National Institutes of Health (Tennessee Center for AIDS Research P30-AI110527; Rebeiro, K01-AI131895; and Pettit, R01-MH113438).