
Abstract
Objectives:
Following a surge in fall-related visits to local hospital emergency departments (EDs) after a severe ice storm, the Philadelphia Department of Public Health examined the association between inclement winter weather events and fall-related ED visits during a 5-year period.
Methods:
Using a standardized set of keywords, we identified fall-related injuries in ED chief complaint logs submitted as part of Philadelphia Department of Public Health’s syndromic surveillance from December 2006 through March 2011. We compared days when falls exceeded the winter fall threshold (ie, “high-fall days”) with control days within the same winter season. We then conducted matched case-control analysis to identify weather and patient characteristics related to increased fall-related ED visits.
Results:
Fifteen high-fall days occurred during winter months in the 5-year period. In multivariable analysis, 18- to 64-year-olds were twice as likely to receive ED care for fall-related injuries on high-fall days than on control days. The crude odds of ED visits occurring from 7:00
Conclusions:
The association between the number of fall-related ED visits and weather-related fall injuries, age, and timing suggests that many events occurred en route to work in the morning. Promoting work closures or delaying openings after severe winter weather would allow time for better snow or ice removal, and including “fall risk” in winter weather advisories might effectively warn morning commuters. Both strategies could help reduce the number of weather-related fall injuries.
Public health messages about winter weather usually focus on preventing hypothermia and frostbite, promoting automobile safety, and cautioning against physical strain from snow and ice removal; however, little is said about the increased risk of injuries from slippery sidewalks and walkways. 1,2 Lack of attention to this weather-related risk is surprising because previous studies found that 56% to 74% of winter storm-related injuries result from slipping or falling on snow or ice. 3 –5 The economic cost of these injuries, 6 –10 the increased burden on hospital emergency department (ED) staff members and resources, 4,10 –12 and the potential long-term sequelae of fall-related injuries, especially for the elderly, 9,13 should make decreasing fall-related injuries during winter storms a priority for public health agencies.
On February 1, 2011, 2 ice storms—1 in the early morning and 1 in the evening—hit southeastern Pennsylvania, causing major power outages and transit delays. The next day, the Centers for Disease Control and Prevention’s automated surveillance system, BioSense, alerted the Philadelphia Department of Public Health (PDPH) of an increase in fall-related visits to 1 local hospital ED. 14 PDPH routinely monitors ED visit data for increases in communicable disease syndromes, such as respiratory illness, diarrhea, and rash, but does not monitor increases in injury-related visits, unless otherwise indicated. Spurred by the Centers for Disease Control and Prevention alert, PDPH investigated ED activity at other hospitals and identified a citywide increase in fall-related patient visits after the ice storm.
This study assessed whether inclement winter weather events were associated with increases in fall-related ED visits during a 5-year period. Although previous studies examined fall injuries related to a particular storm or season, none determined the risk for fall-related injuries in 1 location during a period of several years. We determined the risks for ED visits associated with falls, populations most affected, and timing of ED visits for falls during a 5-year period in Philadelphia. We also analyzed the relationships between weather characteristics (eg, temperature and precipitation) and fall-related ED visits.
Methods
Injury Data Source
Since 2002, PDPH has conducted syndromic surveillance on the volume and type of ED visits to rapidly detect unusual or clustered diseases, to monitor seasonal epidemics such as influenza, and to identify abnormal health situations. De-identified patient visit data are transmitted electronically to PDPH daily, where they are aggregated and analyzed for aberrations over space and time. We searched chief complaints for keywords such as “fall,” “fell,” “slip,” or “tumble” to identify fall-related ED visits occurring during the winter months (December, January, February, and March) from December 1, 2006, to March 31, 2011, at 21 Philadelphia-area hospitals. Patient demographic characteristics (age, sex, and residential ZIP code) and ED visit details (hospital name, location, and date/time of visit) were available for these visits. The PDPH Institutional Review Board determined this study to be exempt from review.
Determining High-Fall Days and Control Days
We recorded the number of fall-related ED visits for each 24-hour period from December 1, 2006, to March 31, 2011. We labeled all days in December, January, February, and March as winter dates. We calculated the overall median of daily fall-related visits for winter dates. We defined days exceeding this median by >3 SDs as high-fall days. Matched control days consisted of the same days of the week (eg, Monday, Tuesday) as the high-fall days from the same winter (16 to 17 control days per high-fall day).
Data on Weather
Because previous studies suggested that injuries peak 4 to 6 days after inclement weather, we reviewed the National Oceanic and Atmospheric Administration’s National Climactic Data Center website 15 for weather events (eg, snow, rain, or fog) in the 6 days before our study days 3,16,17 and recorded onset dates of specific weather events (eg, storms). For each identified storm, we collected temperatures (daily minimums, maximums, and averages) and event descriptions from the Weather Underground website. 16 If we identified multiple storm events, we used the event closest to the study day. When weather events spanned multiple days, we used daily average temperatures; for periods without events, we used a 6-day average. We categorized event descriptions into dichotomous variables as presence or absence of snow, rain, or fog.
Model Building
We calculated odds ratios and 95% CIs to determine the crude association between high-fall days and patient and weather characteristics using conditional logistic regression analysis. We developed 2 multivariable adjusted models—1 that explored and adjusted for visit and patient characteristics, such as time of visit and patient sex and age, and 1 that examined and adjusted for daily weather characteristics, such as minimum and maximum temperatures and the presence or absence of snow, rain, or fog. For mapping, we calculated age-specific residential ZIP code rates of fall-related ED visits. We analyzed data using SAS/STAT version 9.3. 18 We calculated P values using the Wald χ 2 test.
Results
Syndromic surveillance recorded 4 988 958 ED visits for the 5-year study period, of which 185 385 (3.7%) were related to falls. During the winter months, the median number of daily fall-related visits was 98 (SD = 31). We identified 15 dates as high-fall days (Figure 1). High-fall days were more likely to occur on a weekday (n = 13) than on a weekend (n = 2; P < .001).
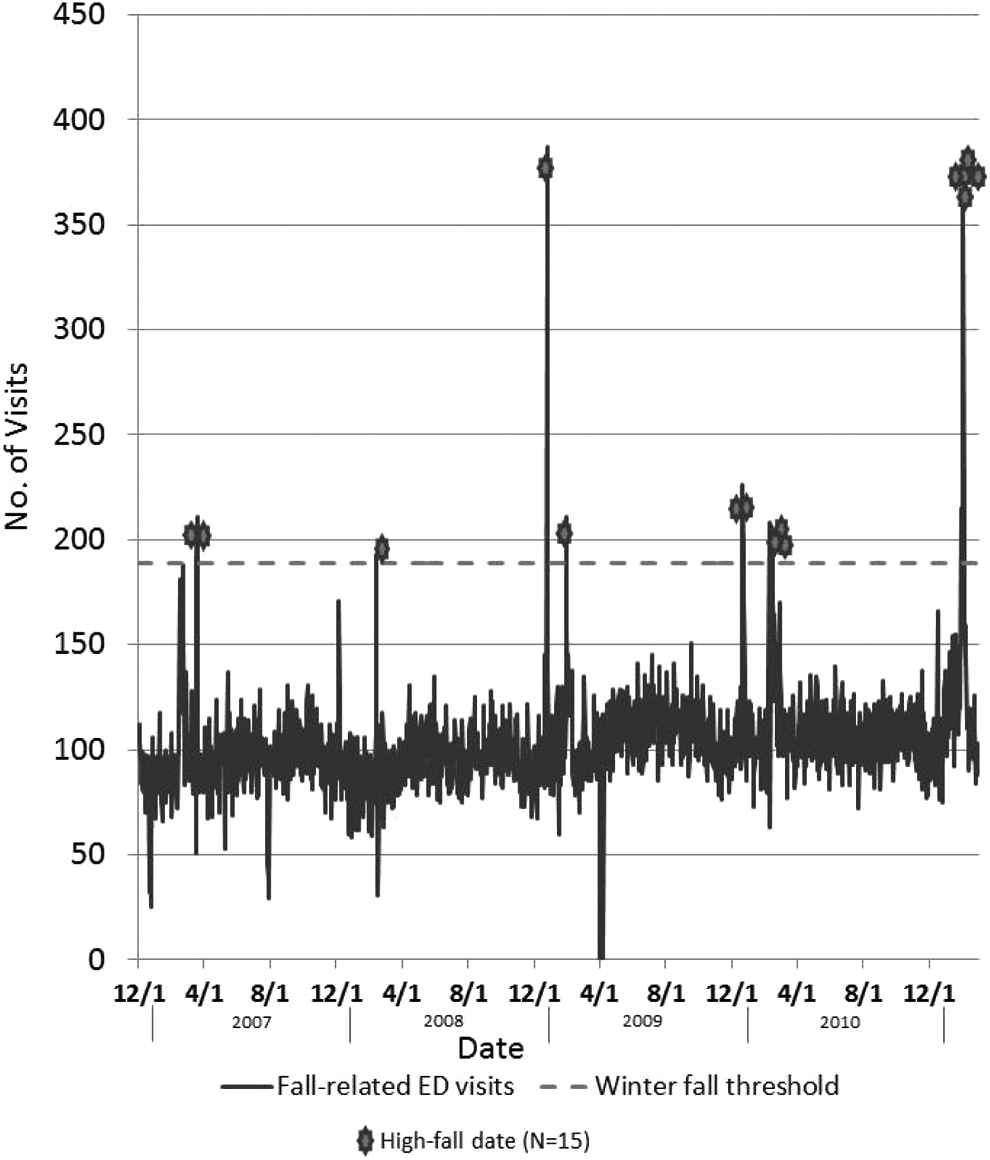
Fall-related emergency department (ED) visits identified through syndromic surveillance of 21 hospitals, Philadelphia, Pennsylvania, 2006-2011. The fall-related ED visit threshold for winter (n = 189) that was used to identify high-fall dates was calculated as the median number of fall-related visits per day during winter months (December through March) plus 3 SDs. Unpublished patient registration data came from 21 hospital EDs throughout the Philadelphia area, collected as part of routine public health syndromic surveillance.
The average number of daily fall-related visits was higher on high-fall days (n = 231; 95% CI, 198-264) than on control days (n = 106; 95% CI, 100-112). The odds of fall-related ED visits for adults aged 18-64 was >2 times higher (adjusted odds ratio [aOR] = 2.2; 95% CI, 2.0-2.5) on high-fall days than on control days (Table 1). Those aged ≥65 also had a slightly elevated fall risk on high-fall days vs control days (aOR = 1.2; 95% CI, 1.0-1.5). The fall risk for children (aged <18) was low. We observed no significant increase in risk for fall-related injuries on weather-related high-fall days for this age group. Fall-related ED visits occurring between 7:00
Characteristics of patients visiting the ED for falls on high-fall and control days, after winter weather events, based on syndromic surveillance data, Philadelphia, Pennsylvania, 2006-2011a
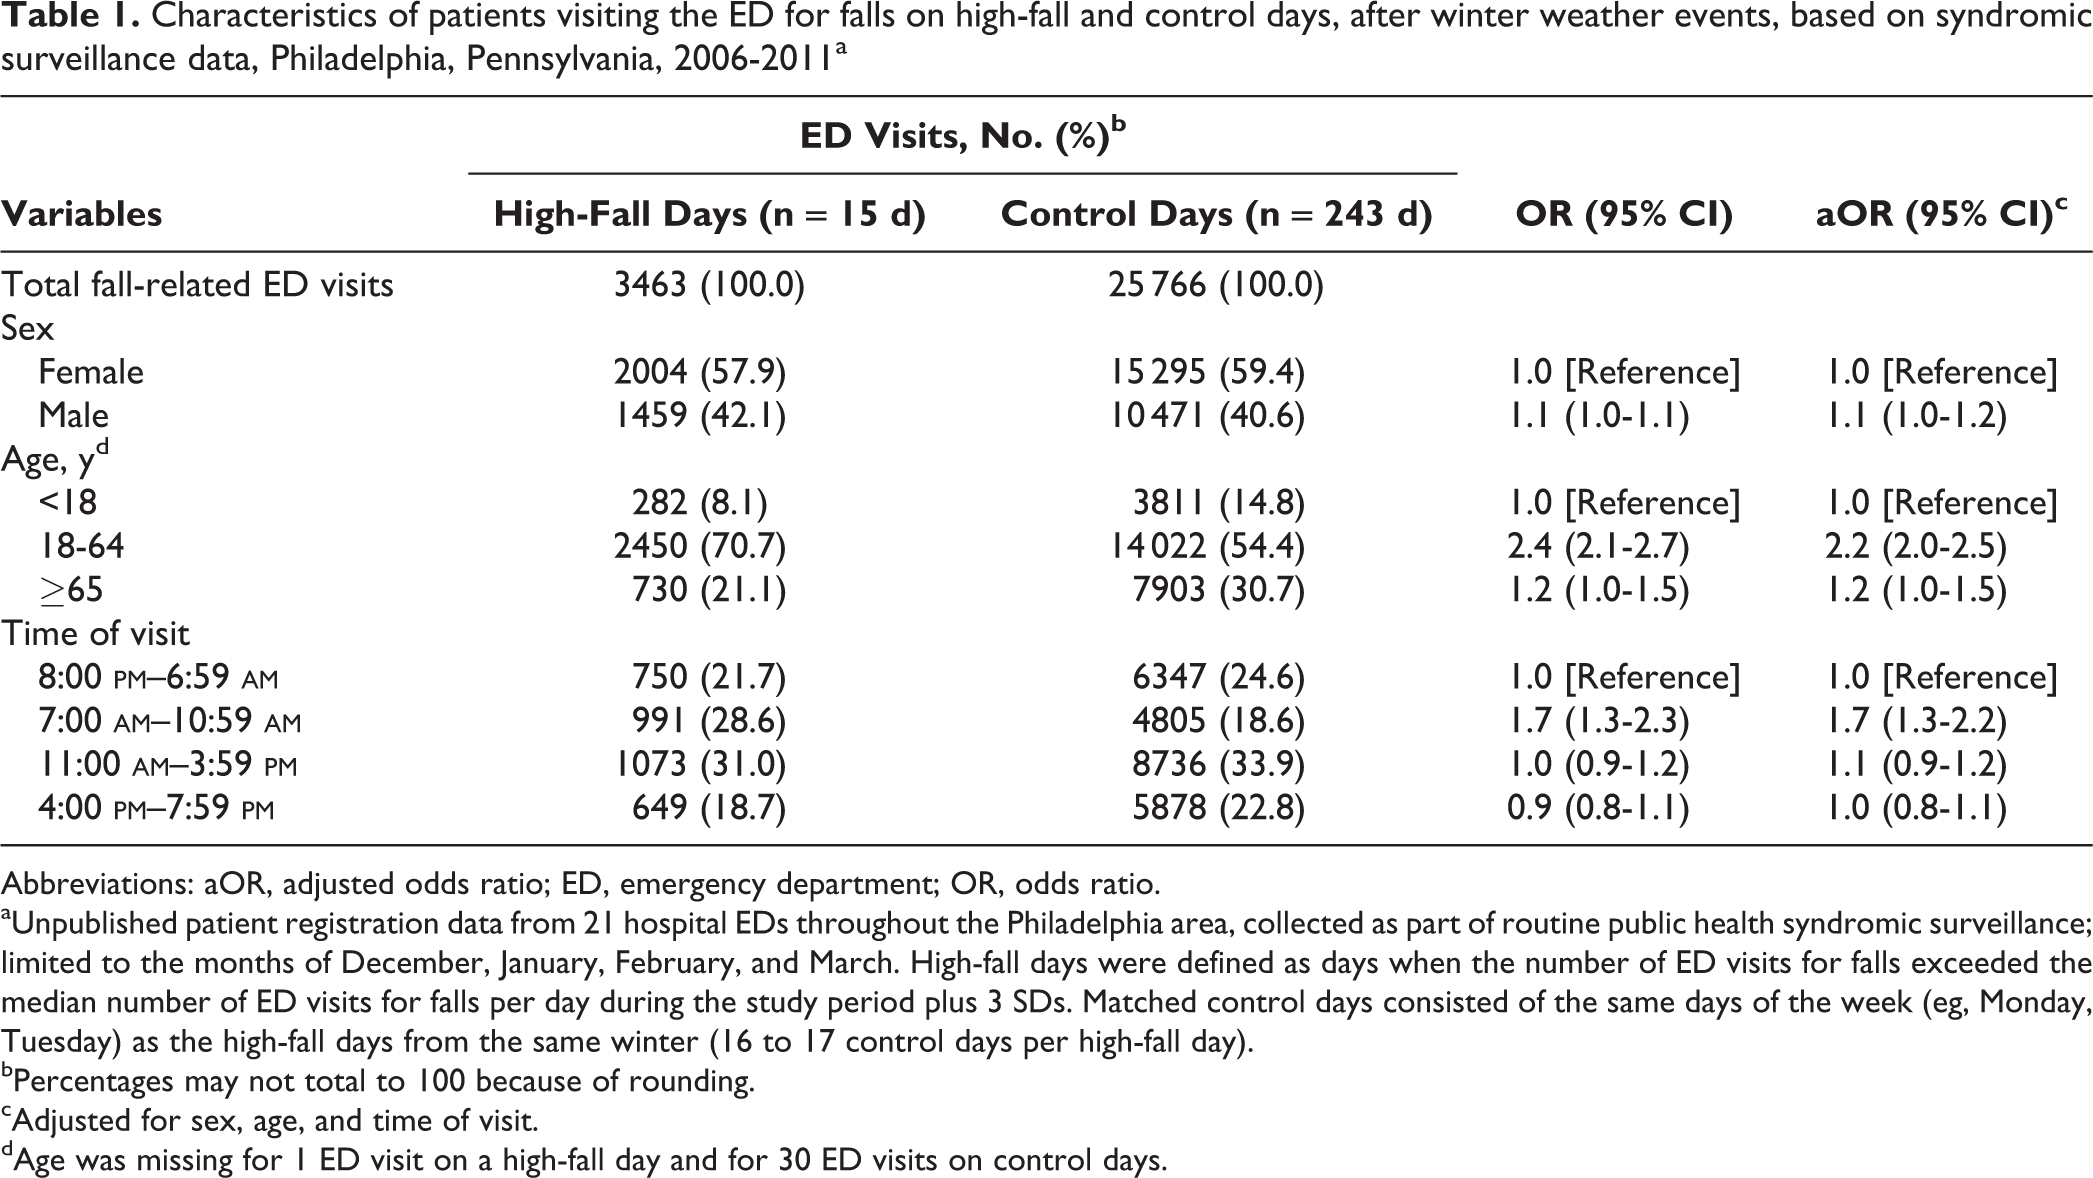
Abbreviations: aOR, adjusted odds ratio; ED, emergency department; OR, odds ratio.
aUnpublished patient registration data from 21 hospital EDs throughout the Philadelphia area, collected as part of routine public health syndromic surveillance; limited to the months of December, January, February, and March. High-fall days were defined as days when the number of ED visits for falls exceeded the median number of ED visits for falls per day during the study period plus 3 SDs. Matched control days consisted of the same days of the week (eg, Monday, Tuesday) as the high-fall days from the same winter (16 to 17 control days per high-fall day).
bPercentages may not total to 100 because of rounding.
cAdjusted for sex, age, and time of visit.
dAge was missing for 1 ED visit on a high-fall day and for 30 ED visits on control days.
For the 6 days preceding the study days, all 15 high-fall days and 100 of 243 (41%) control days had a weather event. Compared with snow preceding control days, high-fall days had proportionally more days preceded by snow (12 of 15 vs 37 of 100; P = .002; Table 2) and higher average recorded precipitation (0.7 in [95% CI, 0.3-1.1] vs 0.1 in [95% CI, 0.1-0.2]). Regardless of study day type, weather events occurred a median of 2 days before ED visit days (range: 0-5). Many weather characteristics were associated with fall-related ED visits in the unadjusted models, but only snow was associated in the adjusted model (aOR = 13.4; 95% CI, 2.9-61.5).
Weather conditions on high-fall days in EDs compared with control days, Philadelphia, Pennsylvania, 2006-2011a

Abbreviations: aOR, adjusted odds ratio; ED, emergency department; OR, odds ratio.
aUnpublished patient registration data from 21 hospital EDs throughout the Philadelphia area, collected as part of routine public health syndromic surveillance; limited to the months of December, January, February, and March. High-fall days were defined as days when the number of ED visits for falls exceeded the median number of ED visits for falls per day during the study period plus 3 SDs. Matched control days consisted of the same days of the week (eg, Monday, Tuesday) as the high-fall days from the same winter (16 to 17 control days per high-fall day).
bAdjusted for temperature categories and presence of snow, rain, or fog.
On control days, the fall-related ED visit rate per 100 000 population for adults aged 18-64 for the 47 Philadelphia ZIP codes never exceeded 12.7, whereas on high-fall days, more than half of the ZIP codes had >12.7 fall-related ED visits per 100 000 population for this age group. Moreover, the rate of fall-related ED visits for adults aged 18-64 exceeded the rate for those aged ≥65 in 51% of ZIP codes on high-fall days but in only 8% of ZIP codes on control days (Figure 2).
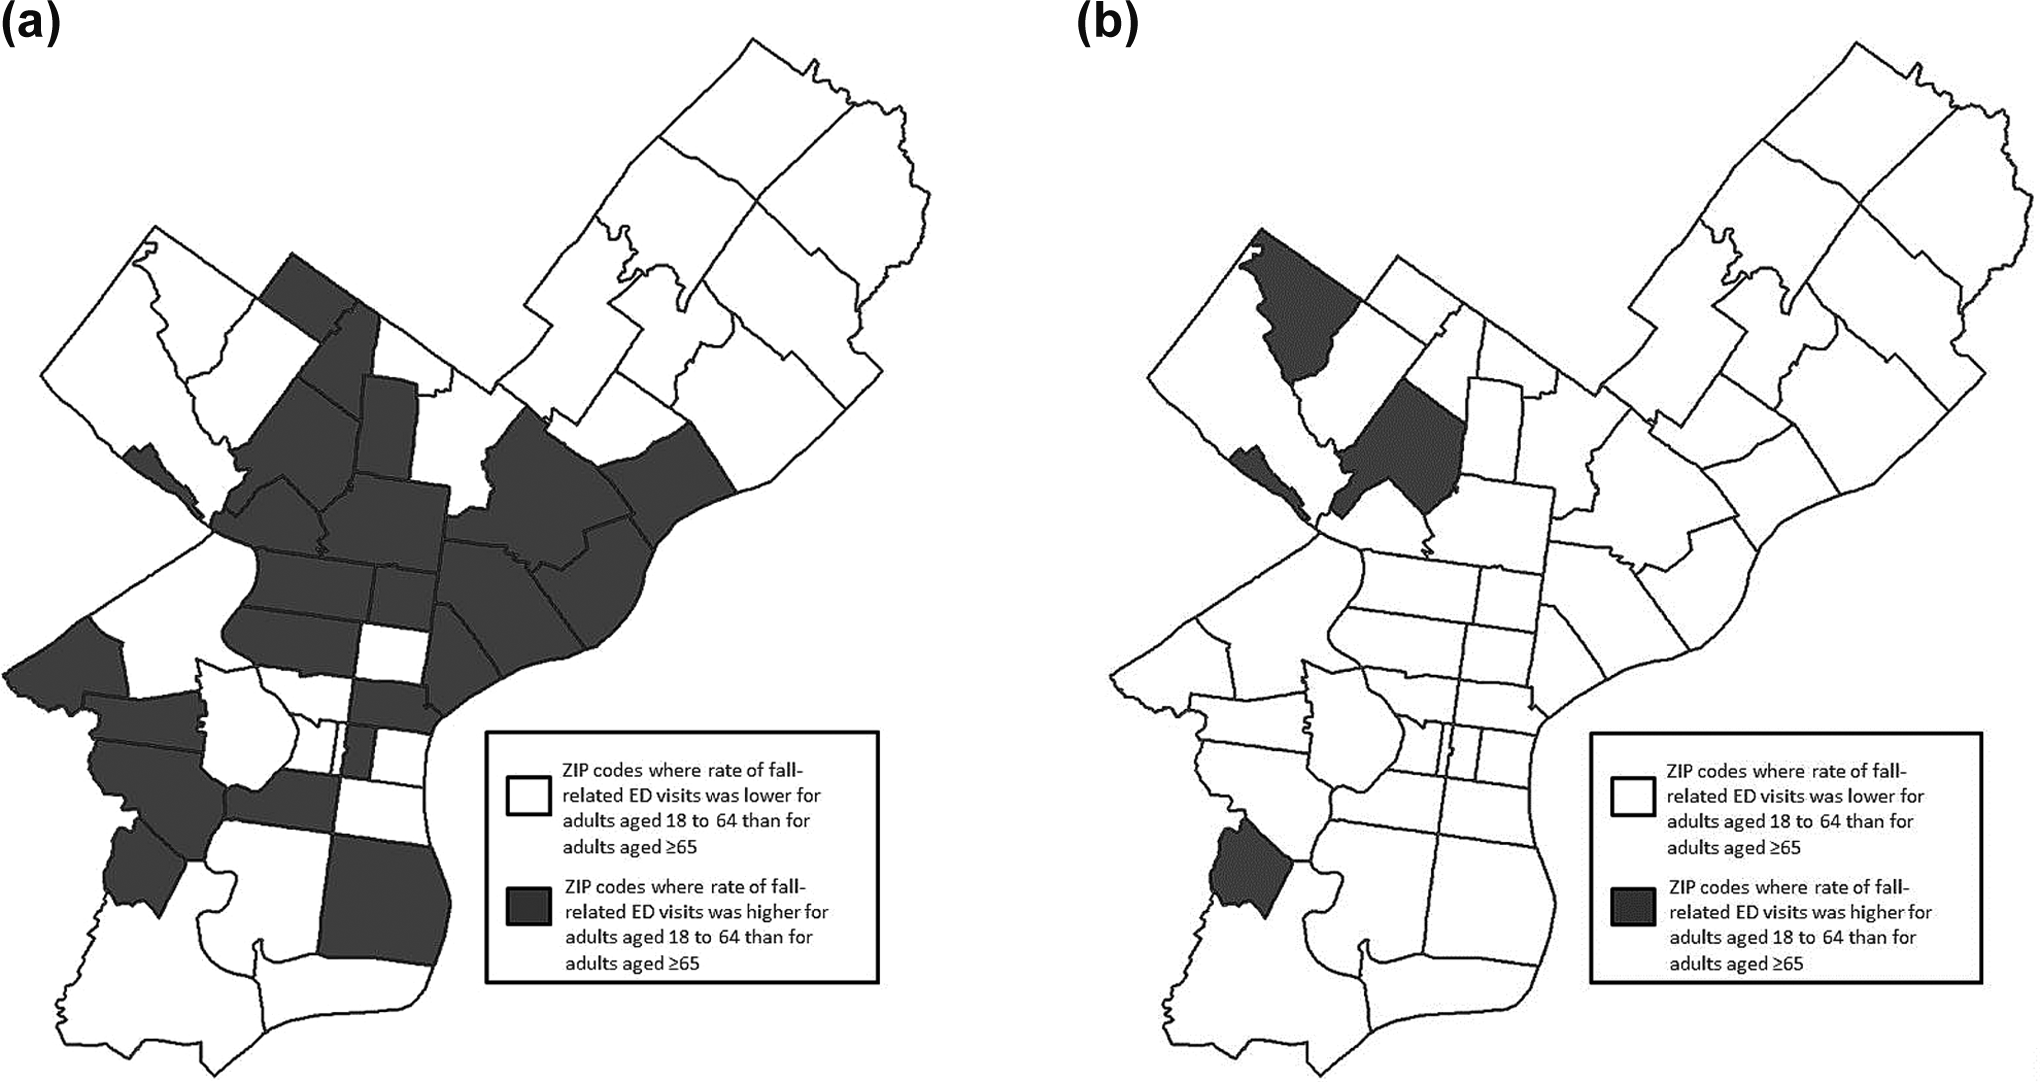
a, Geographic distribution of patient home ZIP codes for fall-related emergency department (ED) visits after a winter weather event during winter months (December through March), Philadelphia, Pennsylvania, 2006-2011. Unpublished patient registration data came from 21 hospital EDs throughout the Philadelphia area, collected as part of routine public health syndromic surveillance. b, Geographic distribution of patient home ZIP codes for fall-related ED visits not associated with winter weather events (control days) during winter months (December through March), Philadelphia, Pennsylvania, 2006-2011. Unpublished patient registration data came from 21 hospital EDs throughout the Philadelphia area, collected as part of routine public health syndromic surveillance.
Discussion
The identified association between inclement weather and fall-related ED visits is not surprising. Other studies documented an increase in traumatic injuries after snow or ice storms, 17,19,20 and falls were the most common cause. 4 In our study, nearly 8% of all ED visits on high-fall days were related to falls, which was approximately twice as many as on control days. These findings were consistent across all storms studied during 5 winter seasons. We observed a similar prevalence of fall-related ED visits after winter storms as did a national ED surveillance system during a single season. 14
Our study augments current knowledge about weather-related falls by also determining risks by age and timing of the falls. Notably, we observed the greatest increase in risk for falling for adults aged 18-64 and for the period of 7:00
Weather-related fall injuries can burden hospital EDs. ED staff members may not be able to manage the surge in visits or be prepared for the type or severity of injuries. Murray et al compared the increased ED workload during periods of snow and ice to a “major accident” or “moderate disaster.” 12 We found that after storm events, fall-related ED visits more than doubled and the proportion of total ED visits attributable to falls more than tripled. Although most EDs have some surge capacity to deal with increased patient volume, the extent of the demand after these weather events was likely taxing. Other studies found high rates of hospitalization and serious injuries after weather-related falls: >8% of all patients admitted for fall-related injuries in a 2007 Oklahoma ice storm were hospitalized, 5 and 4 of 23 reported deaths in a 2002 ice storm in North Carolina were attributed to slips or falls. 21
Fall-related ED visits are also costly, and the costs of weather-related falls can be measured in terms of health care dollars and victim harm. In Finland, an estimated $53 million in health care costs is spent annually because of slipping on streets or sidewalks. 8 In England, the inpatient cost for falls during the 2009-2010 winter season was £42 million. 10 Other associated costs include nonadmission medical expenses, use of work leave, and stays in nursing homes. In the United States, the average cost for a fall-related injury includes $19 672 for the hospitalization and $35 628 for lost work. 22
Our findings suggest that using weather conditions in a predictive model for adverse health outcomes could be useful. Models to forecast the total number of ED visits have had mixed results. Some found that adding meteorologic data had little or no effect on improving predictions of ED visit counts. 23,24 In fact, Holleman et al found that snowfall actually decreased the number of visits to a rural Kentucky Veterans Affairs Medical Center. 24 Similarly, a study from Minnesota found a correlation between precipitation and fewer ED admissions, although the same effect was not seen with snow. 25 Other studies observed that low temperatures and precipitation predicted increases in trauma admissions and fall-related ED visits, by 60% to 78% in the hourly trauma admissions rate. 10,11,26
Limitations
This study had several limitations. First, we were unable to restrict the analysis to known weather-related falls because we included all fall-related ED visits in our analysis, regardless of whether snow or ice was mentioned in the chief complaint field. The imprecise capture of weather-related falls could increase or decrease the total number of fall-related visits but would not differentially increase the number of fall-related visits on high-fall days. Similarly, because fall-related visits were identified by using keywords such as “fall” and “fell” from patient chief complaint logs, non–weather-related chief complaints such as “a slot machine fell on me last night” may have been included in the analysis. However, these complaints constituted such a small percentage of total complaints that we considered them insignificant in terms of the analysis. If patients did not go to the ED immediately after a fall, then the commuter effect could have been overstated; however, it would be unlikely that most patients delayed visits or would delay visits differentially between high-fall and control days. Additionally, we did not know the locations of falls but rather the residential ZIP codes. Knowing the exact fall sites would have helped us better assess a commuter effect and potentially identify high-risk locations to target for prevention activities. Furthermore, we did not have information on the type or severity of injuries sustained, which also could have helped with prevention messaging. The data used in our study did not include injury outcome, so we could not determine the proportion of cases requiring hospitalization or surgical intervention. Finally, we based weather measurements on the city centroid, which did not allow for assessment of variability across the city.
Conclusions
Because the highest relative increase in fall-related ED visits occurred among the working-age population (adults aged 18-64) and during the morning commute (7:00
Footnotes
Declaration of Conflicting Interests
The authors declared no potential conflicts of interest with respect to the research, authorship, and/or publication of this article.
Funding
The authors received no financial support for the research, authorship, and/or publication of this article.