
Abstract
Objectives:
Government public health expenditure data sets require time- and labor-intensive manipulation to summarize results that public health policy makers can use. Our objective was to compare the performances of machine-learning algorithms with manual classification of public health expenditures to determine if machines could provide a faster, cheaper alternative to manual classification.
Methods:
We used machine-learning algorithms to replicate the process of manually classifying state public health expenditures, using the standardized public health spending categories from the Foundational Public Health Services model and a large data set from the US Census Bureau. We obtained a data set of 1.9 million individual expenditure items from 2000 to 2013. We collapsed these data into 147 280 summary expenditure records, and we followed a standardized method of manually classifying each expenditure record as public health, maybe public health, or not public health. We then trained 9 machine-learning algorithms to replicate the manual process. We calculated recall, precision, and coverage rates to measure the performance of individual and ensembled algorithms.
Results:
Compared with manual classification, the machine-learning random forests algorithm produced 84% recall and 91% precision. With algorithm ensembling, we achieved our target criterion of 90% recall by using a consensus ensemble of ≥6 algorithms while still retaining 93% coverage, leaving only 7% of the summary expenditure records unclassified.
Conclusions:
Machine learning can be a time- and cost-saving tool for estimating public health spending in the United States. It can be used with standardized public health spending categories based on the Foundational Public Health Services model to help parse public health expenditure information from other types of health-related spending, provide data that are more comparable across public health organizations, and evaluate the impact of evidence-based public health resource allocation.
The primary sources of government expenditure data are reports by state and local governments, which provide detailed information about spending items and categories. Large government public health expenditure data sets frequently require time- and labor-intensive manipulation to summarize results that public health policy makers can use. As a result, measuring public health spending in the United States often requires a lengthy, detailed evaluation and classification of expenditure data.
This process has the potential to be performed with greater speed and consistency and at a lower cost by using machine-learning approaches. Machine learning involves the application of statistical modeling to groups of complex alphanumeric descriptive data to distribute the data into their appropriate classifications. Machine learning is already being used in biomedical fields for data classification and has been shown to provide consistent, cost-effective solutions, particularly for handling large data sets. 1
States have provided government expenditure data to the US Census Bureau annually since the mid-20th century. By the late-1990s, most states were reporting these data to the Census Bureau digitally; by the 2000-2010 period, all states except California were doing so. California still does not submit these data to the Census Bureau; as such, the bureau has had to obtain data from other California state budget documents to create national estimates. 2
The Census Bureau collects state government expenditure data through its Governments Division in the Annual Survey of State Government Finances, which includes line-by-line descriptions of expenditures and the activities associated with them, producing massive data sets. 2 Public health spending falls within the nonhospital health expenditure category, which encompasses spending on traditional public health activities (eg, disease surveillance and outbreak control) as well as activities not typically considered part of public health, including community health, mental health, and emergency medical services.
The Centers for Medicare & Medicaid Services (CMS) uses US Census Bureau data to create the National Health Expenditure Accounts public health activities spending estimates, which are part of the official estimates of all health care spending in the United States. However, CMS does not disaggregate the Census Bureau’s nonhospital health expenditure estimate into public health versus other health spending areas. By using these aggregated data without breaking them down into their component parts, the CMS public health activities spending estimates may be substantially inflated. 3 So, although the official US estimate for governmental public health spending was stated as $75 billion for 2013, third parties have estimated that number to be as low as $25 billion to $40 billion. 4 This variation in estimates points out the need for more granular and accurately parsed data to estimate US public health expenditures.
The inconsistencies among estimates also raise questions about standardization of public health spending data, a subject that is particularly relevant now in a national context of important changes in public health finance evaluation and standards. 5 –7 For example, a 2012 Institute of Medicine (IOM) report noted the relative lack of capacity for practitioners and researchers to compare health department expenditures by state. 8 This lack of capacity appeared to be related to the various accounting systems and reporting requirements in states and agencies throughout the country. The IOM called for developing a system that would index each public health agency’s chart of accounts to a uniform chart of accounts, which would allow for more precise comparisons of public health spending among health departments nationwide. 9 Such comparisons would, in turn, allow for better evaluation of the effectiveness of public health spending and promote the use of evidence-based resource allocation.
The IOM report also spurred creation of the Foundational Public Health Services (FPHS) model, which includes a list of minimum public health protections (ie, foundational areas and foundational capabilities) that should be available to anyone living in the United States and that serves as a framework by which public health expenditures could be categorized. 10,11 Foundational areas include substantive areas of expertise with program-specific activities in all state and local health departments necessary to protect the health of communities (eg, communicable disease, maternal child health). Foundational capabilities are cross-cutting skills needed in state and local health departments for the public health system to work and essential skills or capacities to support all public health activities (eg, communication, surveillance). 11 The use of public health spending categories in the FPHS model and the uniform chart-of-accounts system would go a long way toward producing more standardized and granular public health expenditure data. Moreover, the addition of machine learning as a complement to manual expenditure data classification, especially for massive data sets, could result in an important advance in our knowledge of public health spending at local, state, and national levels in the United States.
Our objective was to describe the use of machine-learning algorithms to replicate the process of manually classifying state public health expenditures, using standardized public health spending categories from the FPHS and a large data set from the US Census Bureau. We measured and compared the performances of machine-learning classification with manual classification of public health expenditures. This effort supports the IOM’s call for developing ways to accurately and efficiently provide information to compare public health spending by agencies and states and to promote evidence-based resource allocation.
Methods
Data Source
We obtained all data for this study from the US Census Bureau’s Annual Survey of State Government Finances. 2 States keep their own information about expenditures using different formats and degrees of detail and can categorize their expenditures as they choose.
The Census Bureau asks states to report these expenditures using up to 6 fields to describe the program area (eg, “Department of Health,” “Bureau of Communicable Disease Control,” “HIV-AIDS Division,” “HIV Prevention,” “Youth Outreach”), an object-level expenditure item (eg, ballpoint pen), the year, and the expenditure amount. States fit whatever data they have in their accounting systems into this format and submit the data to the Census Bureau. The Census Bureau collects these data for all government sectors (eg, education, public welfare, hospitals, health, highways, police protection) and stores each expenditure record with up to 6 descriptive alphanumeric data fields, which include the hierarchical string data describing the program that is responsible for the expenditure.
For this study, we obtained only US Census data with the program code E32 (ie, nonhospital health expenditures). These data included spending for not only traditional public health activities (eg, disease surveillance and outbreak control) but other related health services (eg, community health, mental health, and emergency medical care). Ultimately, we obtained a data set representing approximately 1.9 million expenditure items for 2000 through 2013.
Next, our team collapsed these data into program areas, identified and summed duplicates, and deleted object-level identifiers. The advantage of this process was that all overhead items (eg, salaries, rents, supplies) for a given program could be aggregated and assigned to the appropriate program without cluttering the database with detailed object-level expenditures. When the exact 6 descriptive fields existed in multiple years, we retained each as a separate record (in each year). Using this process, we collapsed the data from 1.9 million expenditure items into 147 280 summary expenditure records, and we used those records for our analysis.
Manual Data Analysis
Our team of 5 financial analysts manually classified the summary expenditure records. The team followed a standardized method of classifying each expenditure record as public health, maybe public health (uncertain), or not public health (other health or other services spending). The team created detailed guidance documents based on the CMS definitions of public health activity 7 and the foundational areas and foundational capabilities from the FPHS model 8 (Table 1, Box). The team used the keywords outlined in these guidance documents and the context of each record to classify the expenditures. For example, an expenditure labeled laboratory was classified as public health if accompanied by descriptors noting that it was a public health laboratory used for communicable diseases, but it was coded as not public health if accompanied by descriptors noting that it was a clinical laboratory at a drug treatment facility.
Keywords used to manually classify public health expenditures, based on the Foundational Public Health Services modela and CMS definitions of public health activity,b applied to the US Census Bureau’s Annual Survey of State Government Finances data set for 2000-2013c
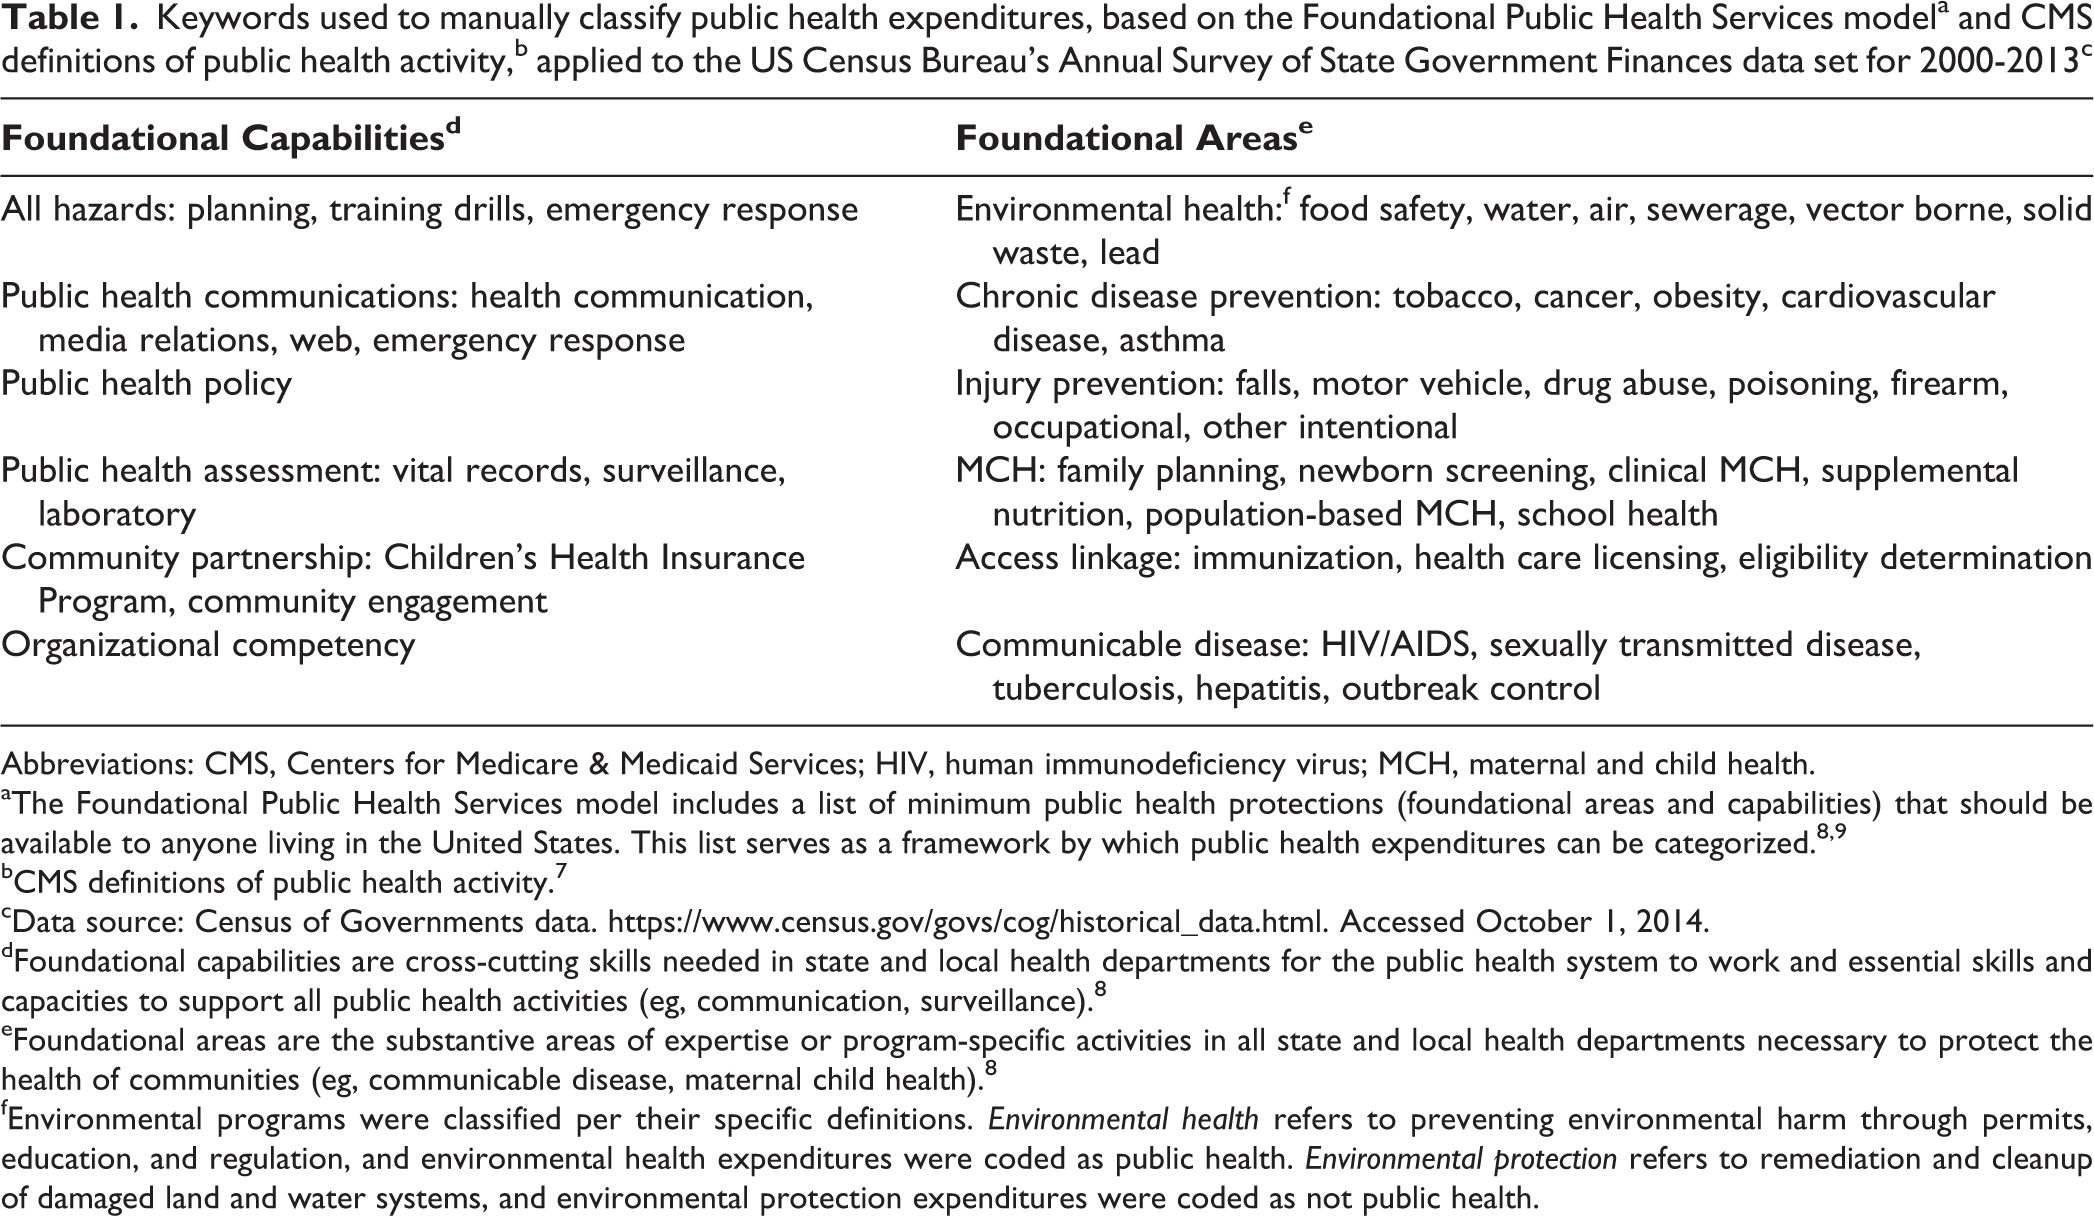
Abbreviations: CMS, Centers for Medicare & Medicaid Services; HIV, human immunodeficiency virus; MCH, maternal and child health.
aThe Foundational Public Health Services model includes a list of minimum public health protections (foundational areas and capabilities) that should be available to anyone living in the United States. This list serves as a framework by which public health expenditures can be categorized. 8,9
bCMS definitions of public health activity. 7
cData source: Census of Governments data. https://www.census.gov/govs/cog/historical_data.html. Accessed October 1, 2014.
dFoundational capabilities are cross-cutting skills needed in state and local health departments for the public health system to work and essential skills and capacities to support all public health activities (eg, communication, surveillance). 8
eFoundational areas are the substantive areas of expertise or program-specific activities in all state and local health departments necessary to protect the health of communities (eg, communicable disease, maternal child health). 8
fEnvironmental programs were classified per their specific definitions. Environmental health refers to preventing environmental harm through permits, education, and regulation, and environmental health expenditures were coded as public health. Environmental protection refers to remediation and cleanup of damaged land and water systems, and environmental protection expenditures were coded as not public health.
Keywords used to manually classify other health service (not public health) expenditures, applied to the US Census Bureau’s Annual Survey of State Government Finances data set for 2000-2013a
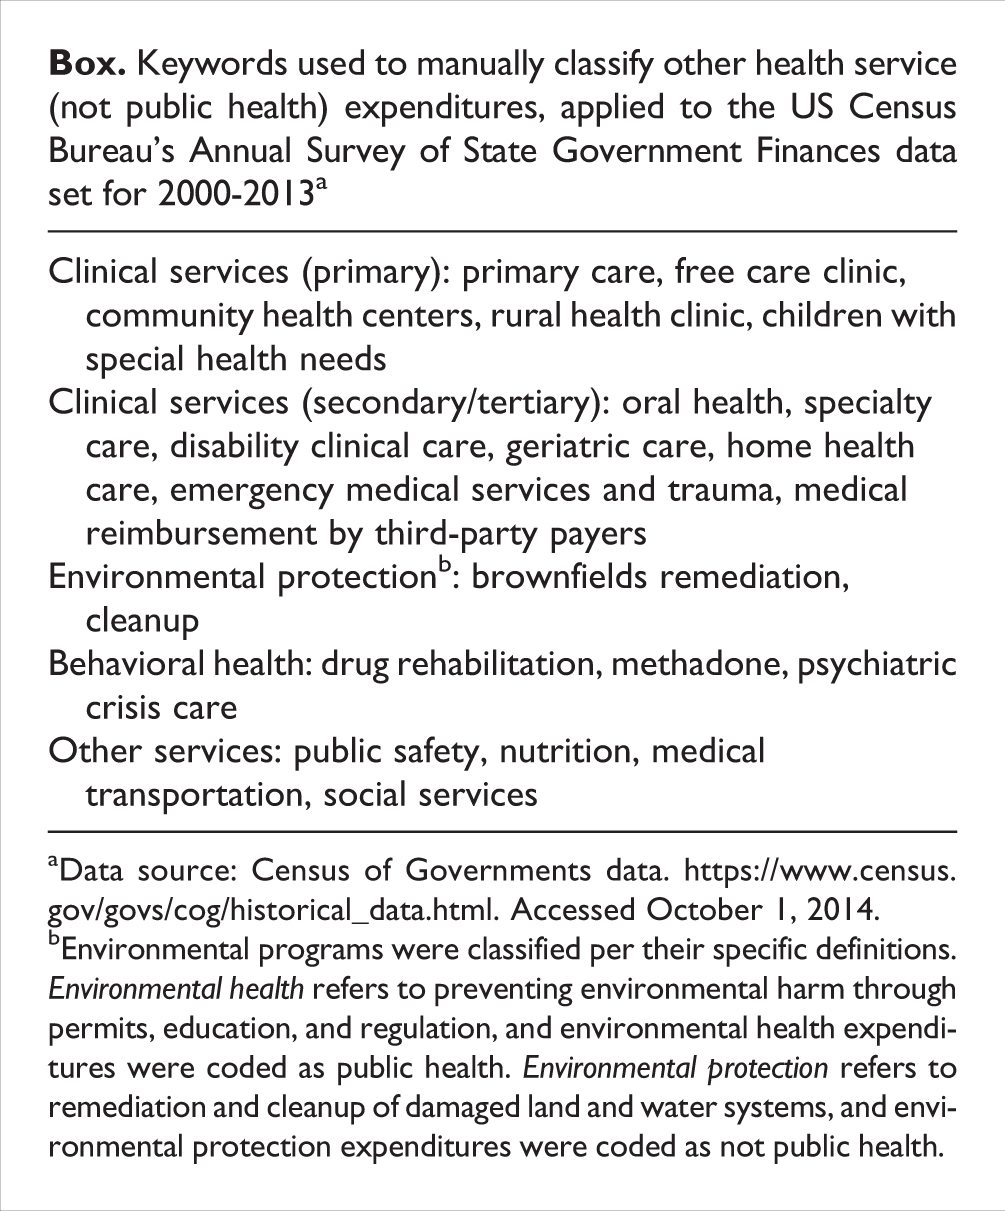
aData source: Census of Governments data. https://www.census.gov/govs/cog/historical_data.html. Accessed October 1, 2014.
bEnvironmental programs were classified per their specific definitions. Environmental health refers to preventing environmental harm through permits, education, and regulation, and environmental health expenditures were coded as public health. Environmental protection refers to remediation and cleanup of damaged land and water systems, and environmental protection expenditures were coded as not public health.
We performed manual classification in 2 stages. In the first stage, 2 analysts classified each expenditure record independently. In the second stage, another analyst revisited each record for quality control. Approximately 25% of the records were classified as maybe public health (uncertain) or could not be classified because the 2 analysts disagreed. For these records, the entire team discussed the classification and arrived at a consensus. We then incorporated the manual classifications generated by the analysts into the data set to be considered the true classifications, which we used to train the machine code and to assess performance of the machine-learning process. We used these collapsed data (147 280 summary expenditure records, separated by year of expenditure) as the data set for machine learning. Because the study did not involve human subjects, institutional review board review was waived.
Data Analysis Through Machine Learning
We preprocessed the expenditure data to make the data compatible with the classification algorithms to be applied. We collected related groups of complex alphanumeric descriptive expenditure data into individual documents. We formatted each document in an organized way that followed specific access rules to contain 6 descriptive fields and 1 manual classification code. We randomized the set of manually coded classification data and split the data into 3 subsets: (1) three-fifths of the data to train the algorithms (training data set), (2) one-fifth of the data to validate and improve the models (validation data set), and (3) one-fifth of the data to test the final models (testing data set).
Models were trained by using the manual classification code (public health, maybe public health, not public health) as the dependent variable and descriptive data as the predictors. We performed text preprocessing to arrive at an optimal method of summarizing the data, including making determinations about inclusion or omission of punctuation, white space, sparse terms, and numbers from the descriptive text, as well as about inclusion or omission of each of the 6 descriptive fields. We fit a range of parametric and nonparametric models to the training data set, applying 9 algorithm types: (1) support vector machines, (2) generalized linear model networks, (3) maximum entropy, (4) supervised linear discriminant analysis, (5) logistic boosting, (6) bootstrap aggregation, (7) classification and regression trees, (8) random forests, and (9) neural networks. 12 –17 We then applied each trained model to the validation data set and predicted a code for each record. We compared the predicted classification codes with the manual classification codes to assess performance of the machine-learning approach. Last, we applied the final set of trained models to the testing subset to assess the overall performance on fresh data.
In addition, we used ensembling, the process of using multiple algorithms to combine ≥2 classifiers, to improve the predictive accuracy of the process. We generated consensus and probability ensemble predictions to combine the individual algorithms by requiring the agreement of ≥2 algorithms to accept a prediction, thus improving confidence in that prediction.
We measured performance using the indicators recall and precision. We calculated recall, which is equivalent to the epidemiologic concept of test sensitivity, as the number of true-positive classifications divided by the sum of true-positive and false-negative classifications. We calculated precision, which is analogous to positive predictive value, as the number of true-positive classifications divided by the total number of all positive classifications. We also calculated the F score, which is the harmonic mean of precision and recall—specifically, F = 2 / (1/precision + 1/recall).
For the ensembling portion of this study, we chose a target of at least 90% recall and then reported the corresponding coverage that resulted when meeting or exceeding this target. We also reported the different levels of coverage and recall that resulted for the different numbers of algorithms required to agree on a classification to show the relationship between these 2 performance measures.
In addition, we conducted 10-fold cross-validation on each model using the entire data set. The goals of the cross-validation were to (1) limit problems such as overfitting our models to the training data set and (2) demonstrate how our models would generalize to an independent data set. If random variation in the training data set was included in the models, the predictive power of the models, when applied to a new data set, would be reduced. However, consistent results with cross-validation across subsets of data would suggest that the models were not overfitted. Because a primary application of this model would be for use with annual expenditure data, we conducted additional validation on data for each year, training the models using all data from 2000 through 2012 and then testing the models against 2013 data.
We applied the user-defined R packages RTextTools 18 and Caret 19 for data preprocessing, analysis, and prediction. We used R version 3.2.316. 13
Results
The total data set used in this study comprised 1.9 million expenditure items, which were collapsed into 147 280 summary expenditure records, each of which had 1 to 6 levels of description attached. A total of 88 368 records were used for training the models, 29 456 for validating and honing the models, and 29 456 for final testing.
The performance of individual algorithms ranged from logistic boosting, with recall of 45% and precision of 64%, to random forests, with recall of 84% and precision of 91% (Table 2). When we used ensembling to combine the results of multiple models, our target criterion of 90% recall was achieved via a consensus ensemble of ≥6 algorithms, while still retaining coverage of 93% (Table 3). Fewer than 6 algorithms agreed for 7% of the summary expenditure records, leaving these records unclassified and in need of manual classification. Among the various ensembling options, we found an inverse relationship between recall and coverage.
Performance of machine-learning algorithms relative to manual coding in classifying public health expenditures, applied to the US Census Bureau’s Annual Survey of State Government Finances data set for 2000-2013a
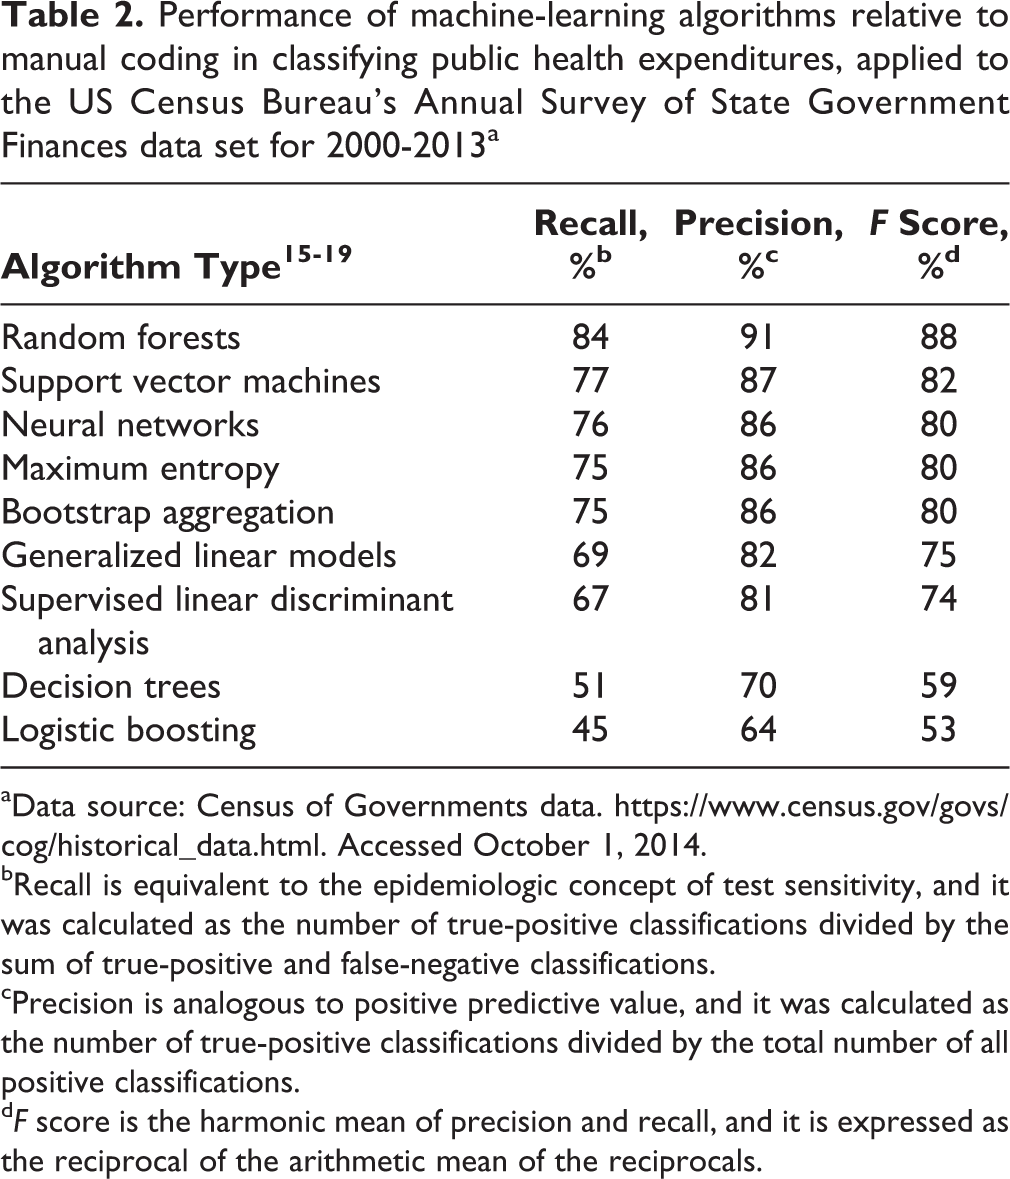
aData source: Census of Governments data. https://www.census.gov/govs/cog/historical_data.html. Accessed October 1, 2014.
bRecall is equivalent to the epidemiologic concept of test sensitivity, and it was calculated as the number of true-positive classifications divided by the sum of true-positive and false-negative classifications.
cPrecision is analogous to positive predictive value, and it was calculated as the number of true-positive classifications divided by the total number of all positive classifications.
dF score is the harmonic mean of precision and recall, and it is expressed as the reciprocal of the arithmetic mean of the reciprocals.
Performance of ensemblea of algorithms relative to manual coding used to classify public health expenditures, applied to the US Census Bureau’s Annual Survey of State Government Finances data set for 2000-2013b
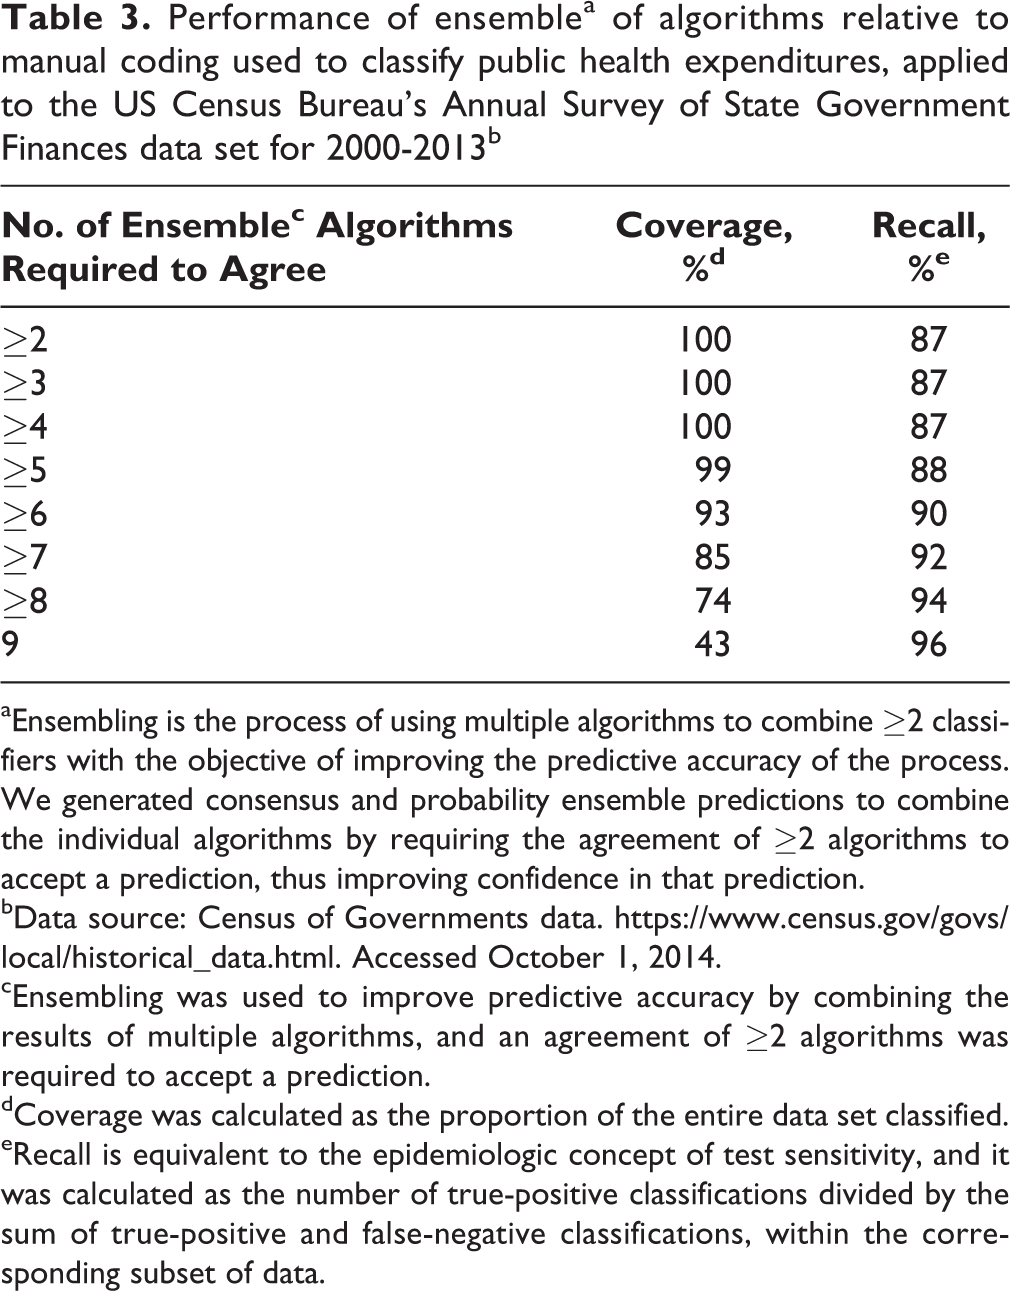
aEnsembling is the process of using multiple algorithms to combine ≥2 classifiers with the objective of improving the predictive accuracy of the process. We generated consensus and probability ensemble predictions to combine the individual algorithms by requiring the agreement of ≥2 algorithms to accept a prediction, thus improving confidence in that prediction.
bData source: Census of Governments data. https://www.census.gov/govs/local/historical_data.html. Accessed October 1, 2014.
cEnsembling was used to improve predictive accuracy by combining the results of multiple algorithms, and an agreement of ≥2 algorithms was required to accept a prediction.
dCoverage was calculated as the proportion of the entire data set classified.
eRecall is equivalent to the epidemiologic concept of test sensitivity, and it was calculated as the number of true-positive classifications divided by the sum of true-positive and false-negative classifications, within the corresponding subset of data.
The performance of algorithm ensembling, when applied to expenditure records within individual years, was close to that of the full data set. For each of the 13 years tested, at least 90% recall was achieved by ensemble prediction. With recall ≥90%, the lowest coverage attained in any of the 13 years was 83%. When we cross-validated the complete data set (without differentiating by year) for each algorithm type, the out-of-sample recall did not vary by more than a few percentage points throughout all subsets of data.
Of $50.5 billion in total expenditures in 2013, $19.7 billion (39%) was classified as public health expenditures by manual coding and $21.1 billion (42%) by machine prediction (Table 4). Of 14 725 records of expenditures in the 2013 data set, 7553 (51%) were classified as public health expenditures by manual coding and 8053 (55%) by machine predictions.
Comparison between manually classified and machine-classifieda total expenditures and proportions of records, by expenditure type, based on the US Census Bureau Governments Division, Annual Survey of State Government Finances data setb for 2013c
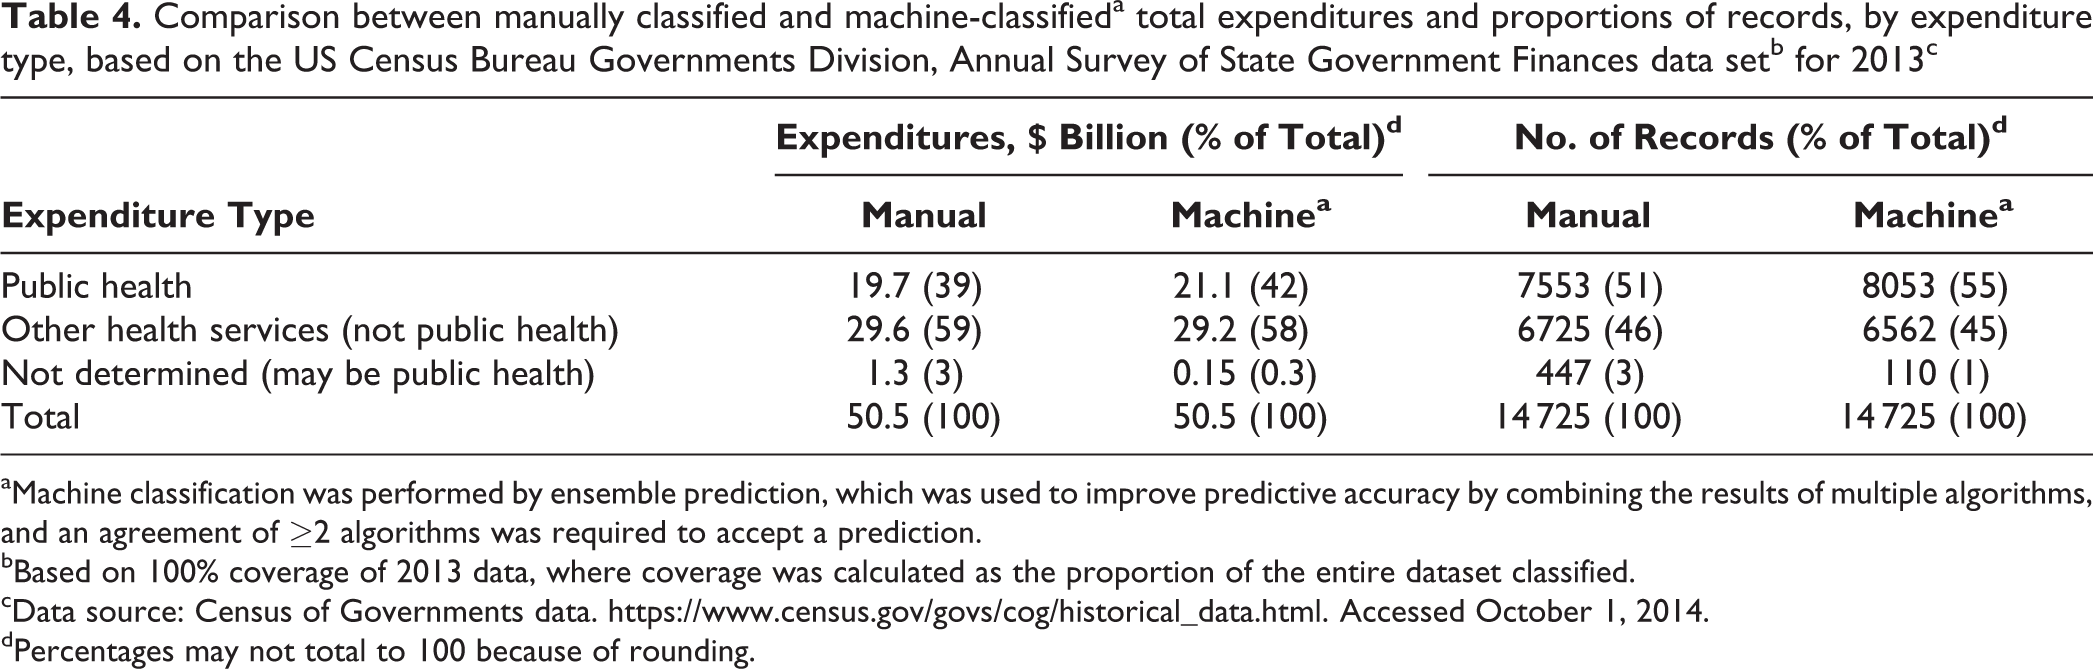
aMachine classification was performed by ensemble prediction, which was used to improve predictive accuracy by combining the results of multiple algorithms, and an agreement of ≥2 algorithms was required to accept a prediction.
bBased on 100% coverage of 2013 data, where coverage was calculated as the proportion of the entire dataset classified.
cData source: Census of Governments data. https://www.census.gov/govs/cog/historical_data.html. Accessed October 1, 2014.
dPercentages may not total to 100 because of rounding.
Discussion
This study demonstrates that machine-learning methods can replicate the human classification of public health expenditures from the Annual Survey of State Government Finances data set with a high degree of accuracy. We observed that the random forests algorithm had the best single-algorithm performance, resulting in 84% recall and 91% precision. Other individual algorithms did not perform as well.
We implemented algorithm ensembling to enhance the predictive accuracy of the process. We achieved the highest levels of classification recall with ensembling predictions of ≥6 algorithms. However, we also found that data set coverage decreased as the requirements for algorithm agreement increased so that when more stringent machine standards for classification were used, more summary expenditure records were left unclassified. For example, we observed 94% recall when using a consensus ensemble of ≥8 algorithms and 96% recall using a consensus ensemble of 9 algorithms. Yet, these high recall results were associated with reduced coverages of 74% and 43% (leaving 26% and 57% of records unclassified), respectively. Conversely, we found that when machine predictions required only ≥5 algorithms to predict the same classification, 88% recall was achieved, and only 1% of the summary expenditure records remained unclassified. Ultimately, we chose a target recall level of 90%, which was achieved by requiring agreement of ≥6 algorithms and which resulted in 7% of records remaining unclassified.
As these results show, the ensembling process can involve a trade-off between coverage and recall. Increasing the burden of algorithm agreement typically increases recall for the subset of the data set that is classified. However, as the number of algorithms required for a prediction to hold is increased, fewer data records are classifiable, resulting in reduced coverage. One important consequence of poor coverage is that the unclassifiable data records must then be classified manually or by using some form of automated data postprocessing. The best solution to this trade-off between recall and coverage and to the choice between the use of individual algorithms and ensemble predictions depends on the intended use of the results, the need for high accuracy, the degree of error in classification that is acceptable, and the resources (eg, financial, staff) available to perform statistical analysis and additional manual classification when needed.
On a separate note, we found that the results of cross-validation on the complete data set for each algorithm type were consistent, across subsets of data and across test years. This finding suggests that overfitting did not threaten the validity of our results. It also indicates that, at least based on the historical data available, our models would perform well on annual expenditure data as they become available.
We are currently preparing this completed database of public health expenditures for 2000 through 2013 for public use and calling it the State Health Expenditures Database. 20 Until the database is available for public use, it can be obtained by beta testers from the corresponding author.
Limitations
This study had several limitations. First, the machine-learning methods used in this study may not be fully generalizable for use by other jurisdictions without some manual oversight. The application of trained algorithms to future expenditure data may be invalidated by any systematic change in the descriptive tags that individual states apply to their spending data. The machine-learning algorithms would not automatically recognize such a change. For example, if a new category of public health spending emerged and new descriptive fields were defined to classify it, the predicted classifications could be incorrect unless the machine-learning algorithm was modified. This risk is common to many machine-learning applications, and the risk can be mitigated by including human oversight in the process, especially as it relates to fundamental changes in public health program classification. Second, unreported or inadvertent administrative changes to data formatting or data structure could lead to large-scale miscoding. However, manual spot checks during and after the data entry process would likely mitigate this risk.
Policy Implications
We identified a number of policy implications of this study and its results. Generally, this research illustrates the potential application of machine-learning tools to social science fields, which need to classify large sets of data and in which automated processes are potentially underused. Specifically, we demonstrated that machine learning can validly parse information on public health expenditures from information on other types of health-related expenditures and that it can also produce acceptable estimates of state-level public health spending.
The US Census Bureau currently uses time-consuming and costly coding methods to process state government expenditures, including those for public health. This coding process must be performed annually by every state. It took our team of human analysts approximately 600 person-hours to manually code and reconcile these spending data. In contrast, with machine learning and an ordinary laptop computer, it took approximately 1 hour to classify 147 280 summary expenditure records. Even if some additional manual spot checking and coding of unclassified records were to be required, the use of machine-learning tools would lead to substantial cost and person-hour savings.
Machine learning for data analysis can also be a cost-effective way to better understand and evaluate the effectiveness of government spending for public health. When spending data can be manipulated quickly and easily, the results can be more thoroughly understood and applied in innovative ways to inform and evaluate resource allocation. In other words, machine learning can enable local, state, and federal public health professionals to more quickly and easily assess total spending and spending by department. It can also allow public health practitioners and researchers to more easily compare health department expenditures in various agencies throughout the country, in alignment with the uniform chart-of-accounts system being developed. 5 Ultimately, the use of machine learning offers promise to advance the public health mission 21 to monitor health status and to evaluate the effectiveness of population-based health services in ways that can maximize population health outcomes and minimize costs.
Conclusion
The successful application of machine learning to classify governmental public health expenditures shows that it can be a valid, time-saving, and cost-saving tool for estimating and comparing public health spending among states and public health agencies in the United States. Machine learning can be used with standardized FPHS model public health spending categories to help parse public health expenditure information from other types of health-related spending, provide data that are comparable across public health organizations, and evaluate the impact of evidence-based public health resource allocation.
Footnotes
Acknowledgments
We thank the deBeaumont Foundation, which provided financial support for this research.
Declaration of Conflicting Interests
The authors declared no potential conflicts of interest with respect to the research, authorship, and/or publication of this article.
Funding
The authors disclosed receipt of the following financial support for the research, authorship, and/or publication of this article: the deBeaumont Foundation, which provided financial support for this research.