
Abstract
Objectives:
Block grant funding provides federal financial support to states, with increased flexibility as to how those funds can be allocated at the community level. At the state level, block grant amounts and distributions are often based on outdated formulas that consider population measures and funding environments at the time of their creation. We describe variation in state-level funding allocations for 5 federal block grant programs and the extent to which funding aligns with the current needs of state populations.
Methods:
We conducted an analysis in 2022 of state block grant allocations as a function of state-level characteristics for 2015-2019 for all 50 states. We provide descriptive statistics of state block grant allocations and multivariate regression models for each program. Models include base characteristics relevant across programs plus supplemental characteristics based on program-specific goals and state population needs.
Results:
Mean state block grant allocations per 1000 population by program ranged from $618 to $21 528 during 2015-2019. Characteristics associated with state allocations varied across block grants. For example, for every 1-percentage-point increase in the percentage of the population living in nonmetropolitan areas, Preventive Health and Health Services Block Grant funding was approximately $7 per 1000 population higher and Community Services Block Grant funding was approximately $40 per 1000 population higher. Few supplemental characteristics were associated with allocations.
Conclusions:
Current block grant funding does not align with state characteristics and needs. Future research should consider how funds are used at the state level or allocated to local agencies or organizations and compare state block grant allocations with other types of funding mechanisms, such as categorical funding.
Block grants are noncompetitive, formula-based grants mandated by the US Congress. They are intended to provide flexibility and increased capacity to states and local governments to provide services, including social services and public health services, based on the needs of their communities. 1 While block grant funding is often favored by states because of its flexibility, it is unclear whether resources are consistently distributed equitably based on need, community characteristics such as race and ethnicity, or geography (ie, rurality). Many block grants that exist today are based on formulas established decades ago, 2 which may no longer reflect the characteristics and needs of communities and may also make it difficult for states to equitably distribute funds.
Federal agencies often use block grants to support activities such as childcare, antipoverty strategies, behavioral health, and public health at the state and local levels. Most of these programs began in the 1980s and 1990s, and funding for many of these programs has decreased over time. 3 Formulas for many block grants were developed when the block grant was established and reflect population characteristics, funding environments, and funding streams at the time. 2 Previous evidence has demonstrated the importance of block grant mechanisms to meet social needs in particular, but the flexibility and requirements of this type of funding also pose challenges. 1 Specifically, the 2-step process requires federal agencies to first allocate funds to states, which then have the flexibility to determine how to prioritize funding areas and efforts in their states. Ultimately, the limited, and often decreasing, amount of funds received by states based on these formulas places constraints on how states can use block grant funds and the extent to which those funds can be equitably allocated. As block grants continue to be a common mechanism for allocating federal resources, and as funding amounts change, a need exists to better understand federal allocation of these funds to states and from states to communities.
The objective of the current study was to describe variation in state block grant allocations and the extent to which funding aligns with the current characteristics and demonstrated needs of state populations. We focused on 5 block grant programs across 3 federal agencies during 2015-2019, before the COVID-19 pandemic. All of these block grant programs are related to public health or social determinants of health and include the following: the Preventive Health and Health Services (PHHS) Block Grant administered by the Centers for Disease Control and Prevention (CDC), 4 the Community Services Block Grant (CSBG) administered by the Office of the Administration for Children and Families, 5 the Child Care and Development Fund/Block Grant (CCDF, CCDBG) administered by the Administration for Children and Families, 6 the Substance Abuse Prevention and Treatment Block Grant (SABG) administered by the Substance Abuse and Mental Health Services Administration (SAMHSA), 7 and the Community Mental Health Services Block Grant (MHBG) administered by SAMHSA. 8 The 5 block grants are designed to support various populations and health-related social needs, which informed our analyses. PHHS is intended to address a wide range of population health areas of need in a given area and must reflect the current Healthy People target goals. 4 CSBG focuses on addressing and preventing poverty. 5 CCDF primarily supports costs of childcare for families with low incomes as well as some statewide efforts related to ensuring the availability of high-quality childcare across the state. 6 SABG provides funding for activities related to substance use treatment and prevention. 7 The mechanisms and funding guidance differ among funds that are used for treatment and prevention activities. Lastly, MHBG is designed to provide funding for comprehensive mental health services. 8 Findings from this study will be of interest to federal and state policy makers responsible for managing these and other block grant programs.
Methods
We used a panel analysis of state block grant allocations as a function of state-level characteristics for 2015-2019. The East Tennessee State University Institutional Review Board deemed this study nonhuman subjects research and, therefore, waived institutional review board approval.
Data Sources
We obtained data on state block grant allocations from the federal agencies responsible for distributing funds during 2015-2019. We adjusted all allocation amounts for inflation to 2019 US dollars with the US Bureau of Labor Statistics Consumer Price Index Inflation Calculator. 9 We then calculated allocation amounts per 1000 population using population size from the US Census Bureau’s American Community Survey (ACS). 10
Additional data sources for state characteristics included other demographic information from ACS 2015-2019, 10 2013 rural–urban continuum codes from the US Department of Agriculture, 11 2019 Association of State and Territorial Health Officials state profiles, 12 Kaiser Family Foundation data on Medicaid expansion status, 13 the National Association for State Budget Offices, 14 CDC WONDER, 15 the biannual National Survey on Drug Use and Health for 2014-2019, 16 America’s Health Rankings, 17 SAMHSA’s state mental health agency characteristics report from 2015, 18 and a report from the National Center for Education Statistics reflecting the 2016-2017 school year. 19 Each of these data sources reflects data for each state and year, unless otherwise specified.
Analyses
First, we calculated descriptive statistics for state block grant allocations per 1000 population for each block grant. We then created multivariate linear regression models of state block grant allocations as a function of state characteristics for each of the 5 block grants included. Each model included the same base characteristics: percentage of the population living below the federal poverty level, Medicaid expansion status, state budget, population demographic characteristics, and region. The base model was designed to capture high-level measures of state-level infrastructure, population demographic characteristics, and economic measures consistent with all of the block grant programs and common measures for adjusting for context in studies related to population health. Each model also includes supplemental characteristics specific to each block grant. These characteristics are based on the goal of the block grant program and were selected to reflect the needs of the population and the scope of the grant. These were also selected based on the purpose of the block grant, as articulated by the federal administrating agency. We used variance inflation factors to identify potential multicollinearity of theoretically similar measures.
The PHHS model included health department governance structure (centralized, decentralized, mixed, shared), whether the public health agency is freestanding/independent or under an umbrella agency, the percentage of the population that lacks health insurance, various age-adjusted mortality rates (heart disease, cancer, diabetes, cerebrovascular diseases, and all-cause mortality), and the number of primary care physicians per 100 000 population. The CSBG model included unemployment rate. The CCDF model included the percentage of the population that is aged <18 years and the percentage of children aged 3-4 years who are in state-run prekindergarten (0%, >0%-5%, >5%-25%, >25%-100%).
The SABG model included all-cause mortality rate, where the state mental health agency (SMHA) is situated (human services, independent, health department, health and human services, other/no response), how the SMHA is connected to the state agency for substance use disorders (combined, same umbrella, other/no response), whether the SMHA is connected with the state public health agency, percentage of the population with identified substance use disorder in the past year, and the number of mental health providers per 100 000 population.
Lastly, the MHBG model included the SMHA structure indicators described previously, the number of mental health providers per 100 000 population, the percentage of the population with any mental illness in the past year, the percentage of the population with serious mental illness in the past year, and the age-adjusted intentional self-harm mortality rate.
Results
State-Year Allocations
Mean state block grant allocations per 1000 population by block grant ranged from $618 for PHHS to $21 528 for CCDF during 2015-2019 (Table 1). PHHS had the lowest allocations per 1000 population; MHBG, CSBG, SABG, and CCDF had the highest allocations per 1000 population. We found wide variation across states within each block grant. For example, the minimum allocation per 1000 population for PHHS was $199 and the maximum was $1905. For CCDF, the minimum allocation was $2499 and the maximum was $144 001.
Allocations of state-year block grant funding allocations per 1000 population, by block grant, United States, 2015-2019 a
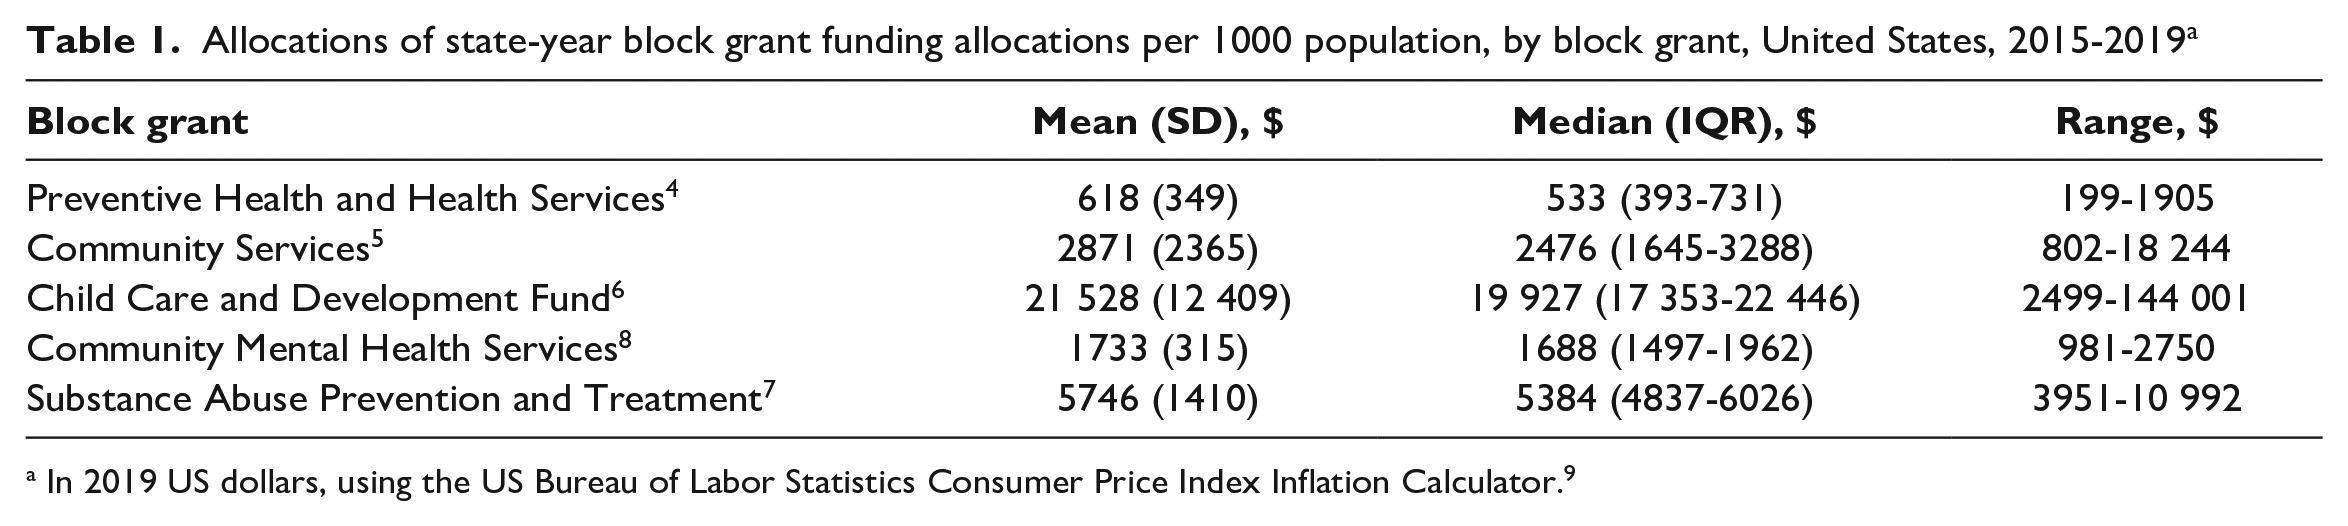
In 2019 US dollars, using the US Bureau of Labor Statistics Consumer Price Index Inflation Calculator. 9
Regression Results
In the base model, the percentage of the population living in nonmetropolitan counties was associated with greater PHHS and CSBG funding (Table 2). Specifically, with each additional percentage of the population that lives in nonmetropolitan counties, PHHS funding was approximately $7 more per 1000 population. State budgets were positively associated with CSBG and CCDF funding. The percentage of the population that was non-White was associated with greater PHHS and MHBG funding, while the percentage of the population that was Hispanic was positively associated only with MHBG funding. We found some significant differences in funding by region for select block grants. Specifically, compared with the South, the Northeast had significantly higher PHHS funding (β = 330.8; P = .025) and CSBG (β = 826.4; P = .048), while the Northeast and Midwest had significantly lower CCDF funding (β = 5786.4; P = .017; β = 5608.6; P = .01, respectively). No other characteristics in the base models were significant.
Results from regression models of associations between block grant allocations and state characteristics, United States, 2015-2019 a
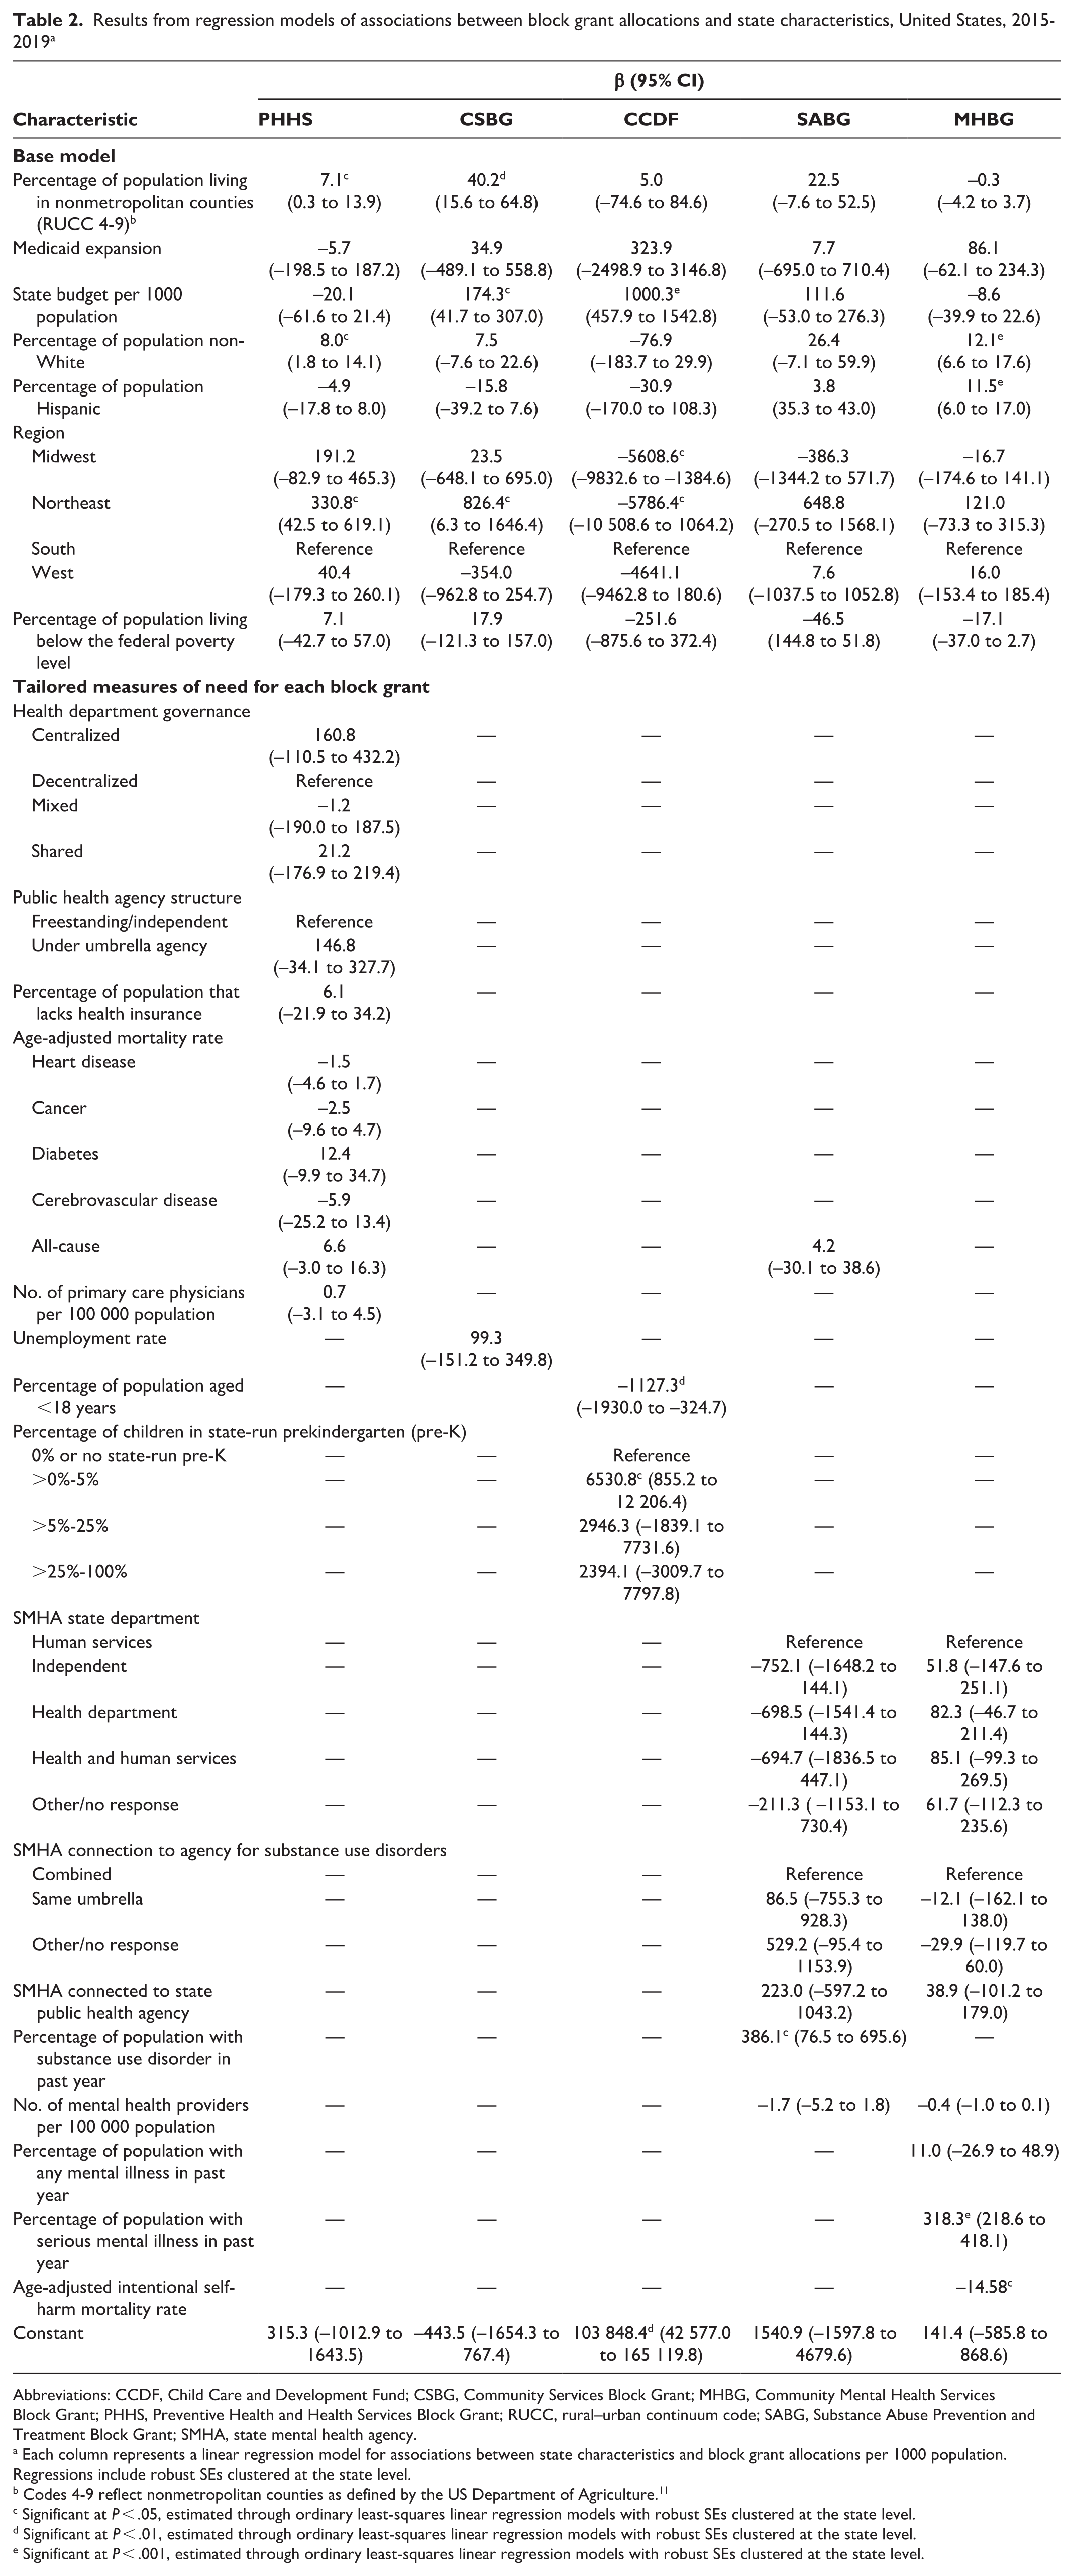
Abbreviations: CCDF, Child Care and Development Fund; CSBG, Community Services Block Grant; MHBG, Community Mental Health Services Block Grant; PHHS, Preventive Health and Health Services Block Grant; RUCC, rural–urban continuum code; SABG, Substance Abuse Prevention and Treatment Block Grant; SMHA, state mental health agency.
Each column represents a linear regression model for associations between state characteristics and block grant allocations per 1000 population. Regressions include robust SEs clustered at the state level.
Codes 4-9 reflect nonmetropolitan counties as defined by the US Department of Agriculture. 11
Significant at P < .05, estimated through ordinary least-squares linear regression models with robust SEs clustered at the state level.
Significant at P < .01, estimated through ordinary least-squares linear regression models with robust SEs clustered at the state level.
Significant at P < .001, estimated through ordinary least-squares linear regression models with robust SEs clustered at the state level.
None of the supplemental characteristics reflecting the measures of need or scope of the grant were significant for either PHHS or CSBG. For CCDF, the percentage of the population aged <18 years was associated with significantly lower funding (β = 1127.3; P = .007), while having >0% to 5% of children in state-run prekindergarten was associated with significantly greater funding compared with states with no state-run prekindergarten (β = 6530.8; P = .025). For SABG, the percentage of the population with substance use disorder in the past year was associated with greater funding. Specifically, for each additional percentage of the population with a substance use disorder in the past year, SABG funding was $386 higher per 1000 population. Lastly, for MHBG, we found a positive association between the percentage of the population with serious mental illness in the past year and MHBG funding and a negative association between the intentional self-harm mortality rate and MHBG funding. No other supplemental measures reflecting the need or scope of the grants were significantly associated with funding levels.
Discussion
This study described state block grant allocations and the relationship between such allocations and state-level measures of need. We found some regional variation in allocation amounts and differences by state demographic characteristics but relatively few associations between the measures of need and block grant allocations. In 2 instances, we even found the opposite. For example, CCDF funding was negatively associated with the percentage of the population who are children and may need childcare. MHBG funding was also negatively associated with the intentional self-harm mortality rate. This finding may suggest that funding amounts no longer reflect the needs of the population. These block grants were established decades ago, and funding formulas for most of these programs are at least partially based on historical funding amounts. 2 In addition, the formulas for these programs are complex and written into legislation, creating challenges for adjustments at the federal level. The importance of this funding and the challenges to adjusting formulas underscore the importance of states allocating their resources equitably and effectively across their communities.
The formulas for the block grants considered in this study have generally not been adjusted since their establishment, mostly in the 1980s and 1990s.2,4,20 The formulas across these block grants are complex and vary greatly across funding streams. For example, MHBG and SABG explicitly include measures of “need” in their formula in addition to measures of service delivery costs and state fiscal capacity. 2 These formulas were intentionally designed to support a similar level of service offerings across individuals in all states. CCDF similarly includes adjustments based on economic indicators and measures of the child population, such as children receiving free and reduced-price lunch. 21 In contrast, PHHS was established through the combination of several previous categorical funding programs supporting various activities and services and is largely a function of those historic funding amounts. For example, PHHS stems from the combination of home health services, urban rodent control, community water fluoridation, hypertension efforts, and more. 4 These formulas are generally written into legislation and, therefore, are difficult to adjust and have largely remained the same for decades.
Block grant funding plays an important role in providing a variety of services to local communities and in a flexible way. 1 The 2-step process, whereby funds are first allocated to states based on historical formulas and then to local agencies or organizations with limited federal criteria or guidance, creates wide variability across states and leads to disparities in funding amounts and misalignment with community characteristics and needs. While the flexibility of block grants may allow states and local agencies or organizations to use funding for a variety of purposes and to prioritize populations or services specific to their needs, creating systems that allow for greater prioritization of need and greater accountability may help to ensure that block grant funding better aligns with program intent. Our study considers the first step of this process by analyzing how funding is allocated to states.
Limitations
This study had several limitations. First, we used state-level allocation amounts and state-level characteristics, which are coarse measurements of community characteristics and need in states. This approach reflects the allocation of funding to states based on formulas, but, ultimately, these amounts are averages and may not reflect more specific characteristics of individual communities or intended audiences for particular block grants. Second, we did not capture data on the amount of funding actually reaching local communities. Because of this, associations between funding amounts and state characteristics do not necessarily imply that block grant funding is actually reaching populations or communities with the highest need in states. Future research should explore the second stage of block grant funding from state agencies to local agencies or organizations. Third, this study focused on a subset of all block grant programs; as such, our findings may not be generalizable to all block grant programs. While other block grant programs may differ in how well allocations align with measures of need, we focused on 5 public and population health–relevant block grants across 3 federal agencies that administer numerous block grant programs. Fourth, this study focused only on allocations of block grant programs without comparisons with other funding types, such as categorical funding streams. As such, our findings may not be generalizable to other funding mechanisms. While other funding types may or may not have similar findings, how well allocations align with measures of need for other funding types does not subtract from the findings and implications of this study specific to block grants and their formulas and allocation processes. Future research may expand on the block grants included in this study, consider alignment of other funding mechanisms with measures of need, and develop a framework or recommendations for federal agencies and states to better align funding with population characteristics and demonstrated need.
Conclusions
Block grants provide important funding for a variety of social and health-related services and supports. We found that state allocation amounts largely no longer reflect the changing population demographic characteristics and needs of states. Given the structure of federal funding formulas and that funding is not aligned with population needs, states face additional challenges in actively taking steps to ensure that funding is allocated equitably in their state.
Footnotes
Declaration of Conflicting Interests
The authors declared no potential conflicts of interest with respect to the research, authorship, and/or publication of this article.
Funding
The authors disclosed receipt of the following financial support for the research, authorship, and/or publication of this article: This project was supported by the Health Resources and Services Administration (HRSA), the US Department of Health and Human Services (HHS) under grant no. U1CRH39978 Rural Health Research Grant Cooperative Agreement. The information or content and conclusions are those of the authors and should not be construed as the official position or policy of, nor should any endorsements be inferred by, HRSA, HHS, or the US government.