
Abstract
Objective:
The purpose of this study was to compare the rates of traumatic injury among five racial/ethnic groups in Arizona and to identify which mechanisms and intents of traumatic injury were predominant in each group.
Methods:
We obtained 2011 and 2012 data on traumatic injury from Arizona’s trauma registry and data on mortality from Arizona's death registry. We calculated location- and age-adjusted rates (aRs) of traumatic injury and rates of mortality per 100,000 Arizona residents and rate ratios (RRs) for each racial/ethnic group. We also calculated race/ethnicity specific aRs and RRs by mechanism of injury, intent of injury, and alcohol use.
Results:
We analyzed data on 58,034 cases of traumatic injury. After adjusting for age and location, American Indians/Alaska Natives (AI/ANs) had the highest overall rate of traumatic injury (n = 6,287; aR = 729) and Asian Americans/Pacific Islanders had the lowest overall rate of traumatic injury (n = 553; aR = 141). By intent, AI/ANs had the highest rate of homicide/assault-related traumatic injury (n = 2,170; aR = 221) and by mechanism, non-Hispanic black/African American people had the highest rate of firearm-related traumatic injury (n = 265; aR = 40). In 2011-2012, 8,868 deaths in Arizona were related to traumatic injury. AI/ANs had the highest adjusted mortality rate (n = 716; aR = 95).
Conclusion:
Racial/ethnic disparities in traumatic injuries persisted after adjusting for age and injury location. Understanding how these disparities differ by mechanism, intent, and alcohol use may lead to the development of more effective initiatives to prevent traumatic injury.
Traumatic injury is a rapidly growing health concern in the United States. Death resulting from traumatic injury increased by 22.8% from 2005 (140,951 deaths) to 2010 (173,410 deaths) 1 ; traumatic injury is the leading cause of years of potential life lost. 1,2 Traumatic injury is also a leading cause of illness. More than 90% of trauma patients survive the first year of a traumatic injury. 3 For these patients, however, traumatic injury can lead to lifelong illness and place a substantial economic burden on the health-care system. Identifying at-risk populations can help communities target prevention efforts where they are most needed.
Although racial/ethnic disparities in traumatic injury are widely studied, smaller groups such as American Indians/Alaska Natives (AI/ANs) and Asian American/Pacific Islanders (AA/PIs) are frequently excluded or combined into a single category. 4 –6 Those studies that have focused on these minority populations compared only a single racial/ethnic group with the general population. 7 –11 Arizona’s population is a particularly good source of data for studies of injury because it includes these minority groups in numbers that are large enough to obtain meaningful results. Arizona’s injury data allow an evaluation of disparities in the incidence of traumatic injury among five racial/ethnic groups and an evaluation of injury mechanism and intent. Other studies of the incidence of traumatic injury have been restricted to a single mechanism or intent, 4,9,10,12 –15 have given a limited picture of racial/ethnic disparities, or have failed to identify other at-risk populations.
Racial/ethnic differences in traumatic injury may vary by whether an injury occurs in a rural or urban location. One study found that among AIs, motor vehicle fatality rates were higher when accidents occurred in rural rather than urban locations. 13 Characteristics such as road conditions, safety enforcement, and access to care may contribute to rural/urban differences in the rates of traumatic injury. 5,12,13,16 Although few studies have controlled for injury location, adjusting for location may be particularly important in Arizona, where more than half of the AI/AN population lives in rural areas. 13,16
The purpose of this analysis was to examine differences in the rates of traumatic injury among five racial/ethnic groups in Arizona. The primary objective was to determine if the overall rates of traumatic injury varied by race/ethnicity after adjusting for age and injury location. The secondary objective was to identify racial/ethnic disparities in rates of traumatic injury mortality, alcohol-related traumatic injuries, and rates of traumatic injuries by mechanism or intent. This study was intended to provide a comprehensive analysis of traumatic injury by race/ethnicity in Arizona to identify at-risk populations and target them for local prevention efforts. To our knowledge, few studies have used a state trauma registry to compare data among multiple racial/ethnic groups and to evaluate how disparities in traumatic injury differ by mechanism or intent.
Methods
For this retrospective analysis, we collected data on traumatic injury from the Arizona State Trauma Registry (ASTR) and data on death from the Arizona Vital Statistics Information Management System–Electronic Death Registry (AZ–EDR) for 2011 and 2012. Data collected in the ASTR are reported by 23 designated trauma centers and four participating non-designated hospitals in Arizona. Twenty-seven health-care facilities participated in Arizona’s trauma system for the years 2011 and 2012: eight level I trauma centers, 15 level IV trauma centers, and four non-designated hospitals. Each patient record contains data on demographic characteristics, preexisting comorbidities, pre-hospital treatment, emergency department care, injury severity score, hospital outcomes, charges, and complications. The AZ–EDR collects information on all deaths occurring in Arizona and on deaths of Arizona residents occurring outside of Arizona. We derived population estimates for 2011 and 2012 from the Arizona Department of Health Services, Health Status and Vital Statistics database. 17 This study was considered exempt from institutional review board review by the Arizona Department of Health Services Human Subjects Review Board.
ASTR data on race/ethnicity are collected in the hospital through patient self-report or through report by a family member or friend. For this analysis, from eight possible response options, we created five categories of race/ethnicity: non-Hispanic white (hereinafter white), AI/AN, non-Hispanic black/African American (hereinafter black), Hispanic, and AA/PI. Patients who identified as both Hispanic and any other race were classified as Hispanic. We based location on the county in which the injury occurred. We classified four counties (Maricopa, Pima, Pinal, and Yuma) as urban and the remaining 11 counties as rural. Data on alcohol use are collected through patient self-report or through blood alcohol testing performed at a hospital. We identified the mechanism of injury and intent of injury using the International Classification of Diseases, Ninth Revision (ICD-9) external cause-of-injury codes (E800-E959). 18 Intent indicates whether the injury was caused deliberately or not deliberately. 19 Intent is classified into three categories: unintentional, homicide/assault, and suicide/self-inflicted. Mechanism indicates the way in which the person sustained the injury or the process by which the injury occurred. 20 For data on mechanism, first we determined whether the injury was a blunt injury or a penetrating injury. We further categorized the data for blunt injury into the three major mechanisms of blunt trauma: motor vehicle traffic, falls, and struck by/against. All other mechanisms of blunt trauma were grouped into the category “blunt-other.” The two major mechanisms of penetrating trauma are cut/pierce and firearm; all other mechanisms of penetrating trauma were grouped into the category “penetrating-other.” We identified trauma deaths from the AZ–EDR using International Classification of Diseases, Tenth Revision (ICD-10) underlying cause-of-death codes (V01-Y36, Y85-Y87, and Y89). 21
We calculated the primary outcome of interest—age- and location-adjusted overall rate of traumatic injury—for each racial/ethnic group. We adjusted for age and location by the direct method of standardization using the combined 2011 and 2012 Arizona population denominators as the standard population. We used age, location, and race/ethnicity-specific population denominators to calculate the crude rates. We then calculated age- and location-adjusted rates (aRs) using the crude rates and the standard population. We calculated adjusted rate ratios (aRRs) and 95% confidence intervals (CIs) to compare the rates of traumatic injury in each racial/ethnic group, with white people serving as the reference group. We also calculated aRs and RRs for traumatic injury mortality, alcohol-related traumatic injury, mechanism, and intent. We calculated all rates per 100,000 Arizona residents.
We excluded from analysis patients who were missing data on race/ethnicity, county of injury, or age. We performed all analyses using SAS
Results
During the study period, 60,426 cases of traumatic injury were reported to ASTR; of these, 4,041 (6.7%) were excluded because of missing data on race/ethnicity, age, or county of injury. The final study population consisted of 58,034 cases of traumatic injury. After adjusting for age and location, the overall aR of traumatic injury was significantly higher among AI/ANs (n = 6,287; aR = 729; RR = 1.70, 95% CI = 1.69, 1.72) and significantly lower among AA/Pls (n = 553; aR = 190; RR = 0.44, 95% CI = 0.44, 0.45) than among white people (n = 33,117; aR = 428) (Table 1).
Crude and adjusted rates of traumatic injury per 100,000 residents, by race/ethnicity, Arizona, 2011-2012a
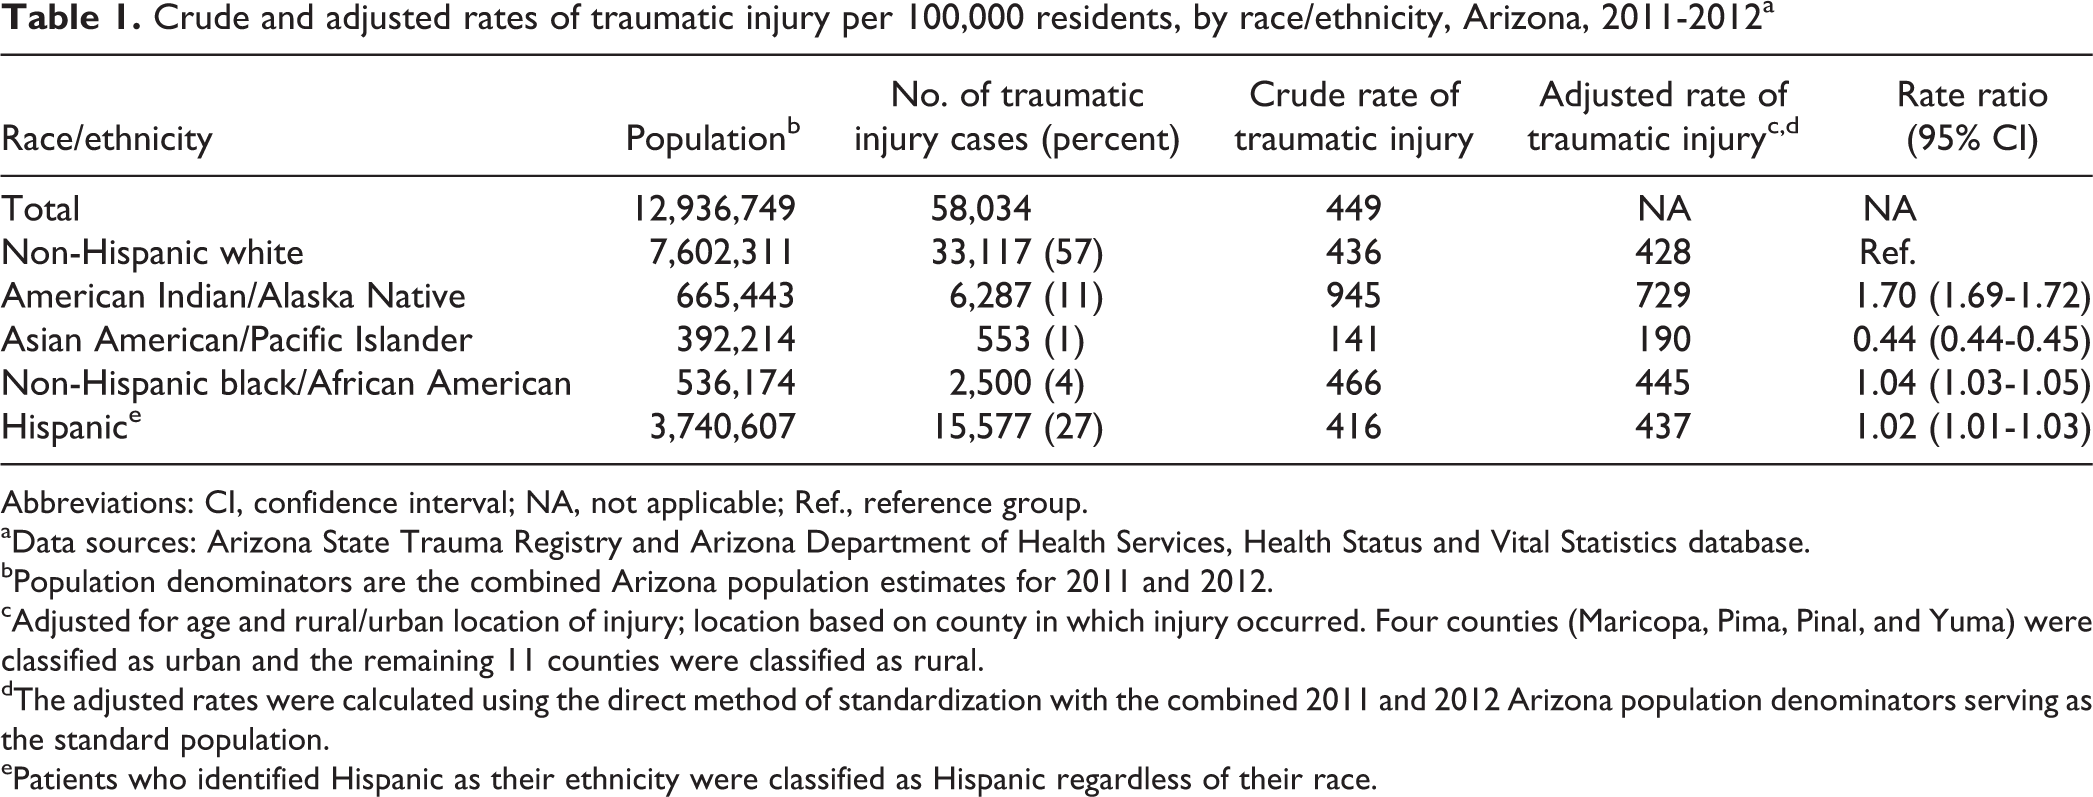
Abbreviations: CI, confidence interval; NA, not applicable; Ref., reference group. aData sources: Arizona State Trauma Registry and Arizona Department of Health Services, Health Status and Vital Statistics database.
bPopulation denominators are the combined Arizona population estimates for 2011 and 2012.
cAdjusted for age and rural/urban location of injury; location based on county in which injury occurred. Four counties (Maricopa, Pima, Pinal, and Yuma) were classified as urban and the remaining 11 counties were classified as rural.
dThe adjusted rates were calculated using the direct method of standardization with the combined 2011 and 2012 Arizona population denominators serving as the standard population.
ePatients who identified Hispanic as their ethnicity were classified as Hispanic regardless of their race.
We identified 9,076 deaths from traumatic injury. Because of missing data on age or race/ethnicity, 208 deaths (2.3%; 208/9,076) were excluded from analysis; the final analytical sample was 8,868. The rate of traumatic injury mortality was higher among AI/ANs (n = 716; aR = 95; RR = 1.31, 95% CI = 1.28, 1.35) and lower among AA/PIs (n = 105; aR = 37; RR = 0.52, 95% CI = 0.50, 0.53) and Hispanic people (n = 1,619; aR = 52; RR = 0.72, 95% CI = 0.70, 0.74) than among white people (n = 6,119; aR = 72) (Table 2).
Crude and adjusted rates of traumatic injury mortality per 100,000 residents, by race/ethnicity, Arizona, 2011-2012a
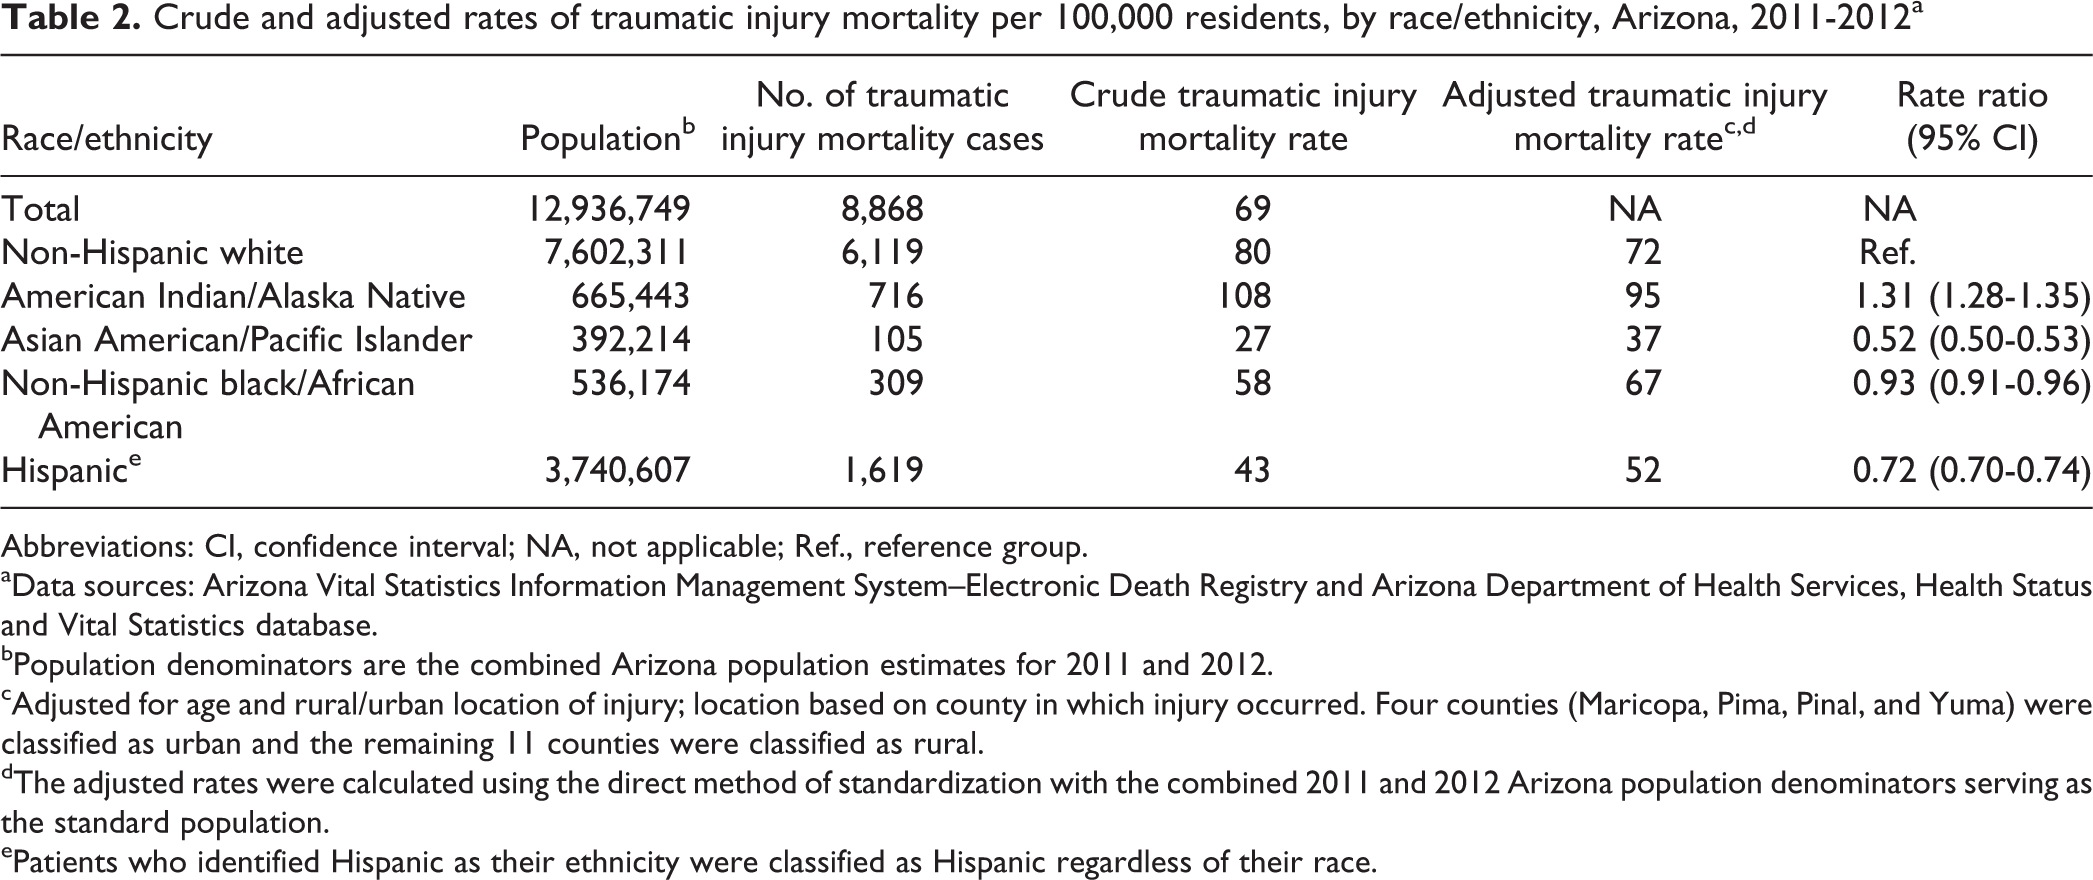
Abbreviations: CI, confidence interval; NA, not applicable; Ref., reference group. aData sources: Arizona Vital Statistics Information Management System–Electronic Death Registry and Arizona Department of Health Services, Health Status and Vital Statistics database.
bPopulation denominators are the combined Arizona population estimates for 2011 and 2012.
cAdjusted for age and rural/urban location of injury; location based on county in which injury occurred. Four counties (Maricopa, Pima, Pinal, and Yuma) were classified as urban and the remaining 11 counties were classified as rural.
dThe adjusted rates were calculated using the direct method of standardization with the combined 2011 and 2012 Arizona population denominators serving as the standard population.
ePatients who identified Hispanic as their ethnicity were classified as Hispanic regardless of their race.
Of the 58,034 cases of traumatic injury, alcohol use was not documented in the ASTR for 2,409 (3.5%) cases; these cases were excluded from alcohol-related analyses. The rate of alcohol-related traumatic injury was almost six times higher among AI/ANs (n = 3,235; aR = 364; RR = 5.62, 95% CI = 5.49, 5.76) than among white people (n = 4,891; aR = 65). The rate of alcohol-related traumatic injury was significantly higher among black people (n = 497; aR = 85; RR = 1.31, 95% CI = 1.28, 1.35) and significantly lower among AA/PIs (n = 43; aR = 11; RR = 0.17, 95% CI = 0.16, 0.18) than among white people (Table 3).
Adjusted rates of alcohol-related traumatic injury per 100,000 residents, by race/ethnicity, Arizona, 2011-2012a
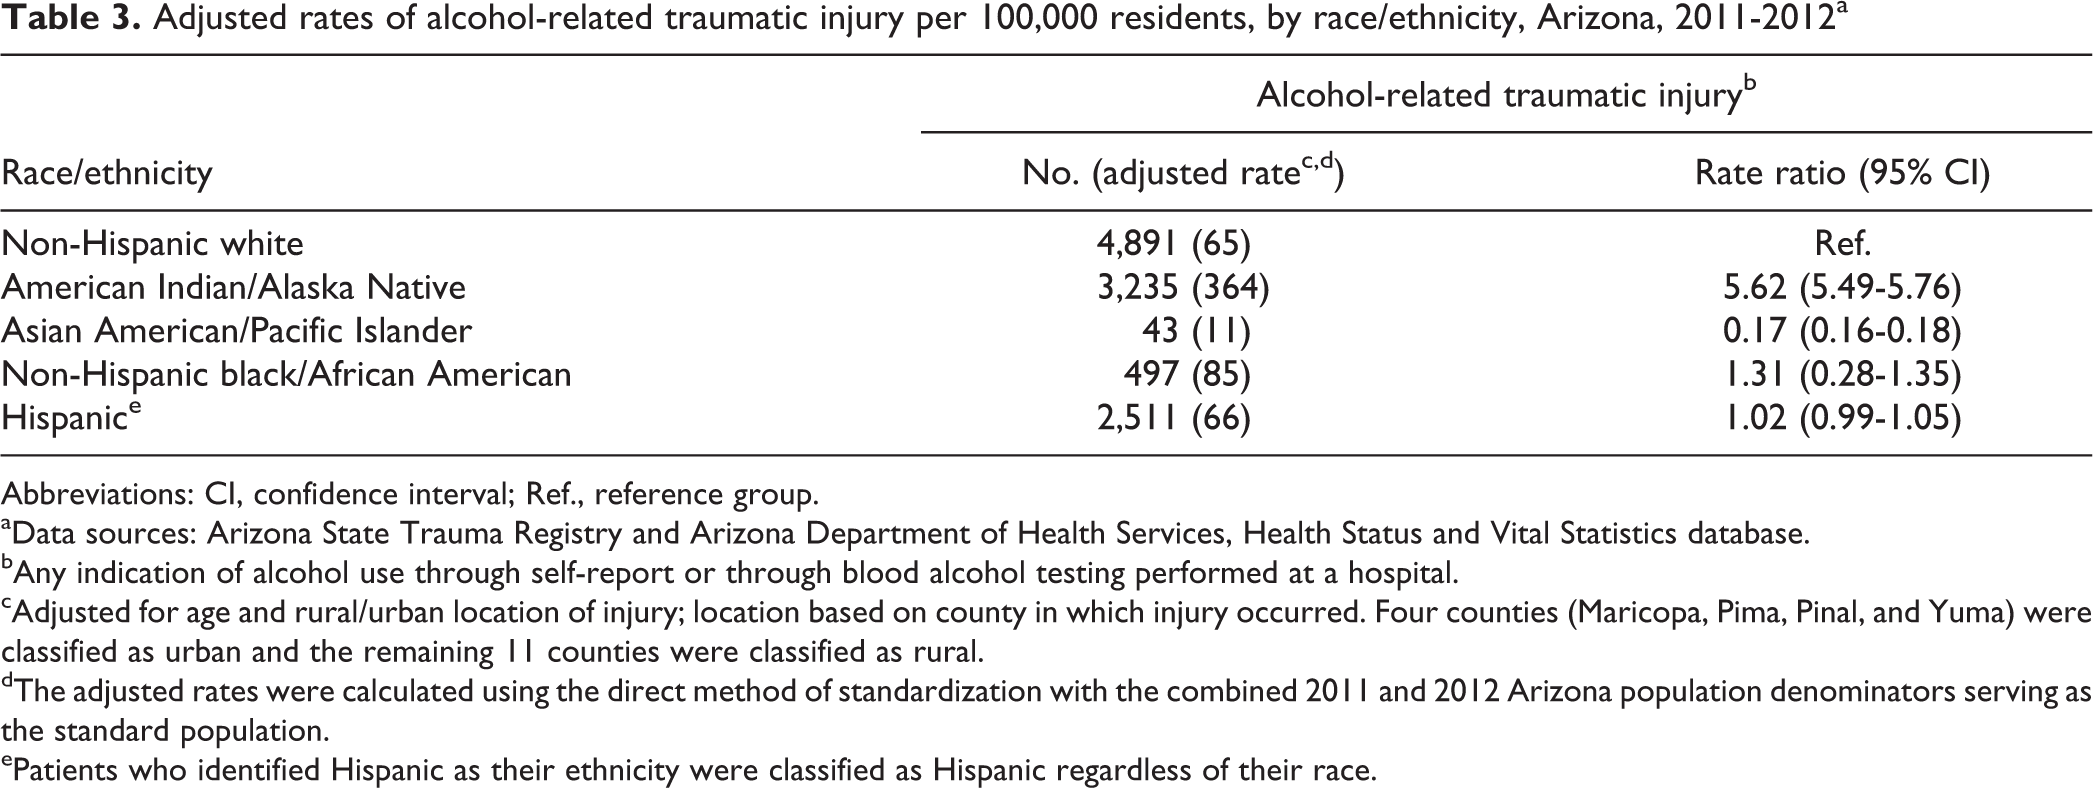
Abbreviations: CI, confidence interval; Ref., reference group. aData sources: Arizona State Trauma Registry and Arizona Department of Health Services, Health Status and Vital Statistics database.
bAny indication of alcohol use through self-report or through blood alcohol testing performed at a hospital.
cAdjusted for age and rural/urban location of injury; location based on county in which injury occurred. Four counties (Maricopa, Pima, Pinal, and Yuma) were classified as urban and the remaining 11 counties were classified as rural.
dThe adjusted rates were calculated using the direct method of standardization with the combined 2011 and 2012 Arizona population denominators serving as the standard population.
ePatients who identified Hispanic as their ethnicity were classified as Hispanic regardless of their race.
AI/ANs had the highest rates of traumatic injury and AA/PIs had the lowest rates of traumatic injury by intent. The rate of homicide/assault-related traumatic injury was almost seven times higher among AI/ANs (n = 2,170; aR = 221; RR = 6.68, 95% CI = 6.47, 6.90) and three times higher among black people (n = 677; aR = 109; RR = 3.29, 95% CI = 3.18, 3.40) than among white people (n = 2,632; aR = 33). Hispanic people had a significantly lower risk of suicide/self-inflicted traumatic injury (n = 223; aR = 6; RR = 0.67, 95% CI = 0.61, 0.74) than white people (n = 623; aR = 8) (Table 4).
Adjusted rates of traumatic injury per 100,000 residents, by race/ethnicity and by intenta of injury, Arizona, 2011-2012b
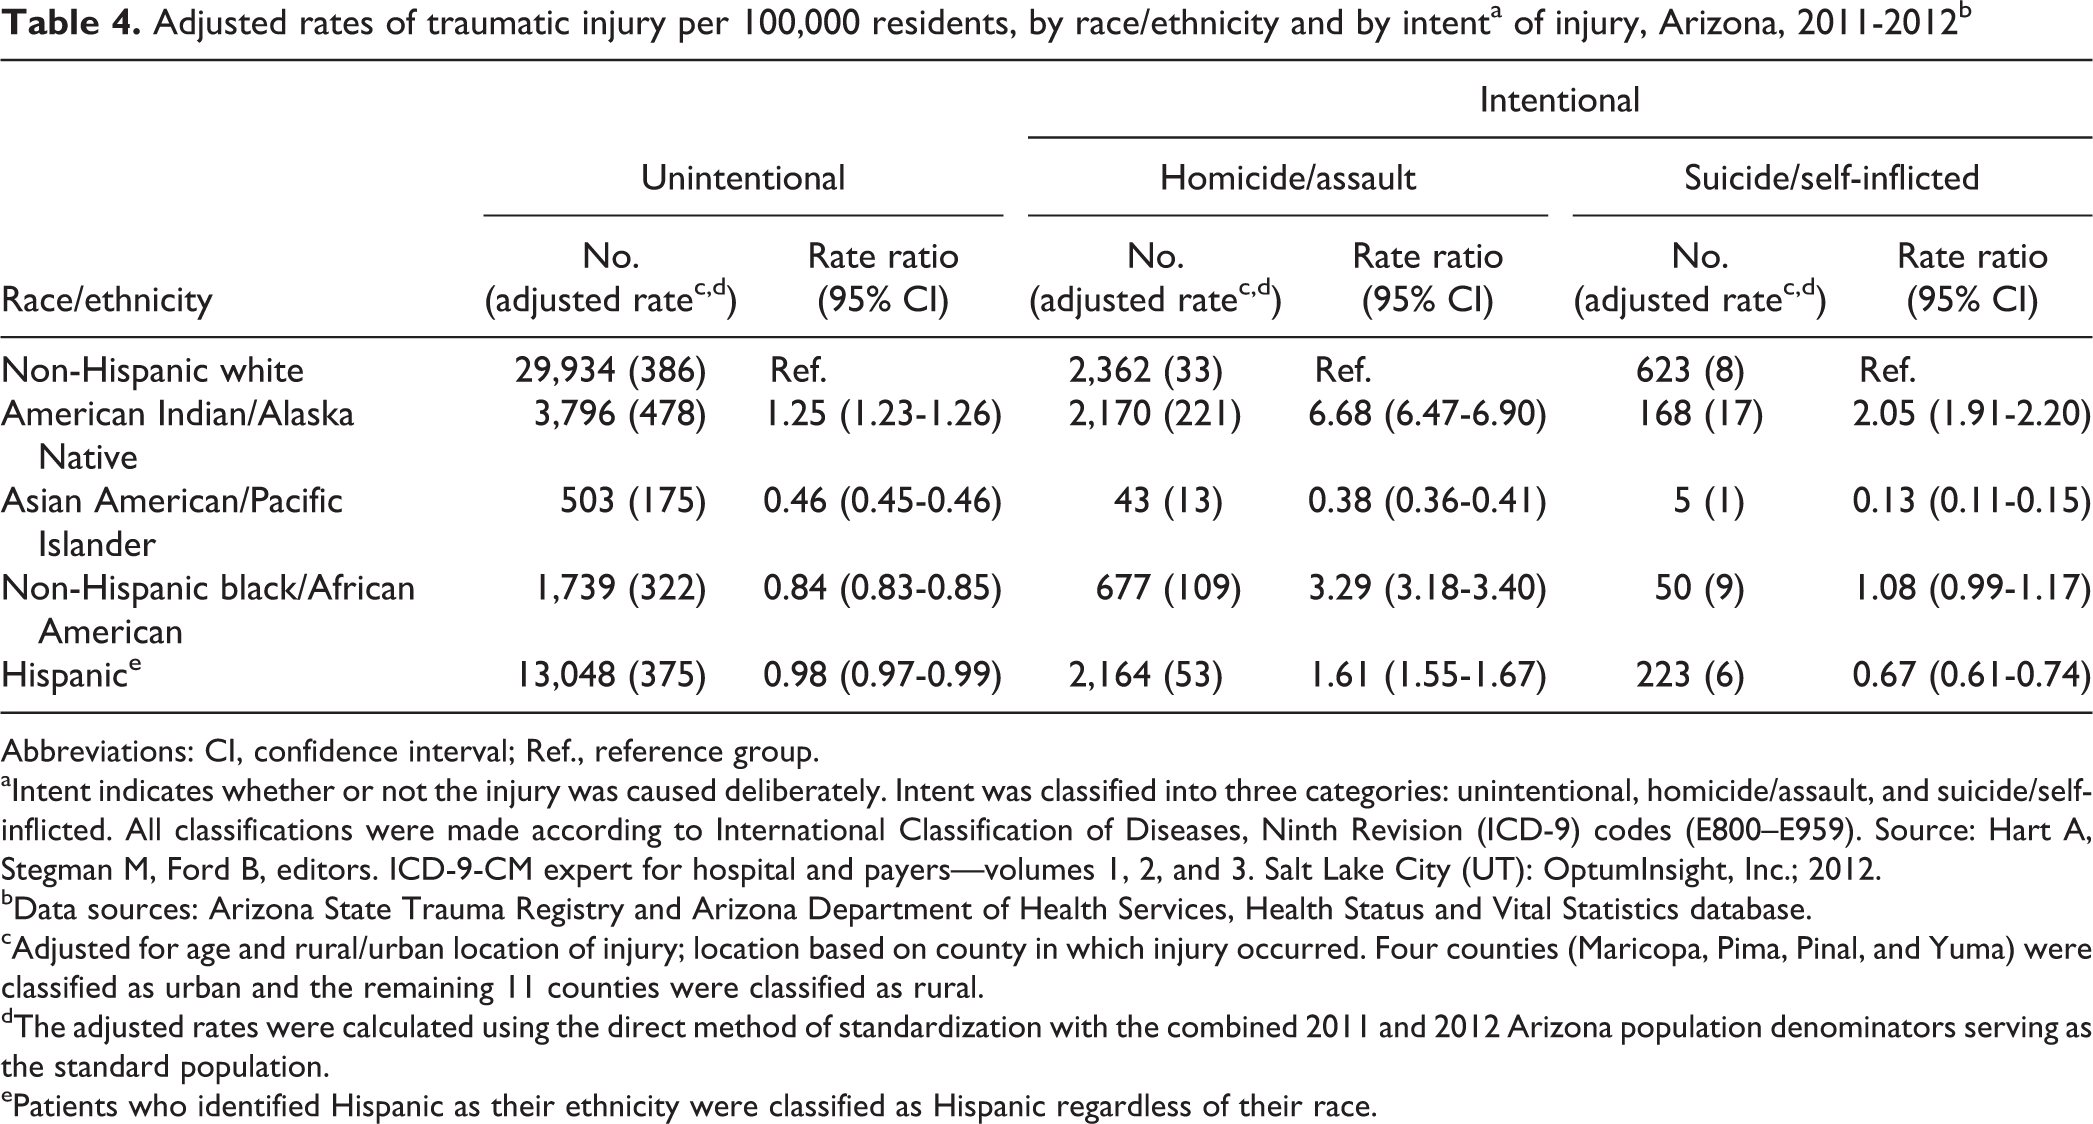
Abbreviations: CI, confidence interval; Ref., reference group. aIntent indicates whether or not the injury was caused deliberately. Intent was classified into three categories: unintentional, homicide/assault, and suicide/self-inflicted. All classifications were made according to International Classification of Diseases, Ninth Revision (ICD-9) codes (E800–E959). Source: Hart A, Stegman M, Ford B, editors. ICD-9-CM expert for hospital and payers—volumes 1, 2, and 3. Salt Lake City (UT): OptumInsight, Inc.; 2012.
bData sources: Arizona State Trauma Registry and Arizona Department of Health Services, Health Status and Vital Statistics database.
cAdjusted for age and rural/urban location of injury; location based on county in which injury occurred. Four counties (Maricopa, Pima, Pinal, and Yuma) were classified as urban and the remaining 11 counties were classified as rural.
dThe adjusted rates were calculated using the direct method of standardization with the combined 2011 and 2012 Arizona population denominators serving as the standard population.
ePatients who identified Hispanic as their ethnicity were classified as Hispanic regardless of their race.
After stratifying blunt traumatic injury by mechanism, AI/ANs had the highest rates of traumatic injury for all four mechanisms of blunt traumatic injury; the greatest disparity between AI/ANs (n = 1,279; aR = 124; RR = 4.01, 95% CI = 3.87, 4.15) and white people (n = 2,204; aR = 31) was for the “struck by/against” category. Black people had a significantly lower rate of falls (n = 356; aR = 71; RR = 0.61, 95% CI = 0.59, 0.62) than white people (n = 10,127; aR = 118) but a higher rate for the “struck by/against” category (n = 318; aR = 54; RR = 1.75, 95% CI = 1.68, 1.81) than white people (n = 2,204; aR = 31) (Table 5).
Adjusted rates of traumatic injury per 100,000 residents, by race/ethnicity, for traumatic injury caused by blunt mechanism,a Arizona, 2011-2012b
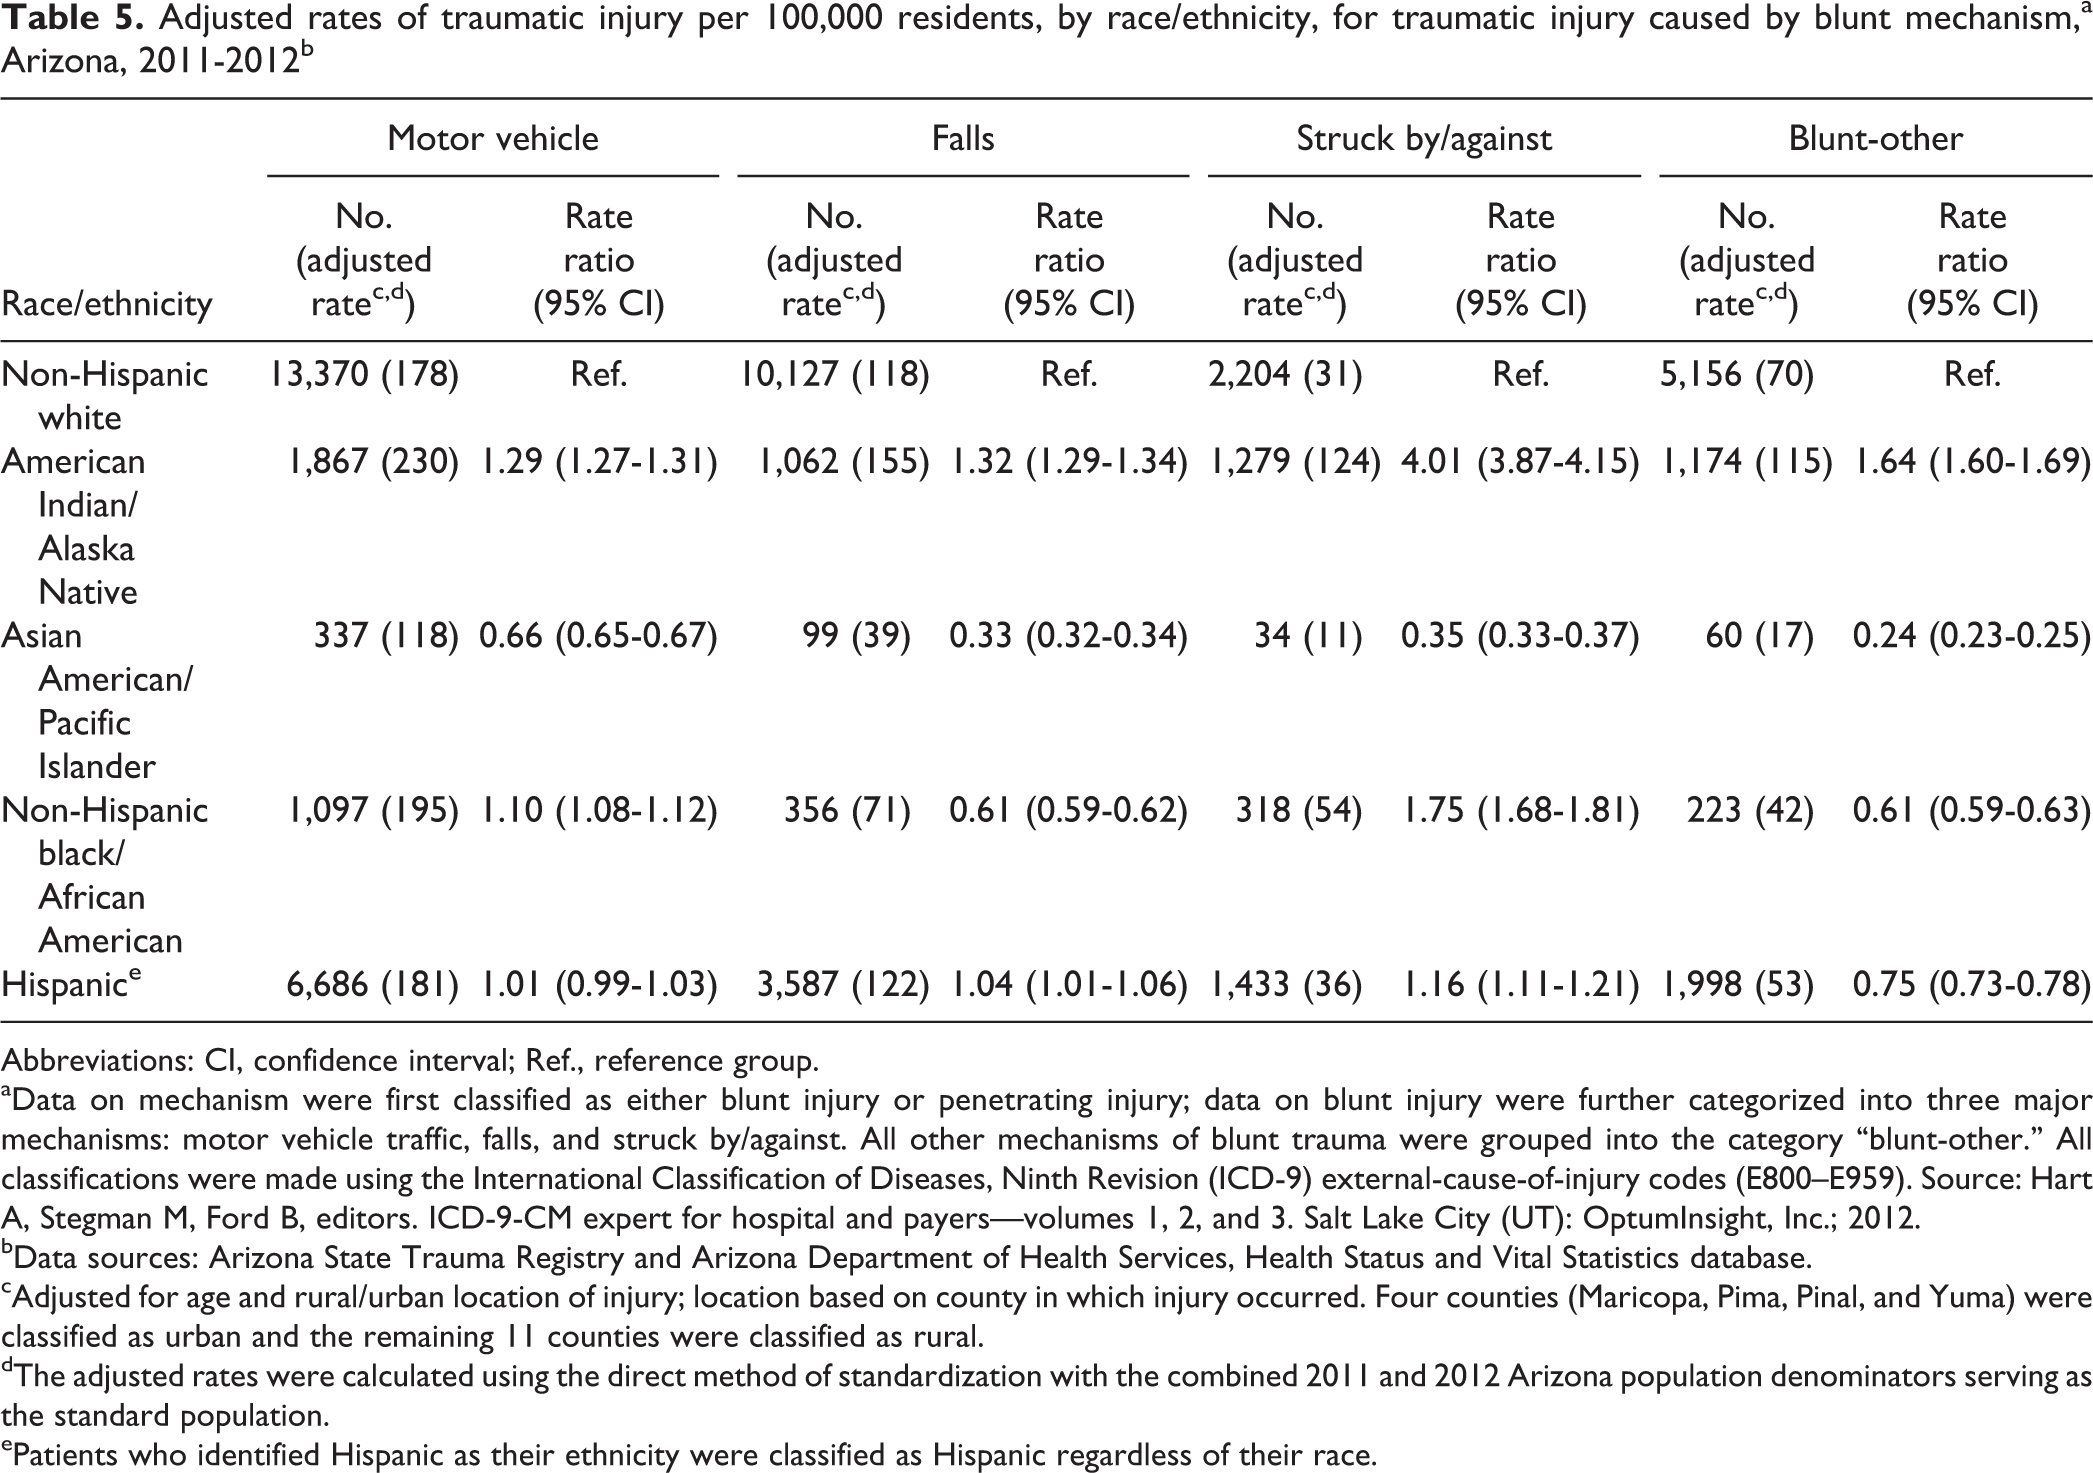
Abbreviations: CI, confidence interval; Ref., reference group. aData on mechanism were first classified as either blunt injury or penetrating injury; data on blunt injury were further categorized into three major mechanisms: motor vehicle traffic, falls, and struck by/against. All other mechanisms of blunt trauma were grouped into the category “blunt-other.” All classifications were made using the International Classification of Diseases, Ninth Revision (ICD-9) external-cause-of-injury codes (E800–E959). Source: Hart A, Stegman M, Ford B, editors. ICD-9-CM expert for hospital and payers—volumes 1, 2, and 3. Salt Lake City (UT): OptumInsight, Inc.; 2012.
bData sources: Arizona State Trauma Registry and Arizona Department of Health Services, Health Status and Vital Statistics database.
cAdjusted for age and rural/urban location of injury; location based on county in which injury occurred. Four counties (Maricopa, Pima, Pinal, and Yuma) were classified as urban and the remaining 11 counties were classified as rural.
dThe adjusted rates were calculated using the direct method of standardization with the combined 2011 and 2012 Arizona population denominators serving as the standard population.
ePatients who identified Hispanic as their ethnicity were classified as Hispanic regardless of their race.
The rate of firearm-related traumatic injury was nearly four times higher among black people (n = 265; aR = 40; RR = 3.82, 95% CI = 3.60, 4.05) and the rate of cut/pierce traumatic injury was more than five times higher among AI/ANs (n = 586; aR = 72; RR = 5.36, 95% CI = 5.10, 5.64) than among white people (Table 6).
Adjusted rates of traumatic injury per 100,000 residents, by race/ethnicity, for traumatic injury caused by penetrating mechanism,a Arizona, 2011-2012b
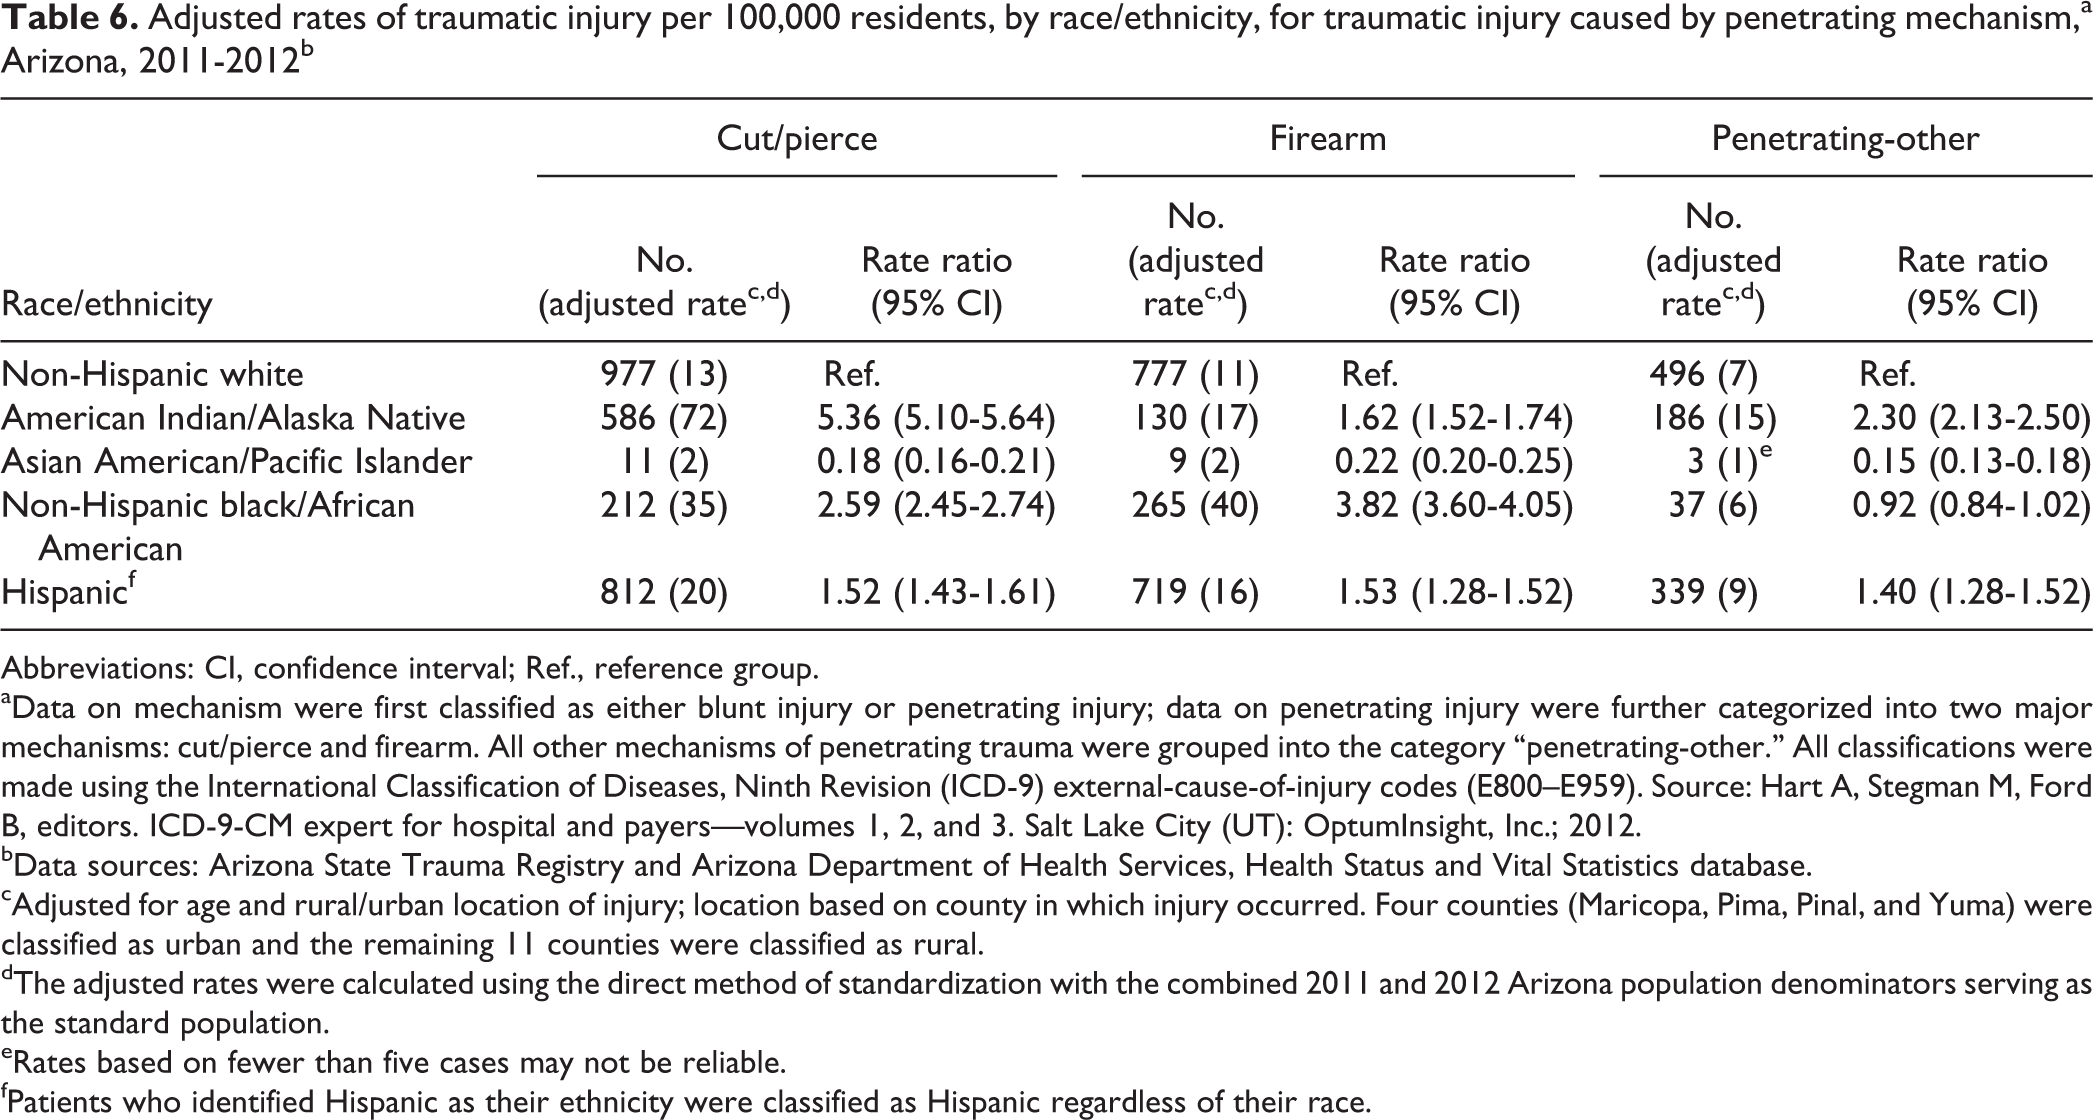
Abbreviations: CI, confidence interval; Ref., reference group. aData on mechanism were first classified as either blunt injury or penetrating injury; data on penetrating injury were further categorized into two major mechanisms: cut/pierce and firearm. All other mechanisms of penetrating trauma were grouped into the category “penetrating-other.” All classifications were made using the International Classification of Diseases, Ninth Revision (ICD-9) external-cause-of-injury codes (E800–E959). Source: Hart A, Stegman M, Ford B, editors. ICD-9-CM expert for hospital and payers—volumes 1, 2, and 3. Salt Lake City (UT): OptumInsight, Inc.; 2012.
bData sources: Arizona State Trauma Registry and Arizona Department of Health Services, Health Status and Vital Statistics database.
cAdjusted for age and rural/urban location of injury; location based on county in which injury occurred. Four counties (Maricopa, Pima, Pinal, and Yuma) were classified as urban and the remaining 11 counties were classified as rural.
dThe adjusted rates were calculated using the direct method of standardization with the combined 2011 and 2012 Arizona population denominators serving as the standard population.
eRates based on fewer than five cases may not be reliable.
fPatients who identified Hispanic as their ethnicity were classified as Hispanic regardless of their race.
Discussion
Of disparities in traumatic injuries between Arizona’s non-Hispanic white population and four racial/ethnic minority populations, we found the greatest disparities for AI/ANs. Compared with white people, AI/ANs had higher rates of traumatic injury across all mechanisms and intents of injury. These results are similar to those found by Sugarman and Grossman 6 ; however, their study was limited to an urban population. Other studies also found higher rates of traumatic injury among AI/ANs; however, most of these studies were limited to unintentional traumatic injury, namely motor vehicle traffic accidents. 9,10,12 Although we found high rates of unintentional traumatic injury among the AI/AN population, we observed the biggest differences for homicide/assault and suicide/self-inflicted intents. The most frequently used mechanisms of homicide/assault among AI/ANs were struck by/against and cut/pierce. The other important finding was that the rate of alcohol-related traumatic injury was six times higher among AI/ANs than among white people. The relationship between alcohol and traumatic injury is well established. 23 –26 Even though the two largest AI reservations in Arizona prohibit the sale and possession of alcohol, our findings suggest the issue persists. Alcohol abuse and intentional traumatic injuries should be a focus when developing prevention programs among AI/AN people.
The rates of intentional and alcohol-related traumatic injuries among black people were lower than the rates of AI/AN people but higher than the rates of white people. Firearms were the most frequently used mechanism of homicide/assault among black people, which is consistent with the findings of Sugarman and Grossman. 6 Although rates of intentional traumatic injury were high among both AI/ANs and black people, the mechanisms of injury differed. Our study also found disparities in traumatic injury among other racial/ethnic groups. Although the rates of traumatic injury by firearm and cut/pierce among Hispanic people were lower than among AI/ANs and black people, they were higher compared with white people. White people had higher rates of unintentional traumatic injury compared with all racial/ethnic groups except AI/ANs, and AA/PIs had the lowest rates of traumatic injury for all mechanisms and intents. These disparities persisted even when considering rural/urban location of injury, an access-related factor. These results suggest that race/ethnicity-specific intent and mechanism of injury are important factors to consider when addressing the burden of traumatic injury.
The findings of this study on racial/ethnic disparities can be used to develop culturally competent traumatic injury prevention programs that are targeted to the unique needs of each racial/ethnic group. In the past, these programs have been successful in reducing the number of cases of traumatic injury. For example, Chicago’s Ceasefire program targets urban young people who have high rates of traumatic injury caused by the intentional use of firearms. This program uses evidence-based, culturally competent interventions that are specific to each racial/ethnic group. The program takes into account the violence-related beliefs, attitudes, and values of each culture and has prevented homicides and nonfatal shootings in Chicago’s highest risk neighborhoods. 27
Limitations
This analysis had several limitations. Although the ASTR is a robust data source that collects data from all rural and urban trauma centers in Arizona, the registry is limited to data on patients who are transported to hospitals that participate in Arizona’s trauma system. The rates of traumatic injury may be underestimated because data for patients who died on scene or were transported to nonparticipating hospitals or out of state were not included in our analysis. Additionally, cases of traumatic injury may have been misclassified as rural or urban because they were defined using the county of injury, whereas population denominators were defined using county of residence. Lastly, individuals who identified their ethnicity as Hispanic were classified as Hispanic regardless of their race, which may have led to underestimated rates of traumatic injury for some racial/ethnic groups.
Conclusion
The rates of traumatic injury were higher among racial/ethnic minority groups in Arizona than among the white population during the study period. The greatest disparities between racial/ethnic minority groups and white people were observed for intentional traumatic injuries—the categories “struck by/against,” “firearm,” and “cut/pierce”—as well as alcohol-related and suicide/self-inflicted traumatic injuries. These disparities necessitate the development of culturally competent traumatic injury prevention programs. Trauma centers, emergency medical service providers, and injury prevention professionals need to understand the health-related beliefs, attitudes, and practices of the populations they serve to overcome the barriers that preclude treatment, follow-up, and long-term prevention of trauma-related injury.
Footnotes
Declaration of Conflicting Interests
The authors declared no potential conflicts of interest with respect to the research, authorship, and/or publication of this article.
Funding
The authors received no financial support for the research, authorship, and/or publication of this article.