
Abstract
It has long been recognized that temperament contributes to different abilities of people to succeed in school. The earlier studies identified a consistent association of higher school achievements with temperament traits related to sustained attention, intelligence and positive emotionality. This study used two cultural samples and the neuroscience-based temperament test (Structure of Temperament Questionnaire-Compact, STQ-77-C3), to examine the associations between temperament and 2nd and 3rd years school grades in more detail. The results showed that estimated grades in Canadian sample (N = 180, M/F = 95/85) and documented grades in eight subjects in Russian sample (N = 109, M/F = 51/58) supported the earlier findings of positive associations between the grades and temperament traits related to sustained attention and intelligence. However, our results showed a much more differentiated pattern of temperament-grades associations. Contrarily to expectations, the Satisfaction scale measuring emotional valence showed no significant (at p < 0.01) effects in both samples. The Neuroticism scale measuring dispositional behavioural alertness and avoidance of uncertainty negatively correlated with the grades in Mathematics and Science/Environment in both samples but not with other school subjects. Social Tempo had high correlations with documented grades across all subjects, whereas Social Endurance had a significant correlation only with Art in the sample that used documented grades. There was also a differential pattern of temperament-grades associations for Sensation Seeking versus Probabilistic Processing scales. Our results, therefore, highlight the benefits of using the STQ-77-C3 (text provided in this paper) for a subtle differentiation of children’s temperament profiles, to ensure a personalized approach in educational settings.
Introduction
Earlier Studies Identified Several Associations Between Temperament and School Grades
It has been long recognized that there are biologically-based differences that contribute to different abilities of learners to learn the same material, follow the same instructions and adjust to educational settings. These differences, called “temperament”, are noted in learning and self-regulatory abilities not only in humans but also in animals. Multiple temperament models were offered first in Europe and then in North America starting from Hippocrates and Galen 2,500 years ago. Types and nature of temperaments promised predictability of behaviour in various settings, especially education. This topic, therefore, became one of the frontier subjects of discussions with the birth of psychology as a science in the 20th century (see are view of temperament theories in Trofimova, 2016).
The impact of temperament on schooling has been intensely investigated in the past 50 years. However, due to the diversity of measures of temperament and arbitrary designs of these measures, comparison of results was difficult, with an inevitable preference for North American models by North American authors and European models by Europeans. The three most common findings in studies of temperament-grades associations in educational settings are: sustained attention (known as temperament traits of Persistence (Cyniak-Cieciura et al., 2018; Martin & Holbrook, 1985), Intellectual Ergonicity (Rusalov, 2018), Effortful Control (Rothbart et al., 2000), or Mental Endurance (Trofimova, 2016, 2019), as well as impulse control and intelligence are associated with higher grades whereas negative emotionality is associated with lower grades (Fernández-Vilar & Carranza, 2012; Li et al., 2009; Martin & Holbrook, 1985; Nasvytienė & Lazdauskas, 2021). Interestingly, when compared to intelligence, temperament traits (named as “activity”, “adaptability”, “approach-withdrawal”, “distractibility”, and “persistence”) appeared to be a stronger factor in children’s achievements even than their intelligence (Martin & Holbrook, 1985).
Moreover, it has been recognized that grades might not be as objective measures of children’s learning in classrooms as it was initially thought. It appeared that the factor of convenience in dealing with obedient children entangled with the teacher’s grading of their work (Bramlett et al., 2000; Keogh, 2003; Mullola et al., 2010). It is natural for human beings to feel more respected and make less effort to teach children who are more disciplined and pay close attention to instructions, and teachers are not an exception. If so, then there is a danger of grades reflecting not only the level of learned knowledge but the discipline of the students.
Screening children for temperament has become more and more popular in schools as part of a personalised approach in education. This approach acknowledges that people, especially children, are not capable of changing their temperament (biologically based traits), but temperament affects their learning style and efficiency. Therefore, having a compact, neuroscience-based temperament screening tool might assist educators and parents in knowing the most consistent traits of the child, especially when the child struggles in school. This study investigated the ability of such a tool to identify any new details in the association between temperament and school grades in early school children.
A Choice of a Temperament Test for Studies: Following the Neurochemical Science
Temperament traits emerge early in life and have considerable individual consistency as compared to other individual attributes such as personality (Rusalov, 2018; Strelau, 1998); however they express themselves differently at different ages. It is important, therefore, to have psychometric instruments assessing children at different stages of their development but still maintaining the consistent variables enabling comparisons across different stages of life. Moreover, for educational, international and cross-cultural projects, investigating the contributions of biologically-based traits to the educational behaviour of learners, it is important to have neuroscience-based tests of temperament that are adapted to multiple languages.
The North American tradition in studying temperament is known for its strong focus on child temperament and models that are primarily based on observations of parents. The impact of “goodness of fit” on child temperament within the family environment was underlined in the Thomas and Chess study of children, which also used empirically derived indicators of temperament (Chess & Thomas, 1996). Following this trend in developmental psychology, several tests have emerged based on the parents’ assessments of their toddlers. These tests for infants were then used as the bases for adult versions (see, for example, Rothbart et al., 2000).
In our current study, we used the Structure of Temperament Questionnaire – Compact (STQ-77), which, unlike other temperament tests, was initially developed from neurophysiological studies on adults and only then was adapted to children of several age groups. The STQ-77 assesses 12 temperament traits as a comprehensive list of traits, which all other temperament models could be matched to.
Also, unlike any other temperament test, the STQ-77 is based on neuroscience - the neurochemical framework Functional Ensemble of Temperament (FET). Neurochemical biomarkers are relevant because the original concept of temperament refers to (neuro)chemically-based individual differences in behavioural regulation, which are present both in pre-cultural individuals (animals, infants) and adult humans (Trofimova, 2016, 2021a, 2022). The FET summarizes the functionality of neurotransmitters, hormones and opioid receptor systems, grouping temperament components according to 12 universal functional aspects of behaviour (Trofimova, 2019, 2021b, 2022; Trofimova & Gaykalova, 2021; Trofimova & Robbins, 2016). All twelve aspects of behavioural regulation highlighted in this framework appeared to be regulated by well-identified neuroanatomic and neurochemical biomarkers (Trofimova, 2021a; Trofimova & Gaykalova, 2021).
The STQ-77 is a derivative of the earlier version of the STQ, which structure was derived from electrophysiological studies of adult temperament (Rusalov & Trofimova, 2007; Rusalov, 1989, 2018). The STQ-77, therefore, inherited several scales and items from that early version and was first developed in English. Evidence for the construct, concurrent and discriminatory validity of the English, Russian, Chinese, Portuguese, and Polish versions of the STQ was demonstrated during the past 32 years through significant correlations with internationally known scales, such as the Eysenck Personality Questionnaire (Rusalov, 1989; Trofimova & Araki, 2022), the Beck Anxiety Inventory (Trofimova & Sulis, 2010, 2016a, 2018); the Five Factor Inventory of personality (Araki & Trofimova, 2021; Trofimova, 2010; Trofimova & Araki, 2023); the Pavlovian Temperamental Survey (Strelau et al., 1999; Trofimova, 2009; Trofimova & Araki, 2022); the I7 Impulsiveness Questionnaire (I–7) (Trofimova & Sulis, 2011); Zuckerman’s Sensation Seeking Scale (Araki & Trofimova, 2021; Trofimova, 2010; Trofimova & Araki, 2023); the Hamilton Depression Inventory (Trofimova & Sulis, 2010, 2016b, 2018); Personality Assessment Inventory (Trofimova & Christiansen, 2016); empathy and polymathy measures (Trofimova & Araki, 2023), estimated high school grades, speed of reading and writing (Trofimova, 2009; Trofimova & Sulis, 2011), time of performance on the verbal classification tasks (Trofimova & Sulis, 2011), symptoms of Generalized Anxiety (Trofimova & Sulis, 2016a), Major Depression (Trofimova & Sulis, 2016b, 2018)), psychotic symptoms (Trofimova & Christiansen, 2016; Zvereva et al., 2021), EEG studies (Rusalov & Trofimova, 2007) and comorbid anxiety and depression (Trofimova & Sulis, 2018).
Several versions of the STQ-77 for children were developed and used from 2004 based on the Extended (150 items) version of the STQ (Rusalov, 2004), including the Russian Pre-School STQ assessing children of 3–6 years old (Age 2) (STQ-R-PS), Early School STQ version for assessing children of 7–11 years old (Age 3) (STQ-R-ES) and Teenager STQ version for testing children of 11–16 years old (Age 4) (STQ-R-T). The Russian Pre-School STQ was validated in two studies using the protocols from the parents of 100 children aged 3–6 and 43 children in 1997–2004 (Rusalov, 2004). The Russian Early School STQ was validated in two different studies using the assessments of 200 and 112 children aged 7–11 (Rusalov, 2004). Rusalov & Galimov (2002) and Vorobyeva et al. (2018) used the Early School version of the STQ for psychogenetic and EEG studies, in combination with measurements of skin galvanic response, photoplesmogram, the Motivation in Achievements Test, TAT, Raven Progressive Matrices, Cattell Intelligence Test GFT2 and Eysenck EPI.
There are five Compact Child STQ-77 versions for assessing children: age group 0–3 (Age 1, Toddler STQ-77-C1), 4–7 (Age 2, Preschool STQ-77-C2), 7-11 (Age 3, Early School STQ-77-C3), 12–15-year-old (Age 4, Early Teenage, STQ-77-C4) and 15–19 (Age 5, Late Teenage, STQ-77-C2). Four first-age versions use adult assessors and are not self-reports. The forms for the STQ-77 are available free of charge (for non-commercial use) on the developers’ website of the STQ (STQ-77, 2007). Trofimova and colleagues reported earlier the psychometric properties of the both versions of the STQ-77-C3 used in this study (Trofimova et al., 2024) showing high reliability and the factor structure consistent with adult versions, especially for the solution with six factors. Trofimova and colleagues used several children versions of the STQ-77 to investigate temperament profiles in two age groups of children with delusional disorders as well as in adolescents with mood disorders (Zvereva et al., 2021).
The motivation to use the STQ-77 in this study over many other published temperament tests for children was, therefore based on four main considerations: (a) the STQ-77 is the only temperament test based on a neurochemical summary (FET) whereas all other tests are derived from parents’ estimations and observations; (b) it has twelve scales, nine of which are not emotionality-related and describe functional aspects of behaviour whereas other tests have fewer and less detailed scales of non-emotionality aspects; (c) having all ages-versions of the STQ-77 helps in longitudinal studies, allowing comparisons of “apples to apples”, i.e., the scores on same twelve scales if individual re-tested later; (d) the STQ-77 is freely available in 24 languages on the developer’s website (STQ-77, 2007) and, therefore more accessible for cross-cultural studies than other tests.
The Aims and the Hypotheses of the Study
This study used two language versions of the Early School STQ-77-C3: Russian (STQ-77Ru-C3) and English (STQ-77En-C3). Both versions could be used for testing children speaking these languages in European and North American countries, especially considering the recent increase in people relocating themselves in Europe and North America.
The main aims and hypotheses of our study were: - To verify the results received by studies using the earlier temperament tests. Our first hypothesis is based on the reports and meta-analytic reviews cited above. It expects that there will be positive associations between the school grades and the STQ-77-C3 scales of Mental Endurance (similar to Effortful Control), Probabilistic Processing (similar to intelligence), and also three emotionality-related scales: Satisfaction (similar to Positive Affect), low Impulsivity (similar to Distractibility) and low Neuroticism (similar to Avoidance and Negative Affect). - Moreover, as our second hypothesis, we expected an activity-specific pattern of correlations in the Canadian sample, where the estimated grades in Physical Education (PhysEd) would have high positive correlations with the scales measuring Motor (Physical) aspects of activity; grades in Social participation would have high positive correlations with the scales of Social aspects, and the grades in Mathematics-Science – with the “probabilistic” scales, such as Mental Endurance, Plasticity and Probabilistic Processing. This hypothesis was based on the results of previous studies using the STQ-77 (Trofimova, 2009; Trofimova & Sulis, 2011), and the activity-specific approach of its structure (Rusalov & Trofimova, 2007; Rusalov, 1989, 2018). - To investigate if the use of the comprehensive, neuroscience-based 12 scales of the STQ-77-C3 can bring additional insights into the differentiation between the patterns of temperament-grades associations.
Method
Samples
The English-speaking sample consisted of 180 participants (parents) assessing their children (M/F of children = 95/85 (53/47%), Mean age in years = 8.66, SD = 1.33). Parents were clients of the Niagara branch of Psychological Services, St. Catherines and Hamilton, Ontario, Canada. Parents completed the intake forms that included the STQ-77En-C3) during registration while reaching out for psychological assessments of their children and volunteers.
In terms of inclusion and exclusion criteria, the protocols were included only if the children and their parents were not diagnosed with a psychiatric disorder or disability. All participating parents had high-school level education and reading skills. All the children were attending school.
The Russian sample consisted of 109 participants (parents) assessing their children (M/F of children = 51/58 (47/53%), Mean age in years = 7.98, SD = 1.23). Children were clients of the Mental Health Research Center under the Federal State Budget Scientific Institution, Moscow, Russia and secondary school students of the Novosibirsk Municipal Budgetary Educational Institution “Secondary school N112”. Novosibirsk sample was also a part of the small longitudinal project called “Temperamentum” but both Russian samples were part of one big integrated project that was managed by the Federal State Budget Scientific Institution, Moscow. None of the children was diagnosed with a psychiatric disorder or disability. All the children were attending school.
Procedures
This study was approved by the Ethics Committee of the Federal State Budget Scientific Institution, Moscow, Russia and the School Board of theNovosibirsk Municipal Budgetary Educational Institution “Secondary school N112”. The approval included using anonymous retrospective records collected previously by Canadian-based Psychological Services over 15 years prior to the beginning of the study. All parent participants in the Russian sample received debriefing and signed an informed consent form permitting their intake forms to be used for the current research. All parents participants in the Canadian sample signed an informed consent form permitting their intake forms to be used for the current research during the intake when they were approaching Psychological Services. In Canadian sample, therefore, the study used an irreversibly de-identified dataset existed before the study, with the consent of participants on record, and relied on the exempt TCPS2 Article 2.5. All parent participants completed a brief biographical questionnaire as well as the STQ-77-C3 and grades estimates regarding their children.
The STQ-77-C3 scale scores were extracted from the intake forms that parents completed in relation to their child, whenever a child was registered for this study. The intake age of children varied from 7 to 11. The collection of these records took place in 2014–2019, and their statistical analysis started in 2022.
In the Russian sample, the documented report cards were collected in 2019 from the school records for each of the nine subjects taught in the 2nd and 3rd years of schooling. Handling of this information followed the privacy laws, with the assignment of a number-based ID to participants and protection of the relevant files. The collected information consisted of the two annual grades based on children’s performance in four terms. The obtaining of the grades records was conducted in many cases retroactively for their performance in grades 2 and 3 when some children were already in grade 5 or 6. These grades were compared to their temperament profiles obtained during their registration with the study, i.e., when they were 7–11 years old.
Similarly, in the Canadian sample, the analysis of the STQ-77-C3 temperament profiles was done retroactively as a review of their intake forms completed in 2016–2022. Moreover, during the study, Canadian parents were asked (either during the intake or during the follow-up interview) to give an estimated average of their child’s actual school grades during the 2nd and 3rd year of school related to three types of subjects.
Statistical processing included the calculations of the descriptive scale statistics (means, SD, confidence intervals) for all measures and reliability coefficients (Cronbach’s alphas) for the STQ-77-C3 scales in both samples. To derive the values on documented grades in the Russian sample, the average was calculated for each subject using the two grades from the 2nd and 3rd years of schooling. Correlations were calculated between the grades and scale scores of the STQ-77-C3 in both samples.
Measures
During Registration in the Study, All Parent Participants Completed the STQ-77-C3 and a Demographic Form Regarding Their Child
Compact Structure of Temperament Questionnaire for Early School children (STQ-77-C3) (Rusalov, 2004; Rusalov & Trofimova, 2007; Trofimova et al., 2024; Attachment 1) has 77 statements, assigned to 12 temperamental scales (6 items each) and the validity scale (5 items) listed below. Subjects respond according to a Likert scale format: “strongly disagree (1),” “disagree (2),” “agree (3),” “strongly agree (4)”. The STQ-77 organizes the 12 temperament scales into four sub-groups:
The Endurance group involves three scales referring to the ability of an individual to sustain prolonged activities: Physical Endurance (ERM), Social Endurance (ERS) or Mental (Intellectual) Endurance (ERI).
The Speed of Integration group involves three scales referring to the speed of composition of actions: Physical Tempo (TMM), the speed of speech and reading and of other verbal activities, Social Tempo (TMS), and the Plasticity scale (PL). The plasticity scale assesses the ability to adapt quickly to changes in situations, to change the program of action, and to shift between different tasks.
The Behavioural Orientation group involves three scales referring to the sensitivity of an individual to three different types of behavioural reinforcers: basic physical sensations and pleasures, as well as their tendency for sensation-seeking and risk-taking behaviour (Sensation Seeking, SS); orientation of actions in response to another person’s emotional state (Empathy, EMP); and the ability of an individual for adequate understanding and expectations of probabilities and causal relationships between events, the efficient extraction and processing of new knowledge (Probabilistic processing, PRO).
The Emotionality group involves three scales referring to a tendency for dispositional approval of events, positive mood, optimism, feeling confident regarding one’s own performance, and unaffected by other people’s warnings and criticism (dispositional Satisfaction, SF); the emotional reactivity, a poor ability to control immediate impulses for actions (Impulsivity, IMP), and a tendency for expectations of negative outcomes, behavioural arousal and low tolerance of uncertainty (Neuroticism, NEU).
Finally, the Validity scale assesses the social desirability bias in the answers, with results within the range of 15–20 on this scale being considered invalid as this indicates a positive impression bias in the responses.
The English version of the STQ-77-C3 is presented in the (optional) Attachment 1, with permission from the developers of this test.
The Annual School Grades for the 2nd and 3rd Year of Schooling
The information about schooling grades as a validation method was used in other studies (Trofimova & Araki, 2026; Trofimova & Sulis, 2011) and showed clear benefits. Schooling is one of most important functional activities of children so schooling grades can be considered as natural experimental evidence of individual differences in performance on specific tasks.
In the Russian sample, the annual documented grades were collected from the report cards as described above. The grades covered all subjects taught in the 2nd and 3rd year of schooling: Language, Literature, Mathematics, Foreign language, Environment, PhysEd, Music, Art and Technology. The information about the grades was accessed, with parents’ consent, from the online data center of the Ministry of Education, to which investigators in this study had access. The grades system varied as: 2 (Failed), 3 (Average), 4 (Good) and 5 (Excellent). In this study, no Failed grades were observed, so the grades varied from 3 to 5. The two annual grades for the 2nd and 3rd years of schooling were summed and averaged, and the average values were processed for correlation with the temperament scores.
In the Canadian sample, annual estimated grades from the 2nd and 3rd year of school were collected from parents’s intake forms asking them to estimate their children’s academic performance. This form was a part of the STQ-77 testing Excel file, which had the last line requiring to fill out three ratings in relation to three types of subjects and activities: (1) athletic, physical, hands-on; (2) social participation and presentations, and (3) mathematics and science. We used the scale 1 to 4 in these estimations in line with the Canadian system of grading: 1 (Below average, or grades in 30–55), 2 (Average, or grades 56–75), 3 (Above average, or grades 76–85) and 4 (High, or grades 86–100). The Excel testing pages were processed during the intake, transforming answers to one line of data, which was subsequently de-identified before transferring to the archival dataset that was used in this study. Each data line included all the answers of the client-participants from the demographic, STQ-77 and grades-related questions. The current English and Russian versions of the STQ-77 available from the developer’s website (STQ-77, 2007) include the question about the estimated grades as a default.
Results
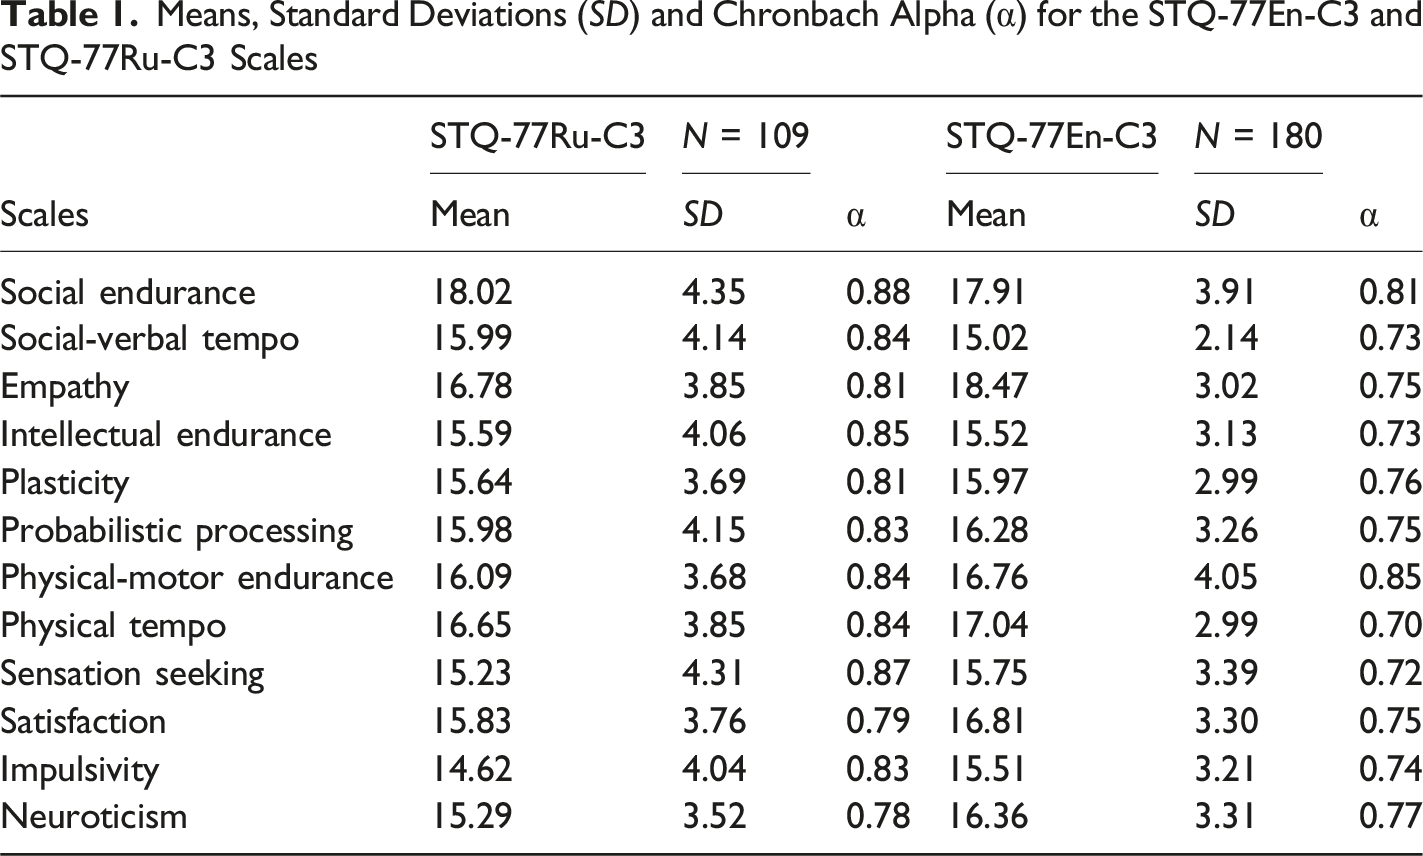
Means, Standard Deviations (SD) and Chronbach Alpha (α) for the STQ-77En-C3 and STQ-77Ru-C3 Scales
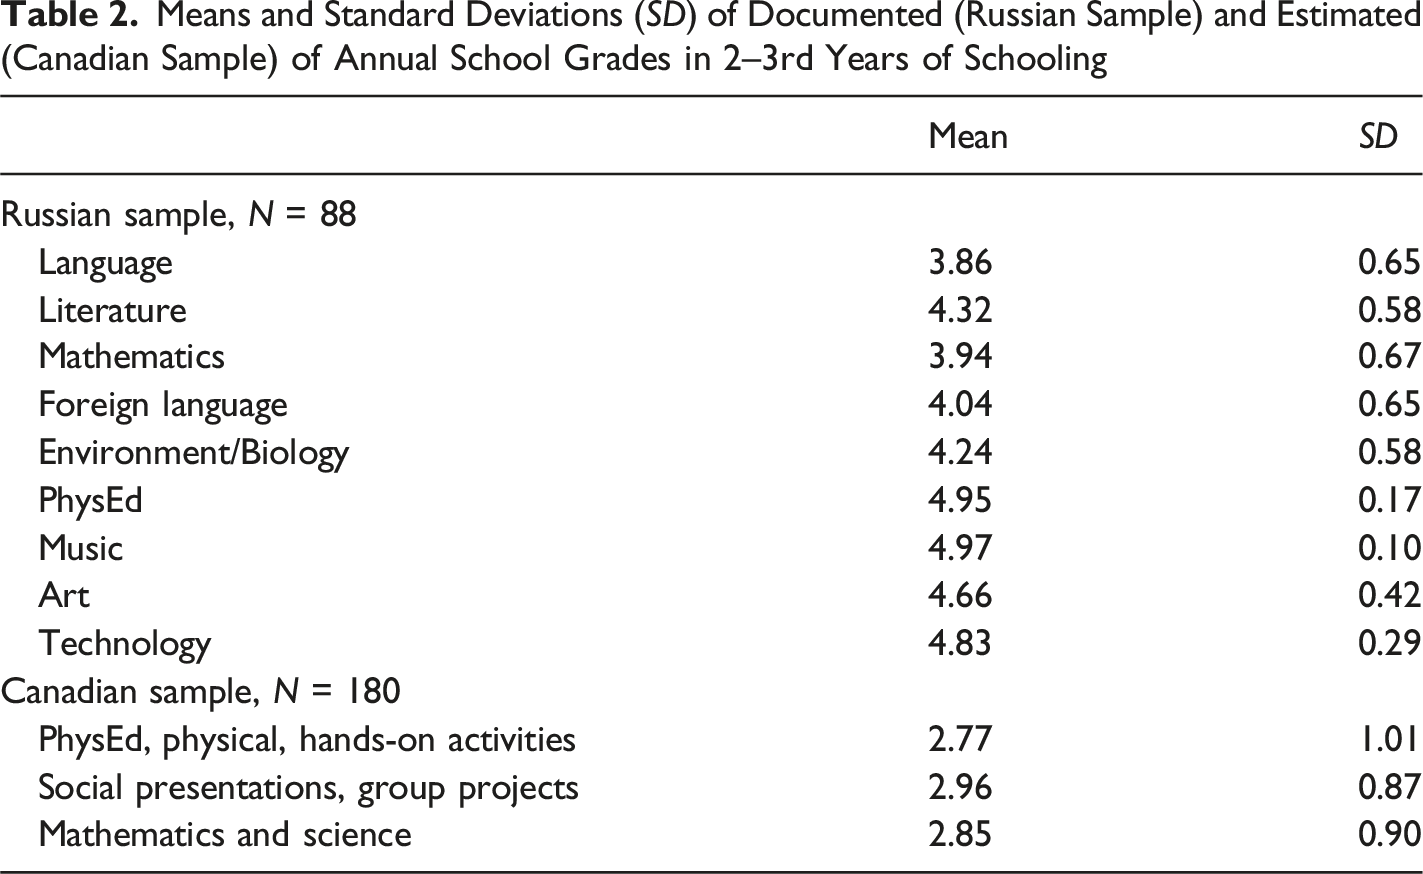
Means and Standard Deviations (SD) of Documented (Russian Sample) and Estimated (Canadian Sample) of Annual School Grades in 2–3rd Years of Schooling
Pearson Linear Correlations Between the Scales of the STQ-77Ru-C3 and Documented Annual Grades of the 2nd and 3rd Year of Schooling in the Russian Sample (N = 109)
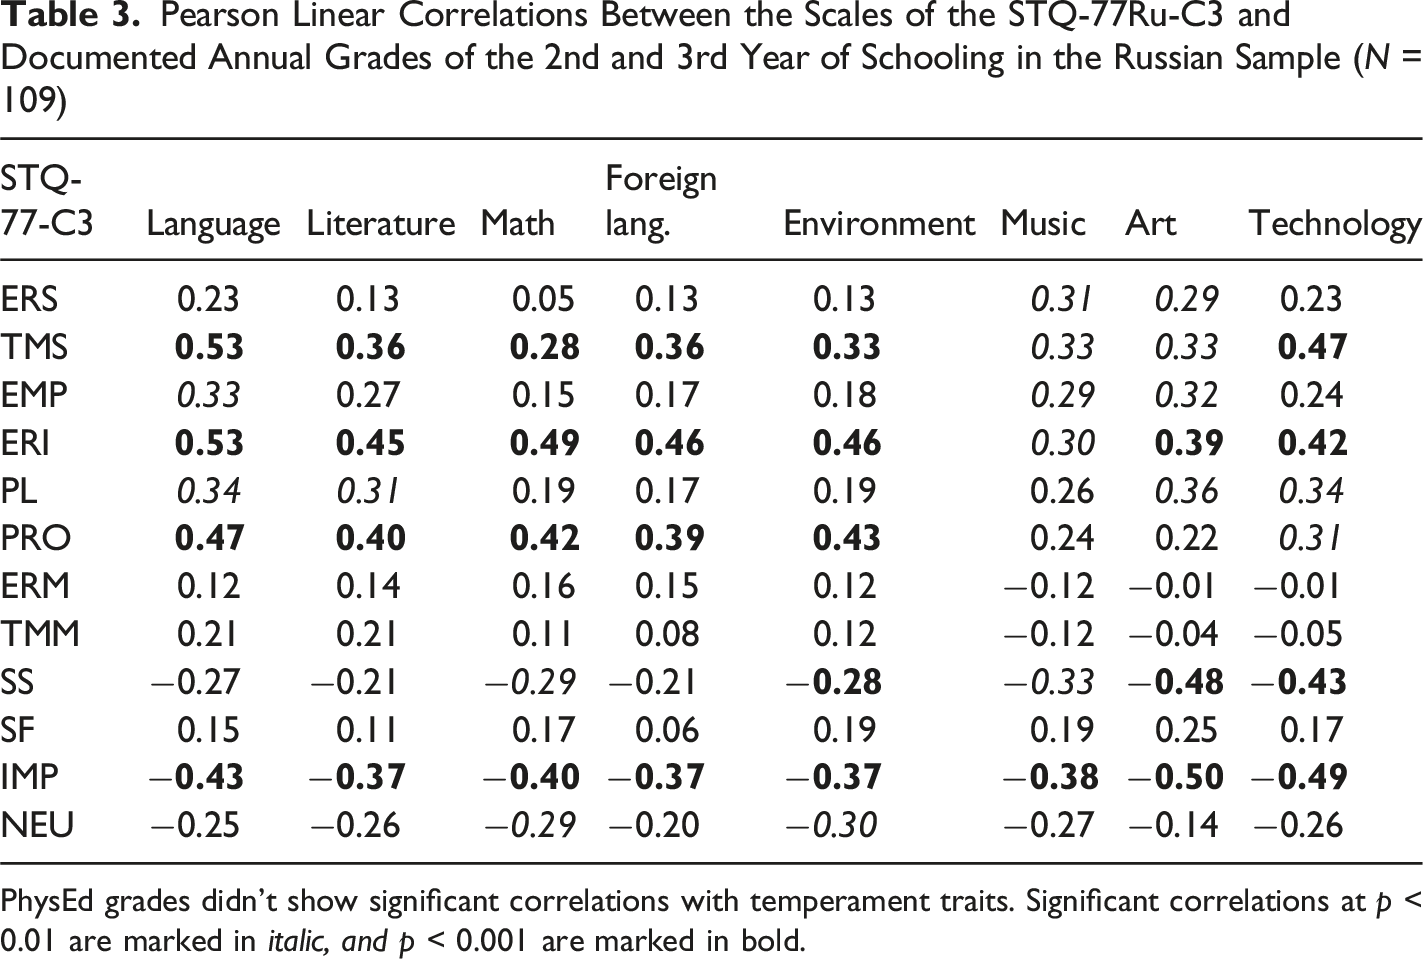
PhysEd grades didn’t show significant correlations with temperament traits. Significant correlations at p < 0.01 are marked in italic, and p < 0.001 are marked in bold.
The Results of Correlational Analysis Between the Scales of the STQ-77En-C3 and the Estimated Grades in the Canadian Sample (N = 180)
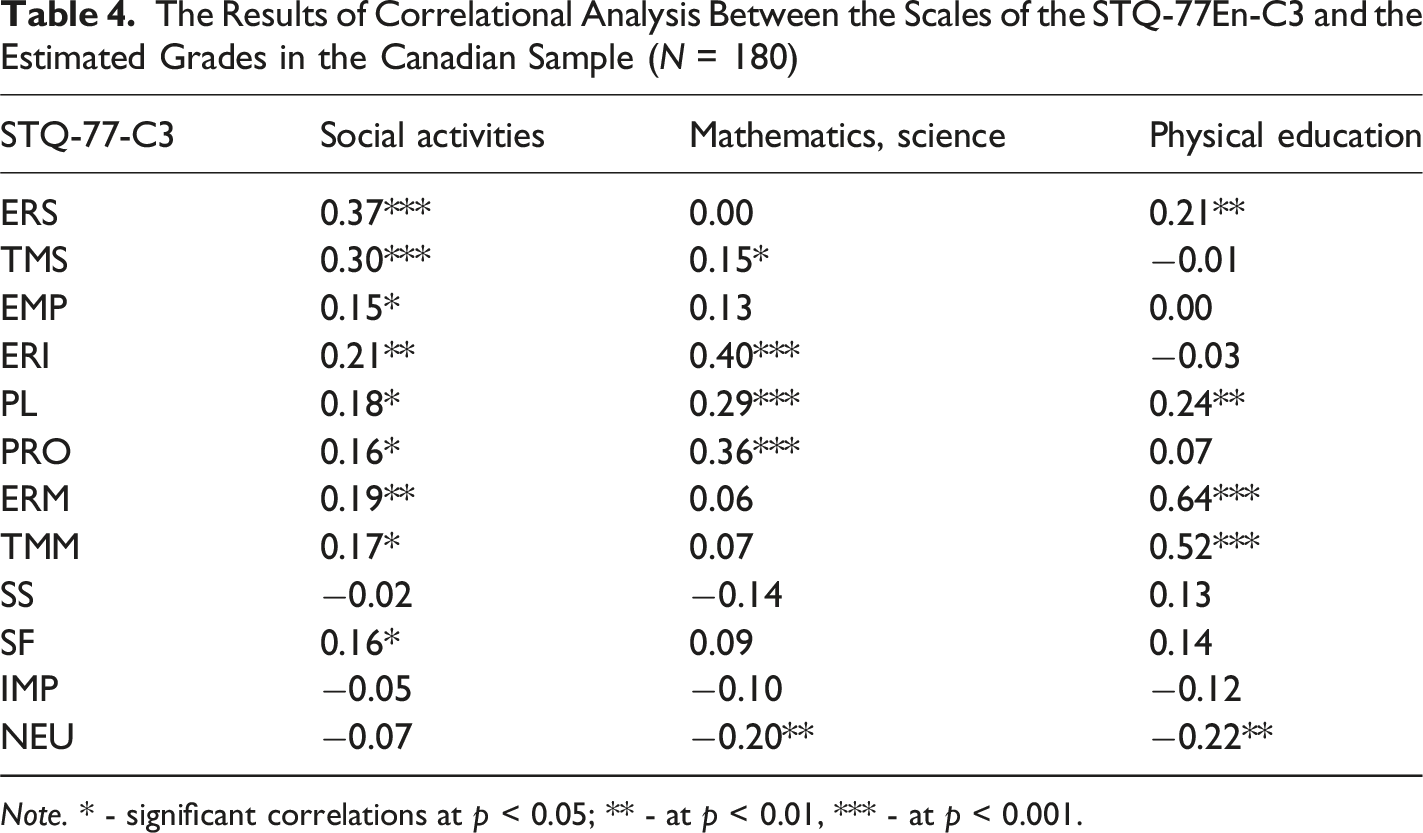
Note. * - significant correlations at p < 0.05; ** - at p < 0.01, *** - at p < 0.001.
Low Sensation Seeking and high Probabilistic Processing had a differential pattern of significant correlations with documented grades. The lower Sensation Seeking was associated with higher grades in Music, Art, Technology and Environment, whereas Probabilistic Processing – with higher grades in more classical subjects, such as Language, Literature, Mathematics, Foreign Language and Environment, all at p < 0.01.
The traits related to positive (dispositional Satisfaction) and negative (Neuroticism) emotionality did not show many significant at p < 0.01 correlations with documented grades in the Russian sample. This was especially true for the Satisfaction scale, which had only one significant at p < 0.05 correlation with the grades on Art. Neuroticism had a negative, significant at p < 0.01 correlation with the grades in Mathematics and Environment and a significant at p < 0.05 correlation with the grades in Language, Literature, Music and Technology (Table 3).
In the Canadian sample, there was an activity-specific pattern significant of correlations, with the grades on the estimated grades in PhysEd having much higher positive correlations with the scales measuring Motor (Physical) Endurance and Motor Tempo, compared to other scales (Table 4). The grades in Social activities had much higher positive correlations with the scales of Social Endurance and Social Tempo compared to different scales. The grades in mathematics and science had higher correlations with the “probabilistic” scales of the STQ-77-C3, such as Mental Endurance, Plasticity and Probabilistic Processing. Other significant at p < 0.01 correlations were found in Social Endurance and Plasticity scales of temperament, correlating with higher estimated grades in Athletic, Physical Endurance and Mental Endurance correlating with higher grades in Social activities.
Similarly to the results in the Russian sample, the scale of positive emotionality (dispositional Satisfaction) did not have significant at p < 0.01 correlations with the grades. Neuroticism had negative correlations with the grades in PhysEd and Mathematics-Science.
Discussion
School psychologists and child social workers would benefit from the screening tools of children’s temperament profiles that not only have a solid neuroscience background but also can meaningfully link specific school performance to bio-behavioural individual differences in children. Using two cultural samples, this study examined the associations between 12 temperament scales of the neuroscience-based test (STQ-77-C3) and the school grades from the 2nd and 3rd years of schooling. The results of our study were partially consistent with our first hypothesis and the results received from applying alternative temperament models (Fernández-Vilar & Carranza, 2012; Li et al., 2009; Martin & Holbrook, 1985; Nasvytienė & Lazdauskas, 2021). In the Russian sample, they confirmed the association (significant at p < 0.01) between overall higher school grades and sustained attention (measured in this study by the STQ-77-C3 scale of Mental Endurance) and impulse control (lower Impulsivity scores). In the Canadian sample, Mental Endurance also positively correlated with higher grades in Social activities, Mathematics and Science.
Impulse control, despite its similarity to Effortful control, showed less consistent associations with school grades in our study and also in other studies (Martin & Holbrook, 1985; Nasvytienė & Lazdauskas, 2021). Thus, unlike in the Russian sample, the Impulsivity scale did not have significant correlations with the school grades in the Canadian sample. The reasons for such differences in associations of the Impulsivity scale could be several. First, it could be due to different methodologies in grades collection: documented, exact, separated into specific subjects versus and estimated and unified into the groups (like one group of Math and Science, and another group of Social activities, unifying Language classes and group activities outside of classes). However, the difference in methodology did not have a strong impact on the other scales, including Mental Endurance, i.e., the scale that has a similar content to the low Impulsivity. The second reason for the absence of effects on the Impulsivity scale in Canadian sample (even though this sample was bigger) might be the cross-cultural difference in parent’s expectations. The Russian culture gives much more value to impulse control and disciplining than the Second culture, and this might have an effect on the reactivity of teachers to the impulsive behaviour of children. Russian teachers might be more inclined to penalize children for impulsivity, lowering their grades, than Second teachers. This highlights the importance of differentiation between the traits of Impulsivity and Mental Endurance (sustained attention, known as Effortful Control in other models (Rothbart et al., 2000)).
Moreover, the results related to emotionality traits of the STQ-77-C3 did not confirm the corresponding part of our hypothesis or opinions received from using alternative models of temperament. Such difference can be explained by the differences in the content of the scales related to emotionality as measured by those alternative models and the STQ-77. The devil appeared to be in the detail. Early temperament models used Approach-Withdrawal and Negative-Positive Affects scales that were not sufficiently differentiated or justified by neuroscience. For example, Approach could be interpreted as willingness to socialize (regardless of the mood), cognitive curiosity to objects/people or positive emotion. These behavioural aspects are regulated by different neurochemical systems. Willingness to socialize is regulated by the estrogen-prolactin-dopamine hormonal ensemble of hypothalamus; cognitive curiosity is regulated by noradrenalin-acetylcholine-glutamate ensemble of the frontal cortex, and positive emotions are based on the action of mu-opioid receptor system regulating monoamines all over the brain (Trofimova, 2019, 2021b, 2022; Trofimova & Gaykalova, 2021; Trofimova & Robbins, 2016). Throwing these very different regulatory systems into one pot of “Approach” dimension would be ignoring the progress in neuroscience. Combining Approach behaviour with Withdrawal behaviour in one dimension is even more confusing. Withdrawal behaviour can include the components of physical fatigue (based on disbalance in serotonergic and neuropeptide systems), social withdrawal (dysregulation of hypothalamic hormones) (Trofimova, 2021a; Trofimova & Gaykalova, 2021) and simply a preference for independence-from-a-group, and (as in Jung’s description of introverts), a preference of an individual for their own, internal word of thoughts (regulated by the frontal cholinergic, glutaminergic and serotonergic networks) (Trofimova, 2019). Withdrawal does not necessarily include anxiety and insecurity; in fact, anxious people prefer Approach behaviour to receive reassurance from other people. Vice versa, non-anxious and secure people might show withdrawal behaviour when they either contemplate their thoughts or plan antisocial actions “in cold blood”, in both cases, not having negative affectivity.
The STQ-77 scale of dispositional Satisfaction covers the full range of emotional valence but not the level of emotional arousal (i.e., positive emotional dispositions when the scores are high and negative – when the scores are low). The higher scores on this scale indicate a disposition of approval and trust in own behavior or reality around (“positive mood”), whereas the lower scores indicate consistent disapproval, irritability, mistrust, grumpiness, and dissatisfaction with reality or self (“negative mood”). This scale, therefore, disentangle the dimension of emotional valence from the dimension of emotional arousal as they are two different components of emotionality, in line with insights from neurochemistry (Trofimova & Gaykalova, 2021). When such separation is implemented, it looks like, from our results, the negative emotional valence per se might not affect success in schooling or teachers’ grading.
The STQ-77 scale of Neuroticism measures not negative affectivity in general or negative emotional valence but specifically dispositional behavioural alertness, avoidance of uncertainty, and expectation of adverse outcomes in situations of uncertainty and complexity. This scale does not, therefore, include low moods, anger, or irritability but might represent a very weak degree of chronic anxiety. Our results showed that, unlike emotional valence (i.e., the Satisfaction scale), sensitivity to uncertainty can be associated with grades. In our results, contrary to the common opinion, the negative association of Neuroticism with grades was specific to the most complex subjects - Mathematics and Science (or Environment): low Neuroticism was associated with higher grades in these subjects, or higher Neuroticism – with lower grades. These results could have several explanations.
First, the age of children assessed in our study, i.e., 7–11 years old, is associated with still immature frontal lobes, i.e., brain areas mainly linked to the ability for abstract thinking and complex conceptual processing needed to learn mathematics and science. This might explain a common phenomenon of “math anxiety” among some schoolchildren, especially when teachers are not equipped with the tools to make mathematical algorithms and language more transparent. Children with higher neuroticism, i.e., lower tolerance for novelty and uncertainty, can therefore be less successful in mathematics and science at the initial stages of learning, when multiple concepts in these subjects appear uncertain and unknown. Another explanation of the negative correlations between Neuroticism and grades in mathematics and science might be that students with lower Neuroticism, i.e., higher tolerance for uncertainty, are better learners in complex subjects due to a more “permissive,” less strict style of information processing, as one factor in cognitive complexity. We can only guess that there may not be one but several trends underlying our results on the role of emotionality in school grades.
There were two patterns of differentiation in associations between the grades and temperament traits that were not known in previous literature using alternative temperament models. First, in the study with the documented grades, the scale of Social Tempo but not Social Endurance had a positive association with the higher school grades across all subjects (except PhysEd, which didn’t vary much in this sample). The social Tempo scale reflects an ease of verbal processing and composition, essential for learning concepts and knowledge. In contrast, Social Endurance refers to the ability of individuals to maintain socialization (also known as “sociability”). High sociability did not help children in either sample of our study to earn higher grades in Mathematics and Science/Environment, and (in the Russian sample) also in Language, Literature, Foreign Language, Technology and Music. This questions the popular methods in the Western educational system using group assignments, group grading and group discussion. This result was similar to previous reports indicating that temperament traits “Activity”, “Activation”, “Surgency” (Fernández-Vilar & Carranza, 2012; Li et al., 2009; Martin & Holbrook, 1985; Nasvytienė & Lazdauskas, 2021) measured in children as level of socialization, did not have a strong impact on the grades. Our results, therefore, highlight the benefits of separating the Social-verbal Tempo and Social Endurance as two distinct temperament traits. Such separation will enable a more transparent and detailed picture of associations of temperament traits with various behavioural variables. This result also calls for reviews of the efficiency of group discussions and group projects as a method of learning and grading.
Another novel finding about the temperament-grades associations was observed for the traits of Sensation Seeking and Probabilistic Processing. As noted, the lower Sensation Seeking was more associated with higher grades in Music, Art, Technology and Environment, whereas Probabilistic Processing – with higher grades in more classical subjects, such as Language, Literature, Mathematics, Foreign Language and Environment, all significant at p < 0.01. Such differential pattern of associations shows the benefits of separation of these scales of temperament. Moreover, it is in line with expectations that people who are oriented on sensational objects (sensation seekers) spend more time and, therefore, are more knowledgeable in arts, music and the latest technological advances. In contrast, people with higher intelligence (Probabilistic Processing) are more efficient in basic school subjects.
Our second hypothesis was confirmed: the results showed an activity-specific pattern of correlations in the Canadian sample, where the estimated grades in PhysEd had high positive correlations with the scales measuring Motor (Physical) aspects of activity; the grades in Social activities had high positive correlations with the scales of Social Tempo and Social Endurance, and the grades in Mathematics-Science – with the “probabilistic” scales, such as Mental Endurance, Plasticity and Probabilistic Processing. This was in line with the results of previous studies using the STQ-77 (Trofimova, 2009; Trofimova & Sulis, 2011), and the activity-specific approach temperament research outlined by (Rusalov & Trofimova, 2007; Rusalov, 1989, 2018).
The limitations of the study include the relatively small sizes of the samples and the use of the reports completed by the parents. Parents’ reports and teachers’ reports (as noted above) are known for their biases. Since alternative methods to assess biologically-based traits in children are not readily available, the parents’ evaluations give the first glimpse of the child’s temperament and so they are still widely used in psychology.
Another limitation related to using estimated and not documented grades in the Canadian sample. Our results showed a valuable message for future studies: combining the grades into groups and categories might miss important subtleties in their associations with other variables. More work should be done in investigations of the associations between biologically-based (temperament) traits and variables of schooling behaviour, including school grades.
Conclusions
This study using two cultural samples aimed to provide school psychologists and child social workers with the screening tool of children’s temperament profiles and to gain new insights into “temperament – school grades” associations. For our study, we used the STQ-77-C3 in Russian and Canadian samples as well as documented (in the Russian sample) 2nd and 3rd years grades in eight school subjects and estimated (in the Canadian sample) 2nd and 3rd years grades in three groups of subjects.
Our study using early school children confirmed some patterns and showed additional patterns in grades-temperament associations, which were similar in both samples. The patterns that confirmed the results of previous studies showed a consistent positive association of school achievements with sustained attention and intelligence and a negative association with negative emotionality. In line with previous STQ-77 studies, the results also showed an activity-specific pattern of grades-temperament correlations in the Canadian sample, where the estimated grades in PhysEd had high positive correlations with the scales measuring physical aspects of activity; the grades in Social activities had high positive correlations with the scales measuring social aspects, and the grades in Mathematics-Science had highest positive correlations the “probabilistic” scales of the STQ-77-C3.
However, our study found several novel subtleties in association of temperament traits with 2nd and 3rd years school grades. (1) The trait of Satisfaction, measuring emotional valence (i.e., dispositional positive approval of elements of reality or dispositional negative moods unrelated to actions) showed no significant (at p < 0.01) in association with school grades in both samples. The trait of Neuroticism, measuring dispositional behavioural alertness and avoidance of uncertainty, had a specific negative association with the grades in Mathematics and Science (or Environment) in both samples but not with other subjects (except the negative correlation with PhysEd grades in the Canadian sample). (2) Social Tempo and Social Endurance (sociability) had very different patterns of association with the higher school grades. Social Tempo had high correlations with documented grades across all non-athletic subjects. In contrast, Social Endurance had only a significant (at p < 0.01) correlation with the subject Art in the sample that used documented grades. If sociability does not contribute to a child’s learning as much as speed of verbal processing, this questions the use of group methods and grading for group and not individual performance that are popular in the North American educational system. (3) There was a differential pattern of temperament-grades associations for Sensation Seeking versus Probabilistic Processing. The lower Sensation Seeking was more associated with higher grades in Music, Art, Technology and Environment, whereas Probabilistic Processing – with higher grades in more classical subjects, such as Language, Literature, Mathematics, Foreign Language and Environment, all significant at p < 0.01.
Our results, therefore, highlight the benefits for educational psychologists and practitioners in using a temperament screening test that can differentiate between the Social-verbal Tempo and Social Endurance, between Sensation Seeking and Probabilistic processing, and between dispositional Satisfaction and Neuroticism as distinct temperament traits. Such separation will enable a more transparent and detailed picture of associations of temperament traits with various behavioural variables in educational settings. The use of the STQ-77-C3 can be beneficial for investigations and psychological services in Russian- and English-speaking populations, especially considering the recent massive relocation of people worldwide speaking these languages. Moreover, the methods, research questions and results of investigations that use multi-languages freely available FET-based test (STQ-77) could be compatible with neurochemical hypotheses and suitable for international projects.
Attachment 1
The English version of the Early School Structure of Temperament Questionnaire-Compact (STQ-77En-C3) for assessment of children 7–11 age years old.
Footnotes
Ethical Considerations
Ethical approval was given by the Ethics Committee of the Federal State Budget Scientific Institution, Moscow, Russia and the School Board of the Novosibirsk Municipal Budgetary Educational Institution “Secondary school N112. Protocol N 015-2019, study “Associations between school grades and temperament in children aged 7–11”. Written consent of children’s parents was documented as per protocol.
Funding
The authors received no financial support for the research, authorship, and/or publication of this article.
Declaration of Conflicting Interests
The authors declared no potential conflicts of interest with respect to the research, authorship, and/or publication of this article.
Author Biographies
![]() .
.