
Abstract
Research understanding how people decide to support animal species facing environmental threats has been lacking. This research investigated how perceived physical attractiveness of two common pollinators – Western honey bees and bald-faced hornets – along with fear, influenced participants’ attitudes toward species protection. Two experiments involved showing photographs of both species to a representative sample from the U.S. The findings from the first study indicated that the honey bee, which was viewed as more physically attractive by humans, garnered greater support for protection compared to the less attractive bald-faced hornet. When considering fear, the honey bee evoked less fear than the bald-faced hornet in humans, which in turn positively impacted support for the species. The results of the second study suggested that physical attractiveness also influenced approach and avoidance behavior, further supporting the findings of the first study. These findings underscore a potential risk for species perceived as unattractive or fear-inducing (in humans), as their lack of support could lead to extinction, adversely affecting humans through consequences like rising costs of pollinator-dependent crops.
Introduction
There are approximately 28,000 species currently endangered with threatened extinction (International Union for Conservation of Nature, 2019). As Wilcove and Master (2005) reported, only about 15% of known species in the U.S. have been studied in sufficient detail to determine whether they are at risk, meaning estimates of imperiled species largely rely on extrapolations from this small, well-studied subset to a much larger group of species. This suggests a need to broaden our focus beyond the commonly researched species to include others that also face significant environmental threats such as the bald-faced hornet (Dolichovespula maculata) which is experiencing population decline (Panziera et al., 2022; Smith et al., 2014).
However, there remains a significant gap in research on the factors that influence individuals’ decisions to support species that face environmental threats. Several factors likely contribute to varying levels of support. First, policy and government information play a crucial role in shaping public opinion. The success of such efforts depends largely on how well scientific knowledge is translated into public policy (Rohlf, 1991). When policies are flawed or based on inaccurate biological concepts – such as ecosystem conservation or the stochastic nature of species persistence – public awareness and engagement suffer. Additionally, ongoing discussions around recovery plans for threatened species often falter due to poor communication of scientific knowledge from experts to the public, hindering effective actions (Gregory et al., 2012).
However, as we argue in this study, a more significant factor influencing support for species that face environmental threats may be humans themselves – specifically, their lack of awareness, ignorance, or personal biases toward certain species, often based on external characteristics. Public attitudes toward wildlife can vary significantly, with some species – particularly mammals – receiving more support and protection than others (Wellsmith, 2011). For example, Liordos et al. (2017) found that people expressed the highest levels of support for species like the red deer, loggerhead sea turtle, and brown bear, while species such as the black vulture, great white shark, and Milos viper received much lower support. Interestingly, the species that garnered the most support were also considered the most attractive and “safe” by the public, suggesting that decisions are often influenced by external appearances.
Our study seeks to address this gap in research, particularly regarding less charismatic species like insects, particularly pollinators. This gap is striking, given the critical role these species play in ecosystems. Understanding the attitudes that shape support for such species is essential for developing effective strategies, including public outreach, fundraising, and awareness campaigns, that aim to protect these animals.
Study 1
Physical Attractiveness
One possible reason certain species receive more support and protection is their physical attractiveness, as perceived by humans (Liordos et al., 2017). Previous research has examined how an animal’s physical traits can influence public willingness to protect it. Gunnthorsdottir (2001) found that an animal’s attractiveness, size, and similarity to humans all contributed to increased support for its conservation. Similarly, Kellert (1993) demonstrated that larger animals, particularly those resembling humans, tend to garner more support than smaller species. Plous (1993) further suggested that physical attractiveness plays a key role in shaping our willingness to engage in animal protection efforts. More recent studies have confirmed that the perceived attractiveness of a species significantly impacts the level of support it receives for conservation (Harnish et al., 2023; Harnish & Nataraajan, 2020). These findings suggest that physical traits, such as size and human-like features, often result in more favorable evaluations. This effect is partly driven by implicit cognitive processes (van Leeuwen & Macrae, 2004), as well as by emotional factors, because animals serve as strong emotional triggers for humans, evoking intense reactions and expressions (Jacobs, 2009).
Given these factors, it is reasonable to suggest that Western honey bees (Apis mellifera), in contrast to bald-faced hornets, are often perceived as visually appealing due to their light coloration, fuzzy bodies, and large eyes (Cunningham et al., 1995). Research on human visual preferences indicates that elements such as symmetry, prototypicality, contrast, complexity, and perceptual fluency shape our aesthetic appreciation (Reber et al., 2004). Additionally, studies on human interpretation of facial expressions and movement suggest that sharp angles tend to signal threat (Aronoff et al., 1992), while rounded shapes evoke warmth and approachability (Bar & Maital Neta, 2006). In contrast, to the honey bee, the bald-faced hornet may be seen as less aesthetically pleasing. Its darker coloration, sparse hair, and smaller eyes are typically less attractive compared to insects like honey bees. Furthermore, the bald-faced hornet carries a different cultural significance, with expressions like “stirring up a hornet’s nest” often evoking negative associations. Unlike honey bees, humans have no history of cohabitation or domestication with bald-faced hornets, which may contribute to their less favorable perception. In general, animals that are perceived as friendly or attractive tend to be favored by society, as people are naturally drawn to beauty and tend to avoid things that are considered unattractive. According to the theory of aestheticism (Baldwin, 1975; Harris Williams, 2010), human appreciation of certain traits is deeply linked to our development and survival instincts.
Fear of Insects
Insects, often overlooked as animals, are a primary trigger for certain animal phobias, with entomophobia being one of the most common types (Polák et al., 2020; Steel et al., 2014). These phobias have significant clinical implications, as specific animal phobias are among the most frequently reported mental health conditions, with lifetime prevalence estimates ranging from 3.3% to 5.7% (Eaton et al., 2018; Steel et al., 2014). Like other forms of psychopathology, insect-related phobias impose considerable psychological, social, and economic costs, both for the individuals affected and for society at large (Greenberg et al., 1999).
Two primary emotions – fear and disgust – are often triggered by animals that elicit phobias in humans (Ekman, 2005; Gerdes et al., 2009). Evolutionary theory suggests that humans’ tendency to experience disgust is an adaptive response that helps reduce the risk of harm or infection. As a result, human emotions and behaviors are shaped by natural selection (Prokop & Fanćovićova, 2010). Sumner et al. (2018) found that humans tend to fear and dislike certain insects, such as wasps, cockroaches, flies, fleas, and mites, while expressing more favorable attitudes toward honey bees. This aversion to wasps, according to Sumner et al. (2018), may stem from the aggressive behavior of a particular group of wasps, such as the bald-faced hornet, which make up less than 1% of all stinging wasps. Despite both wasps and honey bees being capable of stinging and causing allergic reactions like anaphylaxis, wasps are often perceived as more dangerous (Feás et al., 2022).
The language used to describe these insects reflects the contrast in perception. Honey bees are often associated with positive terms (e.g., honey, flowers, pollination, buzz), while wasps are typically described using more negative, emotive words (e.g., sting, dangerous, pain, annoying, nest; Sumner et al., 2018). As a result, wasps align more closely with our cognitive prototype of fearful objects (Lockwood, 2013). Nonetheless, both groups play essential ecological roles: honey bees and wasps are vital pollinators of crops, while wasps also serve as important biocontrol agents, helping to protect other invertebrates and plants (Schowalter et al., 2018; Weisser & Siemann, 2007).
Objectives of Study 1
Building on the evolutionary principles that influence human perceptions of animals, as well as previous research by Liordos et al. (2017) that identified groups of animals for which people expressed varying levels of support for conservation, Study 1 aimed to extend this line of inquiry. Specifically, we sought to compare two very different types of animals – honey bees and bald-faced hornets – based on their aesthetic characteristics. The study had three main objectives: (1) to assess whether there is a perceived difference in physical attractiveness (by humans) between the two species, (2) to examine which species evokes a higher level of fear (in humans), and (3) to determine which species participants would be more willing to support, based on their perceptions of physical attractiveness and the fear each species elicits.
Hypotheses
Based on the reviewed literature, we hypothesized the following:
Method
Participants
Data were obtained from a sample of 425 participants from Prolific (https://www.prolific.com/). All were US citizens, were between the ages of 20 and 85, and English was their first language. The average age of participants was approximately 47 (SD = 15.79) years old. Of the 425 participants, 52% were women, 47% were men, less than 1% non-binary/third gender, male to female transgender, and preferred not to say. Approximately 26% of the participants were married with children, 10% were married without children, 38% were single (never married), 13% were living with a partner, 9% were divorced, 1% were separated, 2% were widowed, and 1% preferred not to say. The majority were Caucasian (76%), with African American (13%), Asian (6%), Hispanic (3%), and “other” (1%) represented. Less than 1% were Native American or preferred not to indicate their race. Most reported no religious affiliation (42%). However, those who did, indicated the following religious affiliations: Protestant (22%), Catholic (13%), Jewish (2%), Buddhist (2%), Hindu (less than 1%), Muslim/Islamic (less than 1%), and “other” (10%). Three percent were not sure of their religious affiliation and 5% preferred not to say. Approximately half of the participants (54%) reported an annual household income of less than US$60,000 before taxes in the previous year. In terms of education, less than 1% had less than a high school education, 13% had a high school education, 22% had attended some college but received no degree, 10% had an associate degree, 39% had received a bachelor’s degree, 11% had a master’s degree, 1% had a doctoral degree, and 2% had a professional degree (e.g., JD, MD) with less than 1% preferring not to say.
Procedure
As noted earlier, participants were recruited using Prolific. Individuals who were registered with Prolific could view available study titles, the study’s host (i.e., the principal investigator), the reward, and time allotted for completion among other information. Participants, who were selected based upon their demographic information to replicate the US population and who were interested in participating, clicked on a “Start Now” link that directed them to the experiment, which was housed outside of Prolific. Qualtrics (https://www.qualtrics.com/) was used to create the experiment and it was hosted on their servers. Participants who completed the experiment were each compensated with a sum of US$4.25. On average, participants took 20 minutes to complete the experiment. All procedures performed in this study involving human participants were in accordance with the ethical standards of the first author’s institutional research board and with the 1964 Helsinki declaration and its later amendments or comparable ethical standards. Informed consent was obtained from all individual participants included in the study.
Stimuli
Animals Used as Stimuli or Fillers in the Research.
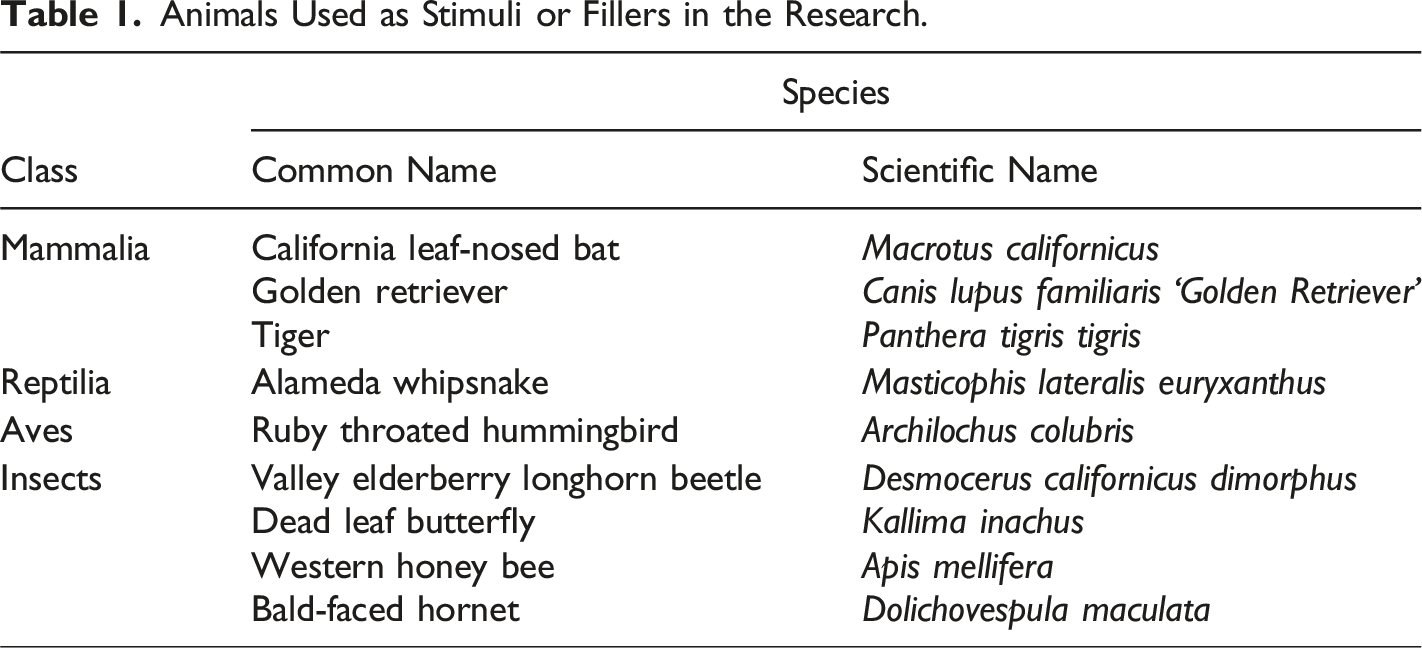
All the animals except the honey bee and the bald-faced hornet served as filler stimuli. This was because we were especially interested in how participants would perceive these two pollinators which varied in terms of their perceived (by humans) physical attractiveness. As noted earlier, we anticipated that the honey bee would be perceived to be more physically attractive (to humans) than the bald-faced hornet (see Figure 1). View of the honey bee on the left and the bald-faced hornet on the right.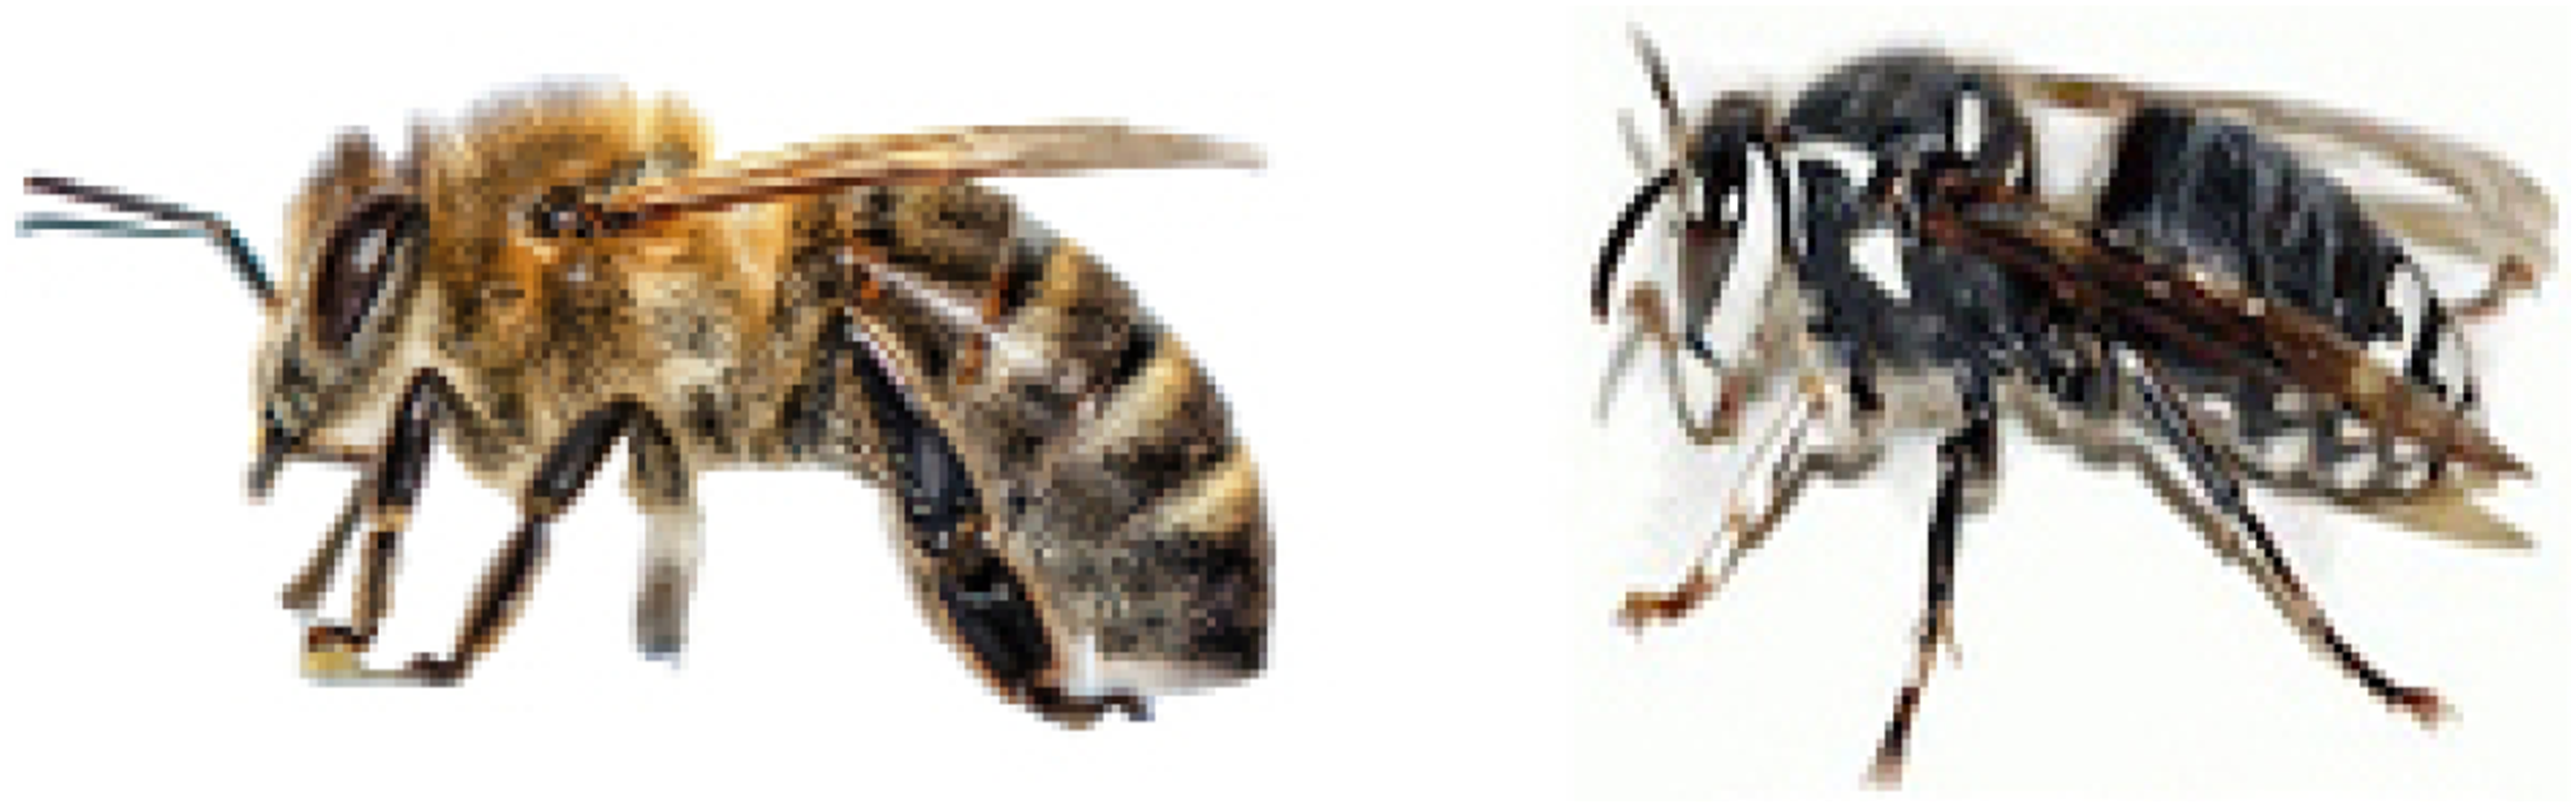
Measures
First, participants were asked how supportive they were in protecting each of the animals from: (1) Illicit trade; (2) Harm from pollution and waste; and (3) Cruelty and persecution. Participants indicated their support for each item using a 4-point scale where 1 = Not at all, 2 = Only a little, 3 = Some, and 4 = A great deal. Next, participants were asked to rate each animal’s physical attractiveness based on the photo presented to them. Participants used a 5-point scale where 1 = Very unattractive, 2 = Unattractive, 3 = Neither unattractive nor attractive, 4 = Attractive, and 5 = Very attractive.
Following this, participants were asked to complete a series of questions assessing their fear of the animal. The fear questions were adapted from the Circumscribed Fear Measure (McCraw & Valentiner, 2015). According to McCraw and Valentiner (2015), four different types of questions have been used to assess fear. These include “… physiological symptoms upon encountering the stimulus (e.g., sweating, feeling sick); a subjective sense of anxiety or fear in response to the stimulus; an attempt or desire to avoid the stimulus, either physically or cognitively; and a sense that the stimulus was threatening, either directly (i.e., that the stimulus itself was dangerous) or indirectly (e.g., it might cause the respondent to behave in ways that are detrimental to functioning…”) (McCraw & Valentiner, 2015, p. 404). Thus, to assess physical symptoms elicited upon encountering the animal, we asked participants, “how physiologically aroused (e.g., increased heartrate, sweaty hands, heavy breathing) would you be if you came face-to-face with the animal pictured above?” Participants responded using a 5-point scale where 1 = Not at all physiologically aroused, 2 = A little physiologically aroused, 3 = Somewhat physiologically aroused, 4 = Physiologically aroused, and 5 = Very physiologically aroused.
To determine their subjective sense of fear, we asked participants to “imagine that you come face-to-face with the animal pictured above. How fearful would you be?” Participants indicated their response on a 5-point scale where 1 = Not at all fearful, 2 = A little fearful, 3 = Somewhat fearful, 4 = Fearful, and 5 = Very fearful or terrified. To measure participants’ desire to avoid the animal, we posed the following question, “which of the following best describes how close you would get to the animal pictured above?” Responses were made on a 5-point scale where 1 = Would approach it so I could touch it, 2 = Would approach it so I was within six to almost 12 inches of it, 3 = Would approach it so I was within one to six feet away from it, 4 = Would approach it so I was further away than six feet from it, and 5 = I would not approach it. Finally, to assess how threatening or dangerous the animal was, we asked participants, “how dangerous is the animal pictured above to you?” Participants rated how dangerous the animal was on a 5-point scale where 1 = Not at all dangerous, 2 = A little dangerous, 3 = Somewhat dangerous, 4 = Dangerous, and 5 = Very dangerous. After these measures were completed, participants were asked to complete the demographic measures.
Results of Study 1
Physical Attractiveness
Because we were interested in how physical attractiveness impacted protection for an animal, we began the analysis by exploring ratings of physical attractiveness for the honey bee and bald-faced hornet. Recall, that participants saw a photograph of a honey bee (Figure 1), which was hypothesized to be more physically attractive to participants compared to a photograph of the bald-faced hornet (Figure 1), which was hypothesized to be less physically attractive to participants. A paired-samples t test was conducted to test the hypothesis. There was a statistically significant difference in ratings of physical attractiveness between the honey bee (M = 3.02, SD = 1.10) and the bald-faced hornet (M = 1.92, SD = .93), t(424) = 21.50, p < .001. Cohen’s d was 1.04 indicating a large effect size. This finding provides support for H1 which stated participants will rate the honey bee as more physically attractive than the bald-faced hornet.
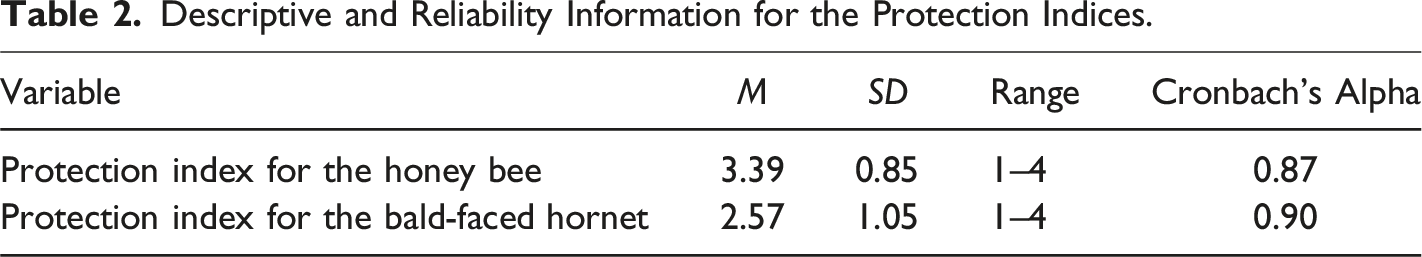
Descriptive and Reliability Information for the Protection Indices.
To test the hypothesis that the honey bee would receive more support for protection than the bald-faced hornet due to difference in perceived physical attractiveness (by humans), we conducted generalized estimating equations (GEE) analysis to evaluate the relationship between physical attractiveness ratings and the level of support received for the protection of the pollinators. We chose to use GEE instead of analysis of variance (ANOVA) because ANOVA has specific requirements, such as the assumption of equal variances between all possible pairs of within-subject conditions (i.e., levels of the independent variable). It is also limited to fixed time intervals and is sensitive to missing data. In contrast, GEE allows for a more flexible, personalized model that can be tailored to the nature of the dependent variable. The key advantage of GEE is its ability to robustly estimate the variances of regression coefficients when there is high correlation between repeated measurements (Ballinger, 2004; Hardin & Hilbe, 2013). This results in more reliable regression estimates with appropriate standard errors. The GEE model equation can be expressed as: Y i = β 0 + β 1 X i + ϵ i where Y i is the attractiveness score, β 0 is the intercept, β 1 is the coefficient for the pollinators predictor, X i is the pollinator (honey bee, bald-faced hornet) and ϵ i is the error term.
The average support score for the honey bee was M = 9.66 (SE = .15), while the bald-faced hornet had an average score of M = 8.49 (SE = .15). The mean physical attractiveness score for the pollinators (i.e., combined ratings) was M = 2.47 (SD = 2.16). A GEE analysis using a normal probability distribution with an identity link function and an independent working correlation matrix structure was employed. 1 The GEE analysis revealed that physical attractiveness ratings had a significant positive effect on the level of support for protection (β = 1.43, Wald χ2 = 131.70, p < .001). This indicates that higher attractiveness ratings are associated with increased support. An interaction term between pollinators and physical attractiveness was included, indicating that the effect of attractiveness on support was significantly stronger for the honey bee than for the bald-faced hornet (β = 0.52, Wald χ2 = 12.04, p = .001). Pairwise comparisons revealed a significant difference between the honey bee (M = 9.66, SE = .15) and the bald-faced hornet (M = 8.49, SE = .15), p < .001. In summary, our results supported H2 which predicted that the honey bee would receive more support for protection than the bald-faced hornet due to the difference in perceived physical attractiveness (by humans) between the two pollinators.
Fear
Descriptive and Reliability Information for the Fear Indices.
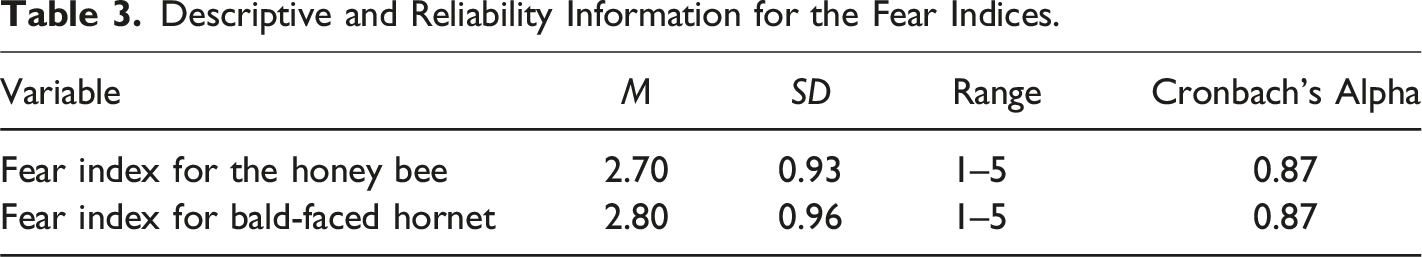
To test the hypothesis that the bald-faced hornet will evoke higher levels of fear among participants as compared to the honey bee, a paired samples t test was conducted. Results revealed a statistically significant difference in ratings of fear between the honey bee (M = 2.70, SD = 0.93) and the bald-faced hornet (M = 2.80, SD = 0.96), t(424) = −2.41, p = .008. Cohen’s d was 0.12 indicating a small effect size. This finding provided support for H3 which stated the bald-faced hornet will evoke higher levels of fear among participants as compared to the honey bee.
To test the hypothesis that the honey bee will receive more support for protection than the bald-faced hornet due to the difference in fear evoked between the two pollinators, we again conducted generalized estimating equations (GEE) analysis to evaluate the relationship between fear ratings and the level of support received for the protection of the pollinators. The average support score for the honey bee was M = 10.13 (SE = .12), while the bald-faced hornet had an average score of M = 7.71 (SE = .15). The mean fear score for the pollinators was M = 13.75 (SD = 4.71). A GEE analysis using a normal probability distribution with an identity link function and an independent working correlation matrix structure was employed. The GEE analysis revealed a significant interaction effect between pollinators and fear on support for the pollinators, indicating that the effect of fear on support was significantly weaker for the honey bee than for the bald-faced hornet (β = 0.10, Wald χ2 = 6.72, p = .01). Pairwise comparisons revealed a significant difference between the honey bee (M = 7.71, SE = .15) and the bald-faced hornet (M = 10.13, SE = .12), p < .001. In summary, our results supported H4 which predicted that the honey bee would receive more support for protection than the bald-faced hornet due to the difference in fear evoked by the two species.
Discussion
We found that participants rated the honey bee as more physically attractive than the bald-faced hornet supporting H1. Furthermore, the analysis indicated that the honey bee received more support for protection than the bald-faced hornet, potentially due to differences in perceived physical attractiveness affirming H2. Previous research (Gunnthorsdottir, 2001; Harnish et al., 2023; Harnish & Nataraajan, 2020) consistently supports the idea that the physical attractiveness of a species, as perceived by humans, influences how that species is treated, with more attractive species typically receiving better treatment. These findings align with studies on human physical attractiveness, where physically attractive individuals are often seen as more socially and sexually desirable (Eastwick et al., 2011; Zebrowitz & Montepare, 2008), achieve better educational outcomes (Judge et al., 2009; Umberson & Hughes, 1987), are more likely to be hired for desirable jobs (Lee et al., 2018), and tend to earn higher salaries (Hamermesh & Biddle, 1994) compared to those perceived as less physically attractive. These findings are consistent with evolutionary theory and evolutionary psychology, which suggest that human behavior, shaped by cognitive and physiological structures through natural selection, serves specific survival and reproductive purposes (Buss, 2019). In other words, prior research has highlighted the significant and far-reaching effects of physical attractiveness on people’s lives (e.g., Gangestad & Scheyd, 2005). This body of work typically indicates that more physically attractive individuals are treated more favorably than others. However, these theories do not provide empirical evidence on how varying perceptions of physical attractiveness may influence the way humans perceive animals.
Indeed, it appears that physically unattractive animals and humans are penalized because of their physical attractiveness resulting in a stereotype suggesting that which is “physically unattractive is bad” (Griffin & Langlois, 2006) while those who are perceived to be physically attractive are good (i.e., the “what is beautiful is good” hypothesis; Dion et al., 1972). If physical unattractiveness of a species evokes stronger reactions (i.e., this species is bad) as compared to a physically attractive species (to humans) then, we should observe more fear provoked by the physically unattractive species as compared to the physically attractive species. Results supported this claim: H4 stated that the honey bee would receive more support for protection than the bald-faced hornet potentially due to the difference in fear evoked by the two species. Consistent with this finding, Bennett-Levy and Marteau (1984) reported an association between ratings of an animals’ level of perceived physical unattractiveness (by humans) and fear. They argued that a species physical unattractiveness “incorporated elements of sliminess, hairiness, colour of animal, perceived dirtiness, number of limbs and antennae projecting from the body, compactness of body and relation of eyes to the head” (p. 41). Thus, it appears that the more an animal form diverges from a human form, the more fear it evokes in humans. Indeed, it may be the case that many individuals do not know insects are animals given how drastically insects differ from other animal forms. This suggests that, as human beings, we all share certain common traits, including limitations such as unawareness or, in more extreme cases, ignorance. These limitations can give rise to personal or collective irrational fears when encountering something strange, unfamiliar, or unknown - such as unfamiliar animals. As DeNicola (2017) explains, “fear is merely the reaction, where ignorance comes first” (p. 31).
Fear of certain animals may also stem from a lack of familiarity (i.e., knowledge, experience). Honey bees, for example, benefit from their symbolic and cultural significance. They appear in family coats of arms, are revered by some ancient cultures, and expressions like “busy as a bee” and “the bee’s knees” highlight positive human traits. The word “honey” is commonly used as a term of endearment, further embedding honey bees in human culture. In addition, honey is a valuable resource that plays a crucial role in achieving sustainable development goals related to food security and biodiversity (Patel et al., 2021). Sumner et al. (2018) also pointed out that humans have a “long history of cohabitation and domestication” (p. 836) with honey bees, which further strengthens their positive perception in human society. Familiarity with animals can also come from watching nature documentaries, where viewers report feeling less fear of the featured animals after gaining knowledge about them. Even brief exposure to nature shows has been found to positively impact emotions and reduce anxiety levels (Morgan, 2021). In contrast, research suggests that individuals who react aggressively toward animals due to fear may do so because of insufficient knowledge about the species they encounter (Lerner & Keltner, 2001). Therefore, acquiring more knowledge about a specific animal appears to have a positive influence on how humans perceive it. Wasps, in particular, have been notably understudied, possibly due to their negative public perception, which often stems from fear and misunderstanding rather than an informed view of their behavior and ecological role.
Study 2
Objectives of Study 2
As with studies relying on self-reports, caution is necessary when interpreting findings, as they may not accurately capture the true intensity of a participant’s response. To address this, we used a behavioral measure in the second study – the Approach-Avoidance Task (AAT; Rinck & Becker, 2007). Previous research has shown a link between approach-avoidance behaviors and both the liking and perceived attractiveness of an object (Neumann et al., 2003). Specifically, approach behaviors tend to increase the attractiveness of an object or person, while avoidance behaviors reduce it. For instance, in interpersonal contexts, studies have found that when individuals demonstrate approach behaviors toward someone, their attitudes toward that person become more positive (Chen et al., 2010; Lambert et al., 2010; Lambert & Fincham, 2011).
Other studies have shown that approach training can improve interracial attitudes and interactions. For example, Kawakami et al. (2007) demonstrated that training participants to approach images of Black individuals and avoid images of White individuals led to more positive attitudes and behaviors toward Black individuals. Similarly, in a health context, avoidance training has been found to alter the approach bias toward alcohol in individuals with alcohol dependence (Wiers et al., 2011). In this study, patients used a joystick to push away alcohol-related stimuli, shifting their approach bias toward alcohol into an avoidance bias. As a result, participants reported weaker alcohol cravings and, compared to a control group, experienced better treatment outcomes a year later.
We modeled our study after Wiers et al. (2011), but instead of using a joystick, we employed two keyboard keys. Pressing the “T” key would push the image away, causing it to shrink, while pressing the “B” key would pull the image toward the participant, making it larger. We hypothesized that participants would be more likely to pull the image of the honey bee toward themselves compared to the bald-faced hornet, as the honey bee is generally perceived as more physically attractive as demonstrated in Study 1. Additionally, unlike Wiers et al. (2011), which was focused on training of alcohol-related cognitions, our aim was to use the AAT to assess whether participants already perceived honey bees as more “approachable” than bald-faced hornets.
Method
Participants
A second sample, consisting of 475 participants, was recruited from Prolific (https://www.prolific.com/). All participants were U.S. citizens, aged between 20 and 87, and had English as their first language. The average age was approximately 49 years (SD = 17.27). In terms of gender, 52% were women, 46% were men, less than 1% identified as third gender/non-binary, less than 1% as transgender, and 1% preferred not to disclose their gender. Regarding relationship status, 31% were married with children, 7% were married without children, 33% were single (never married), 10% were living with a partner, 13% were divorced, 2% were separated, 4% were widowed, and 1% preferred not to say. The racial composition was predominantly Caucasian (67%), with 12% African American, 7% Asian, 7% Hispanic, 2% Native American, 5% identifying as “other,” and less than 1% preferring not to disclose their race. In terms of religious affiliation, 36% reported no religious affiliation. Among those who identified with a religion, 27% were Protestant, 17% Catholic, 3% Jewish, 2% Buddhist, 2% Muslim/Islamic, 1% Hindu, and 9% identified as “other.” Three percent were unsure of their religious affiliation, and 2% preferred not to say. With regard to household income, 49% reported earning less than US$60,000 annually before taxes in the previous year. Educationally, less than 1% had less than a high school education, 13% had a high school diploma, 24% had attended some college without completing a degree, 11% held an associate degree, 35% had a bachelor’s degree, 11% had a master’s degree, 2% held a doctoral degree, 2% had a professional degree (e.g., JD, MD), and less than 1% preferred not to disclose their education level.
Procedure
The demographic questions for this study were created using Qualtrics and hosted on their servers. The approach-avoidance task was designed using an Inquisit script. 2 Participants who completed the study received a compensation of US$4.25. On average, participants spent 30 min completing the experiment. All procedures involving human participants adhered to the ethical standards set by the first author’s institutional research board, as well as the 1964 Helsinki Declaration and its subsequent amendments. Informed consent was obtained from all participants prior to their involvement in the study.
Pretest stimuli and measures
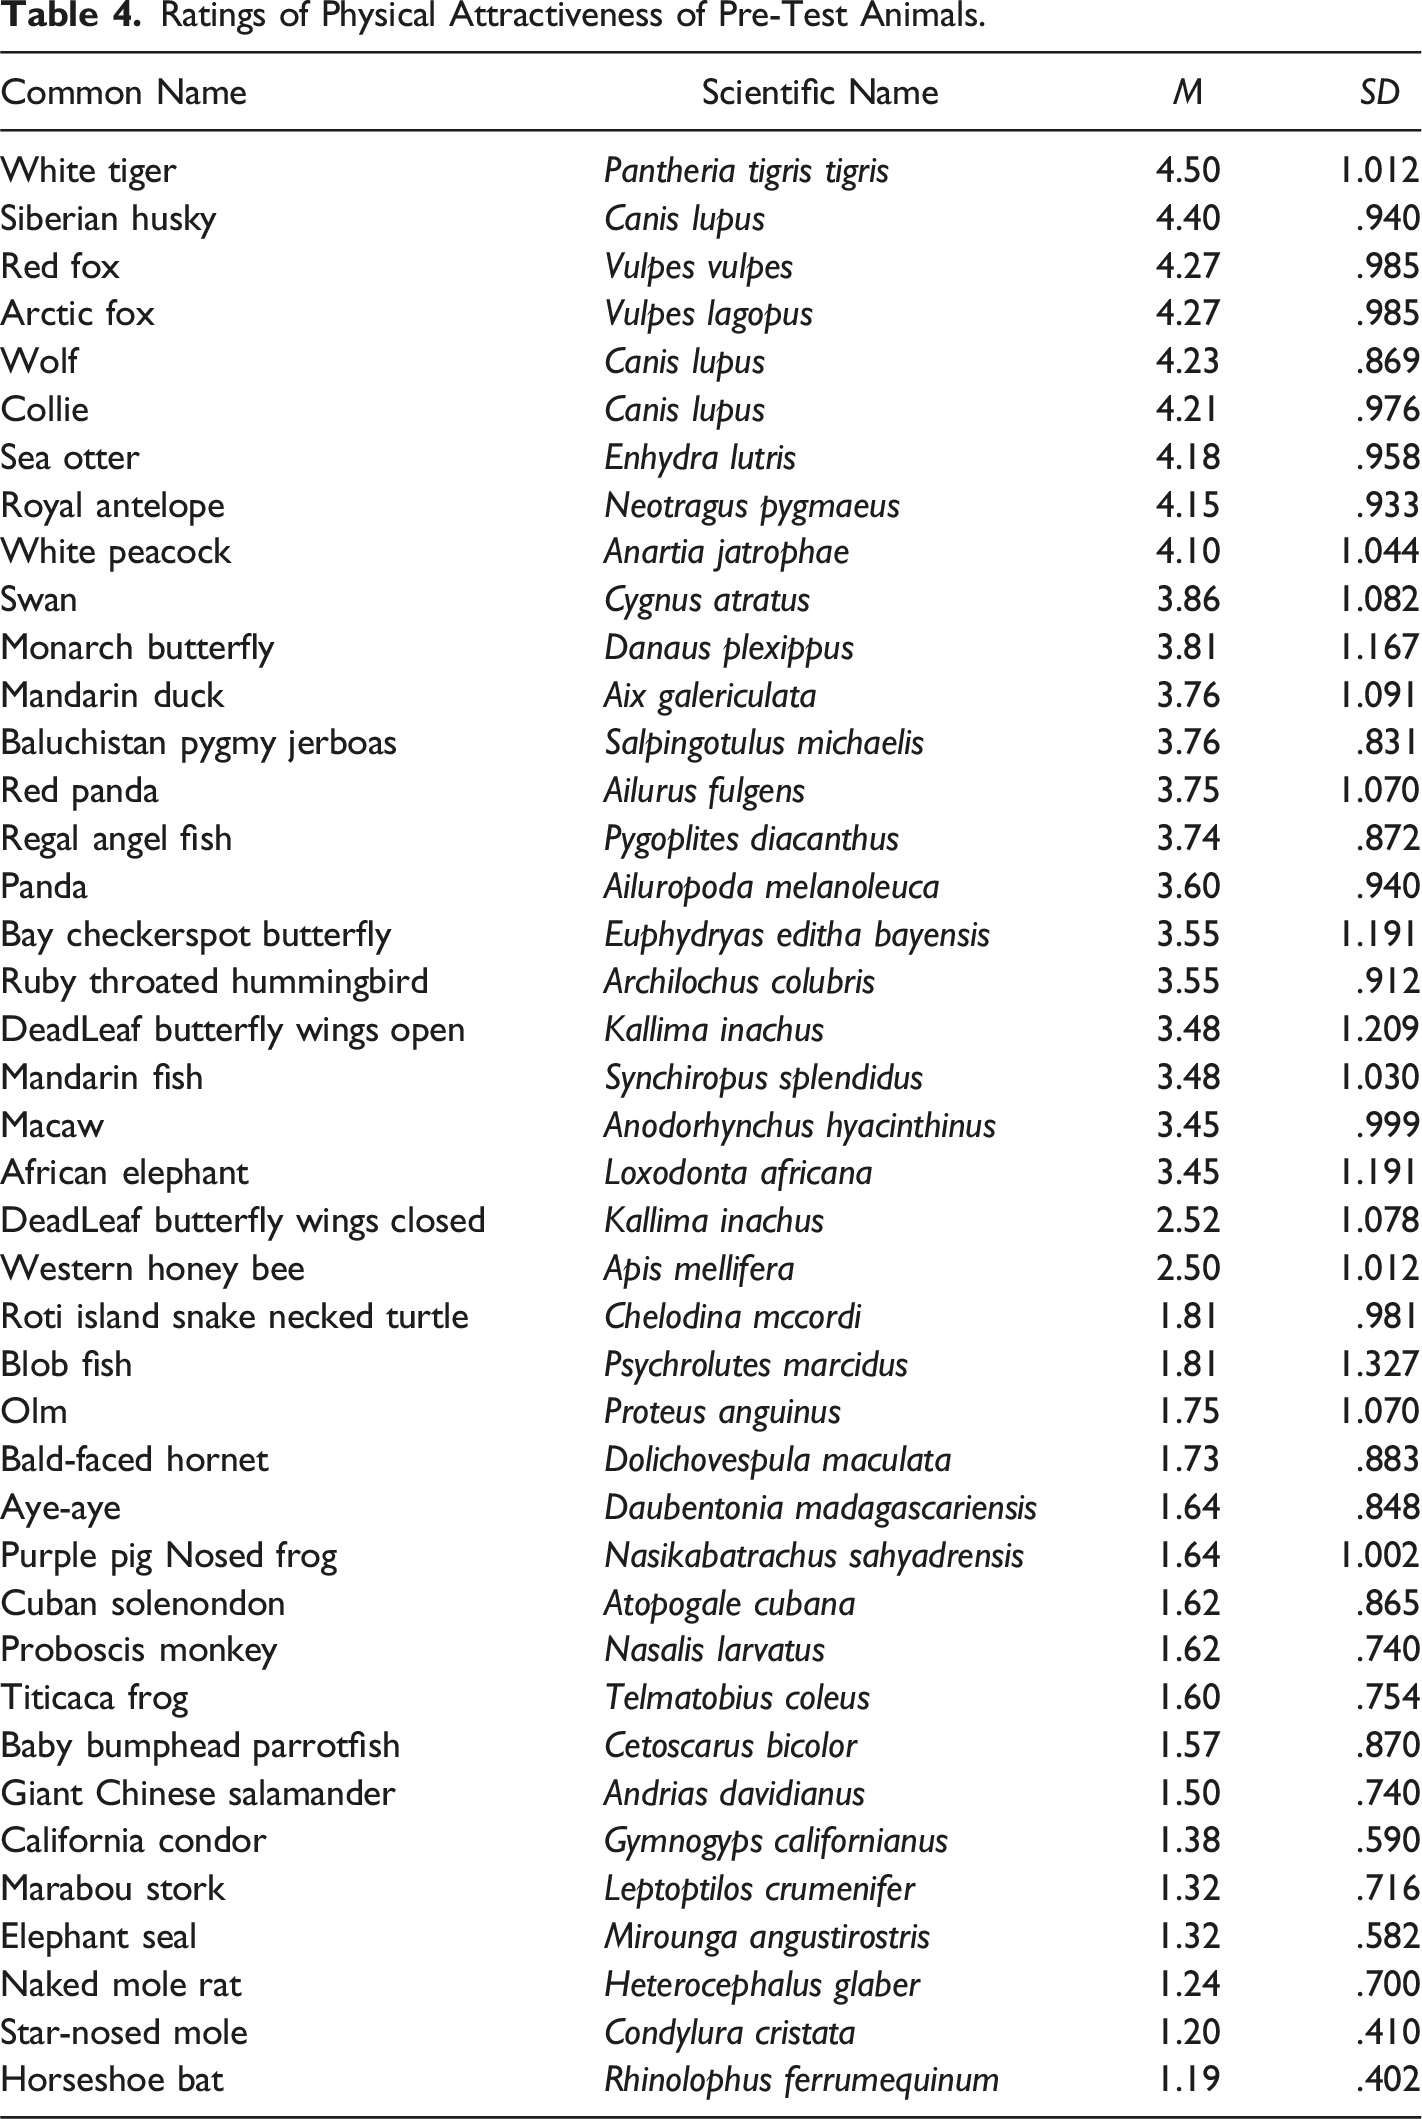
Ratings of Physical Attractiveness of Pre-Test Animals.
Approach-Avoidance Task
In Study 2, participants completed the Approach-Avoidance Task (AAT; Rinck & Becker, 2007). Four categories of stimuli were used: (1) pictures of animals from the pretest rated as physically attractive, (2) pictures of animals from the pretest rated as physically unattractive, (3) pictures of people expressing positive emotions (e.g., smiling, laughing), and (4) pictures of people expressing negative emotions (e.g., frowning). Each category consisted of 10 images, presented in both portrait and landscape formats.
Participants interacted with the images by pressing the “T” key to shrink the image, causing it to be pushed away, and the “B” key to enlarge the image, pulling it toward them (for technical details, see Rinck & Becker, 2007). Before the test trials, participants completed 10 practice trials, during which a gray rectangle in either portrait or landscape format was shown. The format-to-key assignment was counterbalanced: half of the participants pulled landscape images and pushed portrait images, while the other half received the opposite assignment. The 80 test images were presented in a quasi-random order, with a maximum of three images from the same category or format presented consecutively.
Results
Pre-test of Physical Attractiveness
As previously mentioned, for Study 2, a pre-test was conducted with 42 different animals to assess their physical attractiveness. The results identified several animals that were rated highly in terms of attractiveness, including the White Tiger (Pantheria tigris tigris), Siberian Husky (Canis lupus), Red Fox (Vulpes vulpes), Arctic Fox (Vulpes lagopus), Wolf (Canis lupus), Collie (Canis lupus), Sea Otter (Enhydra lutris), Royal Antelope (Neotragus pygmaeus), and White Peacock (Anartia jatrophae). These animals were selected as fillers for the “physically attractive” category in the AAT, with the Honey Bee included as the target stimuli. In contrast, animals such as the Bald-Faced Hornet, Titicaca Frog (Telmatobius coleus), Baby Bumphead Parrotfish (Cetoscarus bicolor), Giant Chinese Salamander (Andrias davidianus), California Condor (Gymnogyps californianus), Marabou Stork (Leptoptilos crumenifer), Elephant Seal (Mirounga angustirostris), Naked Mole Rat (Heterocephalus glaber), Star-Nosed Mole (Condylura cristata), and Horseshoe Bat (Rhinolophus ferrumequinum) were rated as the least physically attractive and were used as fillers in the “physically unattractive” category of the AAT, with the Bald-Faced Hornet serving as the target stimuli for this group. See Table 4 for all the animals used in the pre-test and their ratings.
Pretest comparative analysis
A paired-samples t test was conducted to compare the physical attractiveness ratings of the honey bee and the bald-faced hornet. The results showed a significant difference between the two species, with the honey bee receiving a higher physical attractiveness rating (M = 2.50, SD = 1.01) compared to the bald-faced hornet (M = 1.73, SD = 0.88), t(21) = 3.27, p = .004 (two-tailed). The mean difference was 0.77, with a 95% confidence interval ranging from 0.28 to 1.27. Cohen’s d = 0.70 indicated a medium effect size. Based on these findings, the honey bee was rated as more physically attractive than the bald-faced hornet, and we proceeded with the AAT analysis.
Preliminary Analysis of AAT Scores
To ensure data accuracy, erroneous reactions to the AAT stimuli depicting honey bee and bald-faced hornet orientations were excluded from the dataset when the format-to-key assignment was incorrect (i.e., pushing the landscape images when it should have been pulled, and pulling the portrait images when they should have pushed). This resulted in 40.4% of the sample being excluded from the analysis. Subsequently, outliers exceeding two standard deviations from the mean for each stimulus were also eliminated, resulting in the removal of 23.2% of accurate responses. Consequently, 217 responses were retained for subsequent analyses.
AAT score calculation
AAT scores were computed by determining the difference between reaction times for pushing and pulling separately for honey bee and bald-faced hornet stimuli. A negative score indicates an avoidance tendency, where pushing away is quicker than pulling closer. Conversely, a positive score suggests an approach tendency, with pulling closer being faster than pushing away.
Comparative analysis
A paired-samples t test assessed the disparity in approach and avoidance behaviors between the honey bee and bald-faced hornet stimuli. Results revealed a significant difference in respondent reactions to the honey bee (M = 6.45 ms 3 , SD = 330.31 ms) and the bald-faced hornet (M = −78.82 ms, SD = 367.99 ms), t(216) = 2.61, p = .01 (two-tailed). The mean difference score was 85.27 ms, with a 95% confidence interval ranging from 20.83 ms to 149.72 ms. Cohen’s d = .18 indicated a small effect size.
Discussion
The results of Study 2 provide insightful evidence regarding human perceptions and behavioral responses to two distinct insect species: the honey bee and the bald-faced hornet. The findings from the pretest and the subsequent AAT revealed significant differences in how these species are perceived in terms of physical attractiveness and how people react behaviorally to them. The pretest revealed a significant difference in the perceived physical attractiveness of the honey bee and the bald-faced hornet, with the honey bee receiving a higher attractiveness rating. These results support the hypothesis that animals with more aesthetically pleasing or familiar features are viewed more favorably by humans. This aligns with existing research suggesting that humans tend to favor animals that are perceived as more physically attractive, often influenced by visual cues such as size, color, and symmetry (Liordos et al., 2017).
The AAT results revealed a significant difference in the approach-avoidance tendencies associated with the honey bee and the bald-faced hornet stimuli. Respondents showed a positive mean AAT score for the honey bee, indicating an approach tendency, meaning that participants were quicker to “pull” the image of the honey bee closer, suggesting a more favorable, welcoming response. In contrast, the bald-faced hornet elicited a negative mean AAT score, indicating an avoidance tendency such that participants were faster to “push” the hornet image away, reflecting an instinctual, fearful reaction. This result is consistent with previous research suggesting that certain insects, particularly those perceived as dangerous or threatening, elicit avoidance behaviors, likely due to evolutionary responses to potential threats (Ekman, 2005; Gerdes et al., 2009).
Although the statistical significance of the difference is clear, the effect size for the AAT results was small (Cohen’s d = 0.18), suggesting that while the difference in approach-avoidance behavior is significant, the strength of the relationship between perceived attractiveness and behavioral response is relatively modest. This finding may indicate that while the physical appearance of the species plays a role in influencing approach-avoidance behavior, other factors such as individual experiences, cultural attitudes, and perceived danger also contribute to these responses. For example, even though honey bees are perceived as more attractive, their perceived role as important pollinators may further encourage positive responses, while the bald-faced hornet’s aggressive behavior may be a more dominant factor in triggering avoidance.
Conclusion
This study is the first, to our knowledge, to examine how physical attractiveness and fear may influence support for the protection of pollinators. Research on pollinators is critical due to their vital role in human food production and the increasing threats they face as their populations decline (Klein et al., 2007). The lack of support for species that humans find physically unattractive or that evoke fear could contribute to their extinction, with far-reaching consequences for human societies. For example, declines in pollinator populations could lead to higher prices for crops that rely on pollination, such as almonds, or a reduced availability of pumpkins in the fall (Gallai et al., 2009). Therefore, ensuring the survival of less physically attractive pollinators may depend on a deeper understanding of how humans perceive and react to these species.
The findings of these studies have broader implications for understanding how human perceptions of physical attractiveness influence attitudes and behavioral responses toward pollinators. The tendency to support and approach more attractive species (like honey bees) and avoid less attractive ones (like bald-faced hornets) reflects a broader pattern where human attitudes toward animals are shaped not just by their ecological roles, but also by their visual appeal and perceived threat level. This dynamic is particularly relevant because public attitudes and support for species protection can often be swayed by aesthetic factors (Liordos et al., 2017).
Limitations and Directions for Future Research
The stimuli used in this study represent just two of the many pollinator species that vary in their perceived physical attractiveness and the degree of fear they may evoke in humans. Therefore, additional research is needed to explore a broader range of species and further investigate the factors influencing human perceptions of animals. Additionally, future studies could examine individuals’ moral and social capital orientation (Burke, 2010; Muller, 2020; Norman, 2014), as well as other relevant social and psychological factors, such as axiomatic theories (e.g., human values and moral systems) and environmental and social framing (Klein et al., 2022). These factors could provide valuable insights into individual differences in concern for animals and environmental issues, helping to deepen our understanding of the complex dynamics that shape attitudes toward animal welfare.
Footnotes
Author Contribution
Conceptualization: RJH, BET, PT, RN, FJS; Literature research: RJH, PT, BET; Analysis: RJH; Writing: RJH, BET, PT. All authors reviewed and edited the manuscript.
Declaration of Conflicting Interests
The author(s) declared no potential conflicts of interest with respect to the research, authorship, and/or publication of this article.
Funding
The author(s) disclosed receipt of the following financial support for the research, authorship, and/or publication of this article: This research was funded by internal research development grants by Penn State New Kensington. Partial funding to support this project was provided by Penn State Schuylkill Faculty and Student Research Endowment and the Fred J. Wiest Faculty Research Award at Penn State Schuylkill.
Ethics Statement
This study was approved by the first author’s institutional review board and we certify that the study was performed in accordance with the ethical standards found in the 1964 Declaration of Helsinki and its later amendments or comparable ethical standards.