
Abstract
We examined the psychometric properties of the Borderline Personality Features Scale for Children (BPFSC-11) in a sample of n = 235 adolescents. This involved an exploratory factor analysis (EFA) and a confirmatory factor analysis (CFA). We meticulously assessed internal consistency, convergent, and concurrent validity by analyzing the relationship between BPFSC-11 scores and measurements of emotional dysregulation, self-efficacy, resilience, depression, anxiety sensitivity, and social anxiety. The EFA revealed a two-factor solution, a finding that the CFA robustly confirmed. The BPFSC-11 demonstrated excellent internal consistency with an alpha value of 0.87 and adequate validity. Measurement invariance was examined across five groups: sex assigned at birth, born in Norway, speaking primarily Norwegian at home, by treatment group, and longitudinally. These findings confirm the reliability and validity of the BPFSC-11, adding new and significant findings to provide a solid foundation for its use in the assessment and treatment of adolescents with borderline personality features. Limitations of the current study include the absence of a clinical interview to examine diagnostic validity, and participants’ responses may have been influenced by response desirability bias. Future research should examine the validity of the scale, both cross-sectionally and longitudinally, to enhance understanding of its application in different cultural contexts.
Introduction
The essential feature of borderline personality disorder (BPD) is a pervasive pattern of instability of interpersonal relationships, self-image, and affects, and marked impulsivity that is present in a variety of contexts (APA, 2013). This disorder is associated with significant functional impairments, frequent use of intensive treatments, and substantial societal costs (Leichsenring et al., 2024).
BPD and BPD symptoms in adolescence have a substantial negative impact on different areas of functioning and are recognized as a severe form of psychopathology (Haltigan & Vaillancourt, 2016). BDP is a unique disorder but has symptoms that overlap and have similar etiological roots to depression and anxiety. Like depression, the development of borderline traits seems closely linked to the experience of adverse events (Fonagy & Bateman, 2016). Moreover, impaired emotion regulation is a hallmark feature of major depressive episodes (APA, 2013) and the core feature of BPD (APA, 2013). Further, BPD has been associated with anxiety in general and with social anxiety disorder, specifically with increased self-focused negative emotions, along with more escape tendencies and less intent to engage in pleasant activities (Gutz et al., 2016). In addition, lower resilience (Guillén et al., 2021) and self-efficacy (Heiland & Veilleux, 2021) have been reported among patients with BPD. The present study evaluates the psychometric properties of a Scandinavian adaptation of the Brief Borderline Personality Features Scale for Children (BPFSC-11; Sharp et al., 2014). For comparative purposes, it is advantageous to incorporate assessment instruments utilized in prior validation studies. Furthermore, the inclusion of psychometrically robust measures assessing psychological constructs empirically and theoretically associated with borderline personality disorder (BPD) features is recommended to enhance the comprehensiveness of the evaluation. Historically, there has been debate over the appropriateness of diagnosing BPD in pre-adolescents, and there is no current consensus that BPD is both a valid and reliable diagnosis for this age group. Therefore, early identification of BPD features allows for prompt treatment for these young individuals, ultimately alleviating personal distress and reducing societal expenses. However, early identification of BDP features depends on a careful and accurate assessment of personality pathology in pre-adolescents and adolescents (Sharp et al., 2014). Over the past two decades, the field has witnessed significant evolution in recognizing and assessing borderline traits in youth. Early skepticism was rooted in concerns about the stability of personality in childhood and the potential for stigma (Miller et al., 2008). However, accumulating evidence has demonstrated that core features of BPD—such as affective instability, impulsivity, and interpersonal difficulties—can be reliably identified in adolescence and even late childhood and that these features are associated with significant functional impairment (Chanen & Kaess, 2012). This shift has prompted the development of age-appropriate assessment tools, including both self-report measures and structured interviews.
Recent reviews further underscore the importance of dimensional approaches to assessment, highlighting the continuity of borderline pathology across development and the utility of early screening for prevention and intervention (Leichsenring et al., 2024). These advances reflect a growing consensus that, while caution is warranted, assessing borderline traits in children and adolescents is feasible and clinically meaningful. As such, ongoing research continues to refine assessment strategies, improve early detection, and inform tailored interventions for at-risk youth (Laczkovics et al., 2025; Leichsenring et al., 2024).
To complement clinical assessment, reliable and valid self-report instruments are both important and valuable, yet they are also time- and cost-effective. Moreover, such tools should focus on dimensional personality models, particularly when assessing maladaptive personality functioning among adolescents. By evaluating symptoms across the entire latent trait of borderline personality, it becomes possible to identify not only those exhibiting clinically significant levels of symptoms but also individuals who may be at risk (Sharp et al., 2014). Such an approach also aligns with the DSM-5 (APA, 2013) alternative dimensional model for assessing BPD (Leichsenring et al., 2024).
The brief Borderline Personality Features Scale for Children (BPFSC-11; Sharp et al., 2014), using item response theory (IRT), was developed from the 24-item Borderline Personality Features Scale for Children (BPFSC; Crick et al., 2005). The BPFSC-11 is a dimensional measure developed by collecting data from a community sample of 964 adolescents (mean age = 15.1 years, SD = .79; 55.9% female; Sharp et al., 2014). Sharp et al. (2014) examined the BPFSC-11, and they reported adequate construct validity by comparing the interviews with the original BPFSC among adolescents who met BPD criteria and those who did not, using semi-structured clinical interviews. Correlation analyses were conducted using the Difficulties in Emotion Regulation Scale (DERS; Gratz & Roemer, 2004) and the Deliberate Self-Harm Inventory (DSHI: Gratz, 2001) to assess emotional dysregulation and self-harm. A hypothesized four-factor structure was not supported. Instead, support for a unidimensional factor structure was reported (Sharp et al., 2014). Examining the BPFSC-11 within a sample of 805 (mean age = 16.42 years, SD = 1.47; 64% female) Italian adolescents, Fossati et al. (2019) did not support a one-factor solution of the BPFSC-11 items. A bi-factor model analysis indicated a general factor and two specific factors. Fossati et al. (2019) reported Cronbach’s α = .78, a moderate (r = .50) for 6-month test-retest correlation, and gender invariance across the BPFSC-11 items. Calvo et al. (2023) assessed a mixed sample of 145 Spanish children and adolescents (mean age = 15.51 years, SD = 2.21; 62.1% female), comprising 58 individuals diagnosed with BPD, 58 with ADHD, and 29 healthy volunteers as a control group. Applying an Explorative Factorial Analysis (EFA) demonstrated a two-factor solution, whereas six items (1, 4, 6, 7, 9, 11) were included in factor 1 (Emotional dysregulation), and three items (5, 8, 11) were included in factor 2 (impulsivity/recklessness). Two items (2, 3) exhibited nearly identical loads across both factors. The reliability of the total BPFSC-11 score based on the 11 items was α = 0.86 overall, and α = 0.89 and α = .59 for factors 1 and 2, respectively. Furthermore, the BPFSC-11 total scores on factor 1 appeared to discriminate between the BDP, ADHD, and healthy control groups, with the BDP group reporting significantly higher scores. In contrast, the ADHD group reported significantly higher scores on factor 2 than the other two groups. A mixed sample of 1600 adolescents was assessed in Pakistan, including outpatients seen in a BPD psychiatric ward program (n = 300) and healthy controls between 12 and 19 years old, 55% of whom were female. Bibi and Kazmi (2021) reported a two-factor structure of the BPFSC-11 applying an EFA and a CFA. Factor 1 was named Intra-/interpersonal preoccupation (items 2, 6, 9, 11), and factor 2 (Items 1, 4, 5), with Cronbach’s α = .79 and α = .84 for the two factors, respectively.
In their examination of the Borderline Personality Features Scale for Children (BPFS-C; Crick et al., 2005), Haltigan and Vaillancourt (2016) found that the initially proposed four-factor structure was not supported in their sample of Canadian adolescents aged 13–16 years (N = 566; 55.5% female). Instead, their follow-up EFA and CFA indicated a refined two-factor latent structure consisting of an intra- and interpersonal preoccupation factor and an impulsivity/reactivity factor based on eleven items of the BPFS-C. Furthermore, measurement invariance modeling demonstrated that this two-factor structure was stable over time, suggesting that it held a consistent empirical meaning for both sexes across different time points. In a subsequent study, Vanwoerden et al. (2019) assessed the invariance of the BPFSC-11 items in a diverse community sample of 755 adolescents (mean age = 15.83, SD = .67; 56% female) in Texas, USA. Their findings revealed partial measurement invariance between genders and full longitudinal invariance from adolescence into young adulthood. Assessing a combined community-based sample (n = 379) and clinical sample (n = 74) of Lithuanian adolescents aged 11–18 revealed scale invariance for gender and partial invariance for age (Allman et al., 2025).
Taken together, previous studies (Allman et al., 2025; Bibi & Kazmi, 2021; Calvo et al., 2023; Fossati et al., 2019; Sharp et al., 2014; Vanwoerden et al., 2019) have examined the psychometric properties of the BPFSC-11, indicating promising validity and reliability for the inventory. Nevertheless, existing studies have shown varying factor structures (unidimensional, bi-factor, and two-factor), and there is a need for further establishment of concurrent and discriminant validity. Moreover, while the introduction mentions studies from various countries (USA, Italy, Spain, Pakistan, Lithuania, and Canada), a more comprehensive cross-cultural validation is needed. Finally, although Vanwoerden et al. (2019) reported partial measurement invariance between genders and full longitudinal invariance, more extensive measurement invariance testing across different groups and time is needed. More specifically, testing invariance not only across gender but also across an intervention and a control group, as well as two cultural groups living in the same cultural settings, is beneficial. Moreover, recognizing the multifaceted nature of borderline pathology, including additional psychometrically sound instruments that capture related psychological constructs, such as self-efficacy, resilience, anxiety, depression and emotion regulation, allows for a more nuanced evaluation of the BPFSC-11’s validity but also aligns with contemporary recommendations for personality pathology research in youth (Sharp & Cervantes, 2023). Addressing these aspects would provide a more comprehensive understanding of BPFSC-11’s psychometric properties and applicability across diverse populations and settings.
To our knowledge, no studies have reported using an EFA and a CFA of the BPFSC-11 on the same sample with a 1-year interval between the two assessments. Thus, this study has several objectives. First, we report descriptive statistics for the BPFSC-11. Second, we report internal consistency. Third, we conduct an EFA and a CFA one year after the initial analysis. Fourth, we examine convergent and concurrent validity by comparing the BPFSC-11 with other established batteries of inventories that assess areas such as resilience, self-efficacy, depression, social anxiety, anxiety sensitivity, and emotional dysregulation. Finally, we test measure invariance to ensure the stability of measure structure and meaning across five groups: sex assigned at birth, born in Norway, speaking primarily Norwegian at home, by treatment group, and longitudinally.
Materials and Method
Participants
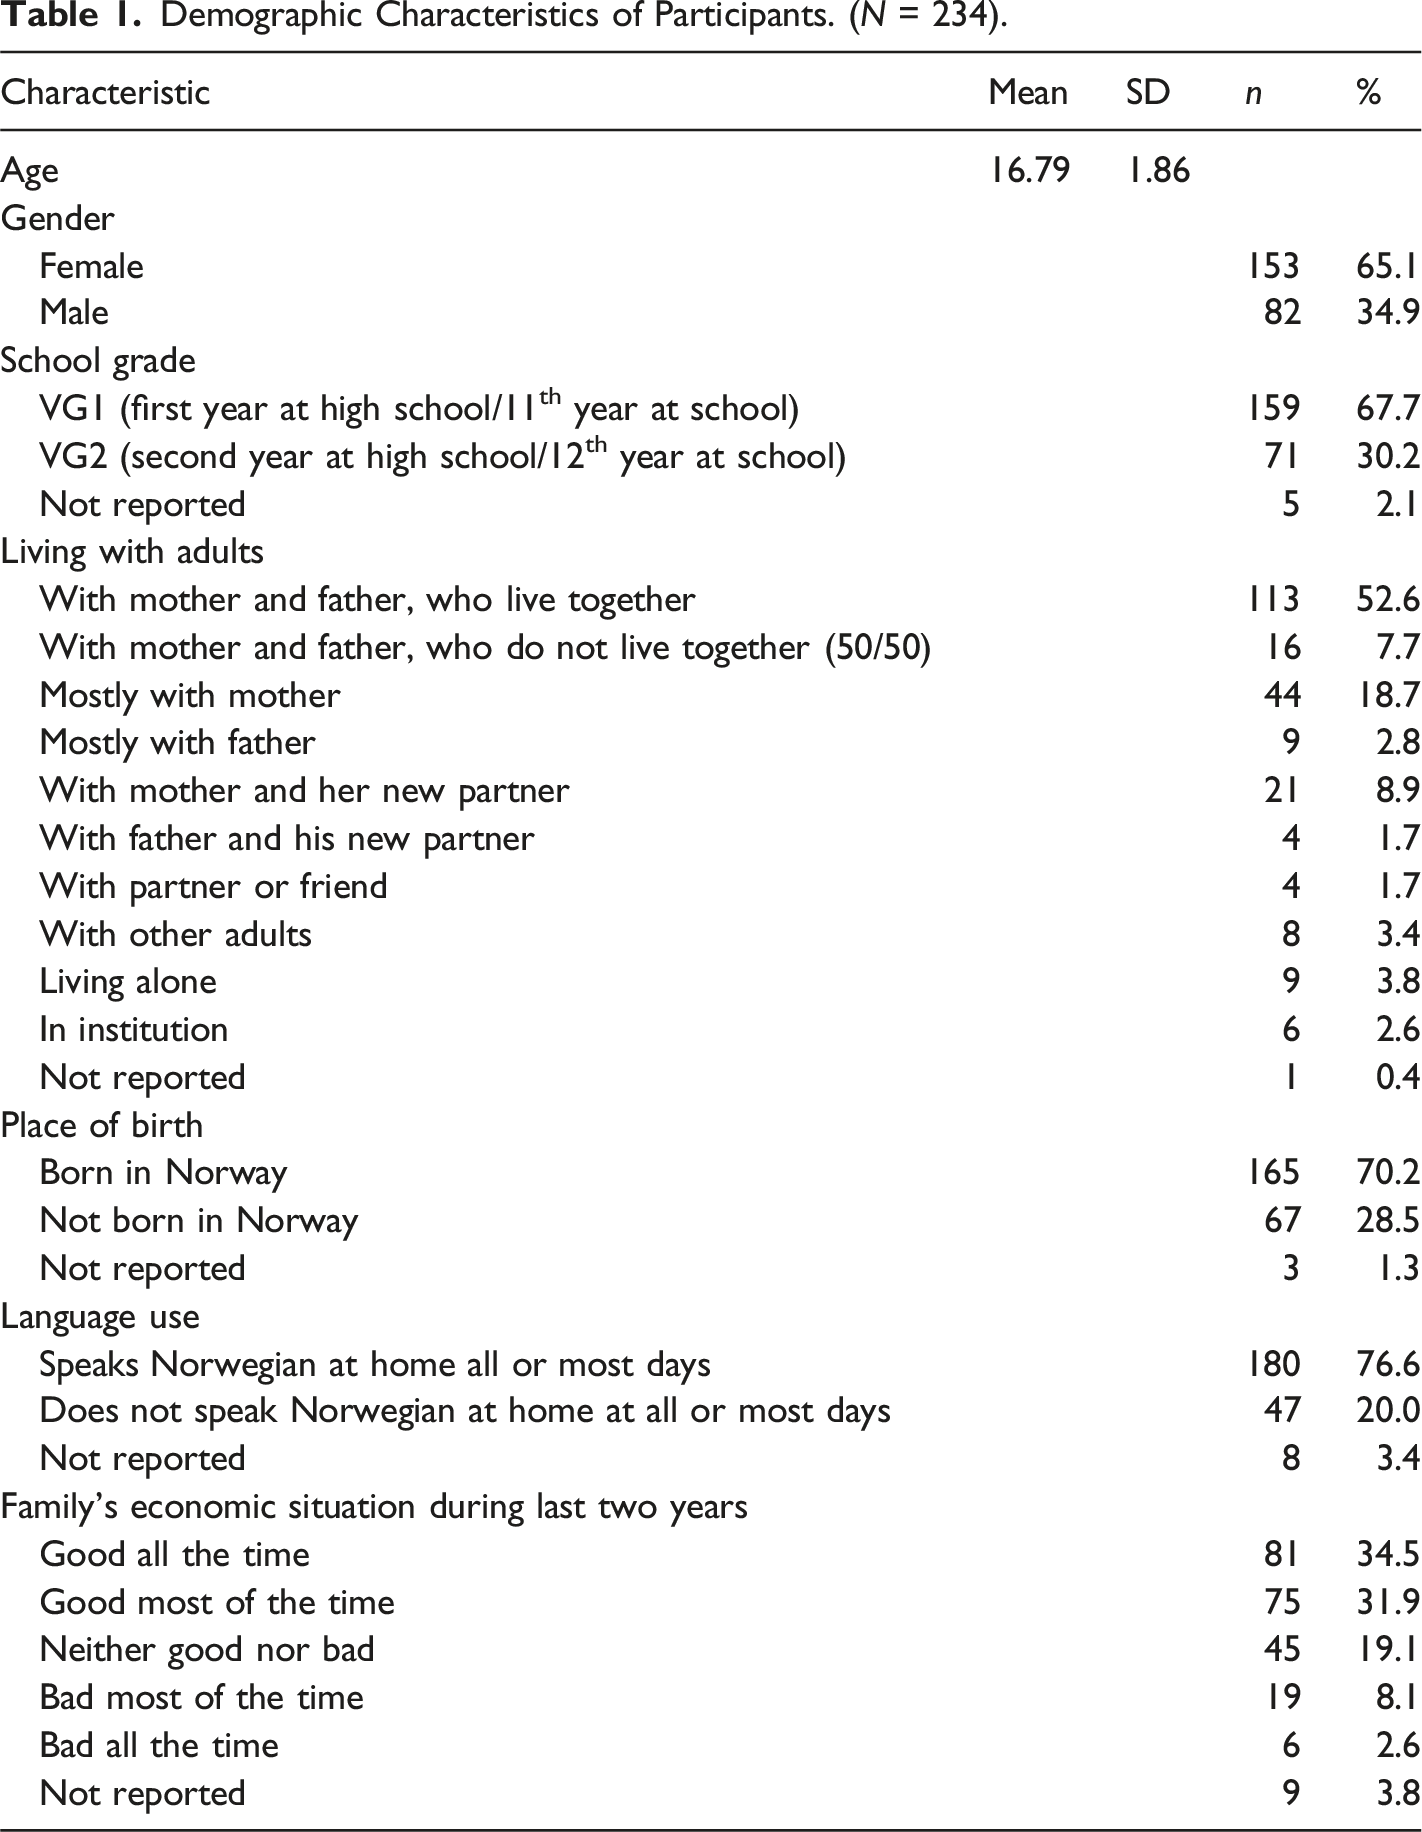
Demographic Characteristics of Participants. (N = 234).
Measures
The BPFSC-11 (Sharp et al., 2014) is an 11-item inventory that assesses borderline traits. Items are rated on a Likert-type scale of 1 (never true) to 5 (always true) (total score 11–55). It captures behaviors that reflect core BPD features (e.g., affective instability, identity problems, and negative relationships; Sharp et al., 2014). The BPFSC-11 has shown good criterion validity, internal consistency, test–retest reliability, and satisfactory Cronbach’s alpha coefficients of .79–.85 (Fossati et al., 2019; Sharp et al., 2014). Permission was obtained from the developer of the BPFSC-11, Carla Sharp, to translate it into Norwegian. The first author and Kyrre Svara translated it, with input from four adolescents as language consultants. Geir Pedersen and Øyvind Urnes, experts in assessing BPD, contributed to the final phase of developing the official Norwegian version. A licensed interpreter translated BPFSC-11 back into the source language, and Carla Sharp approved the back translation. In our sample, the BPFSC-11 demonstrated Cronbach’s alpha of .87.
Anxiety Sensitivity Index (ASI-3; Taylor et al., 2007). ASI is an 18-item self-report measure, rated on a four-point Likert scale (0 = “not at all” to 4 = “very much”). The higher the score, the more severe the level of anxiety sensitivity. The ASI-3 has shown good convergent, discriminant, and criterion-related validity (Taylor et al., 2007), and it is affected by age, education level, and gender. Taylor et al. (2007) reported Cronbach’s Alpha of .90 for the ASI-3. The present study observed an excellent Cronbach’s Alpha for the Inventory (α = .93).
Self-efficacy Questionnaire for Children (SEQ-C; Muris, 2001) is a 24-item self-report instrument measuring individual self-efficacy among adolescents using a five-point Likert scale in three main areas of self-efficacy. Xie et al. (2023) showed excellent internal consistency, good construct validity, and acceptable convergent validity for the SCQ-C. A total self-efficacy score is obtained by summing the scores across the responses to all 24 items. Tan and Chellappan (2018) reported an internal consistency of 0.89 from a study of Malaysian adolescents. The present study also observed excellent Cronbach’s alpha for the SEQ-C (α = 0.91).
Resilience Scale for Adolescents (READ) is a 28-item self-report questionnaire designed to assess the five protective resources: personal competence, social competence, structured style, family cohesion, and social resources to understand stress adaptation (Hjemdal et al., 2006). It has a five-point Likert scale. Higher scores indicate a higher level of protective traits. Assessing a large population-based sample of adolescents, Askeland et al. (2020) demonstrated adequate construct validity for the READ. Cronbach’s alpha, ranging from .88 to .94, has been reported (Askeland & Reedtz, 2015). This study used a 14-item abbreviated version of READ, revealing Cronbach’s alpha of .91.
The Difficulties in Emotion Regulation Scale (DERS; Gratz & Roemer, 2004) is a 36-item self-report measure to assess emotion regulation. Items are rated on a scale of 1–5. Higher scores indicate more difficulty in emotion regulation. Gratz and Roemer (2004) have shown that DERS has strong construct validity. In the present study, four factors of the original DERS were included in the questionnaire booklet. They made up the DERS total score: nonacceptance of emotional responses, difficulty engaging in goal-directed behavior, lack of emotional awareness, and limited access to emotion regulation strategies. A total score was obtained by summing the items from the four subscales (ranging from 25 to 125). Cronbach’s alpha for the DERS total is 0.87.
The Social Phobia and Anxiety Inventory-23 (SPAI-23) (Roberson-Nay et al., 2007) is an abbreviated version of the original SPAI questionnaire (Turner et al., 1989). The SPAI-23 contains 23 items and includes two subscales—agoraphobia and social phobia—rated on a five-point Likert scale ranging from 0 to 4 (never to always). Roberson-Nay et al. (2007) reported strong factor loadings for all items, high correlations between the subscales of SPAI-23 and the original SPAI, and a Cronbach’s alpha of .95 for the SPAI-23 Social Phobia subscale. The present study observed an excellent Cronbach’s alpha coefficient for the SPAI-23 Social Phobia subscale (α = .96).
The Depression Anxiety Stress Scale (DASS-21; Lovibond & Lovibond, 1995) is a 21-item self-report measure that assesses three facets of negative emotion: depression, anxiety, and stress/tension. Each scale contains seven items on a four-point Likert scale. Brown et al. (1997) reported excellent internal consistency, reliability, and concurrent validity. We used the DASS-21 depression scale, demonstrating high internal consistency (Cronbach’s α = .90).
Statistical Analysis
We conducted descriptive analyses using SPSS Statistics for Windows (v. 27.0; IBM SPSS, Armonk, NY, USA). We assess and report concurrent and convergent validity using correlation estimates (Pearson product-moment) across all the included measurements. We expected a high positive correlation between BPFSC-11 and DERS, indicating convergent validity, whereas positive moderate correlations were expected between the BDFSC-11 and ASI, DASS-21, and the Spai-23 measure, showing concurrent validity. In contrast, negative moderate correlations were expected between BPFSC-11 and the READ and Self-efficacy scales. The means and standard deviations for the individual items in BPFSC-11 were reported, as well as the internal consistency (Cronbach’s alpha) of the overall BPFSC-11, and the various extracted factors. Additionally, we performed an exploratory factor analysis (EFA) for the sample examined at assessment point I and a CFA conducted one year later. A normed fit index (χ2/df) close to 2 is acceptable and assesses how well the model fits the data given its complexity. The acceptable values for GFI (goodness-of-fit index), AGFI (adjusted goodness-of-fit index), CFI (comparative fit index), and IFI (incremental fit index) are.90 or greater. For RMSEA (root mean square error of approximation), <.05 and <.08 are considered excellent and acceptable fits, respectively (Tabachnick & Fidell, 2007). Measurement invariance was analyzed to assess consistency across five groups (sex assigned at birth, whether participants were born in Norway, whether Norwegian is the language spoken most at home, intervention group, and longitudinally). According to Chen’s guidelines for determining invariance (Chen, 2007), metric non-invariance is indicated by a change of ≥.010 in RMSEA and a change of ≤ −.005 in CFI, or a change of ≥.025 in SRMR when comparing configural and metric models. For scalar invariance, as determined by comparing the scalar and metric models, metric non-invariance is indicated by a change of ≥.010 in RMSEA and a change of ≥ −.005 in CFI, or a change of ≥.005 in SRMR.
Ethics
This research was performed according to the World Medical Association’s code of ethics (Declaration of Helsinki) for experiments involving humans. The study was approved by the Norwegian Regional Committee for Medical and Health Research Ethics (REK, 2017/1938). The Norwegian Centre for Research Data (#53960) also approved the study. Written informed consent was obtained after the participants were provided with a complete study description.
Results
BPFSC-11 Descriptive Statistics and Internal Consistency Analyses
Means, Standard Deviation (SD), Factor Loadings, and Communalities for the EFA of the Borderline Personality Feature Scale for Children BPFSC-11.
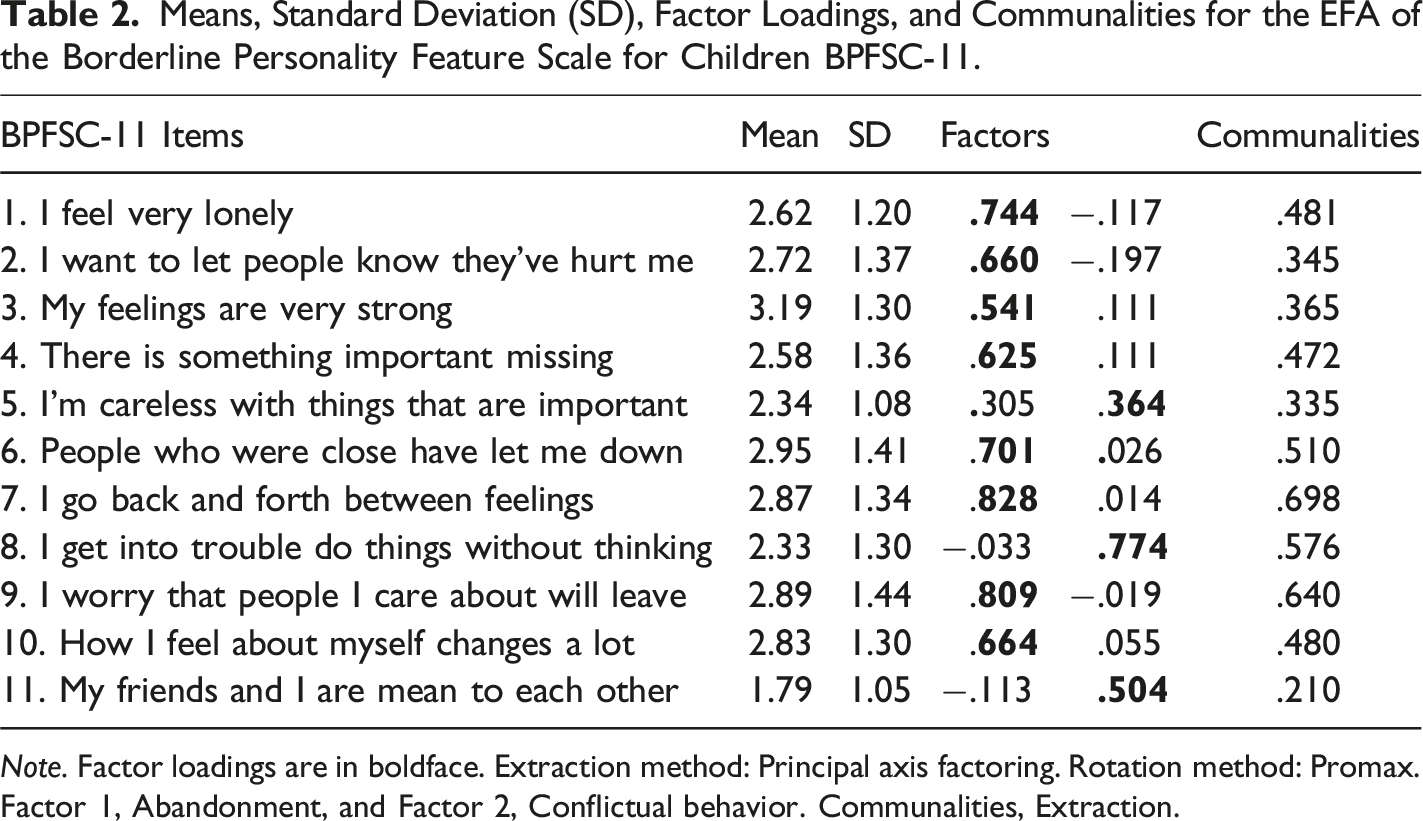
Note. Factor loadings are in boldface. Extraction method: Principal axis factoring. Rotation method: Promax. Factor 1, Abandonment, and Factor 2, Conflictual behavior. Communalities, Extraction.
Exploratory Factor Analysis
The BPFSC-11 questionnaire was subjected to EFA using the Principal Axis Factoring (PAF) extraction method and the ProMax oblique rotation, as it was expected that the items would be related conceptually. Communalities ranged from .21 to .70, as shown in Table 2. The Kaiser-Meyer-Olkin (KMO) test showed an adequacy index of .88. After considering multiple methods such as Kaiser’s criterion, Cattell’s scree plot, theoretical considerations, the previously reported factor analysis, and item inspection, it was concluded that the adequate solution was a two-factor structure.
Loading Patterns
In Table 2, the initial analysis showed that two factors accounted for 56.3% of the total variance. Factor 1 represented 44.1%, and Factor 2 represented 12.1% of the explained variance. The eigenvalues for Factors 1 and 2 were 4.86 and 1.34, respectively.
Factor 1 (Abandonment)
Factor 1 contained eight items (items 1, 2, 3, 4, 6, 7, 9, and 10), which appeared to measure identity difficulties/affective instability and abandonment (e.g., “How I feel about myself changes a lot”) and was named Abandonment. The factor loading varied from .54 to .83. Internal consistency (α = .88) was revealed for the Abandonment factor.
Factor 2 (Conflictual Behavior)
Factor 2 contained three items (items 5, 8, and 11), which appeared to measure hostile relations, hostility, and carelessness (e.g., “My friends and I are mean to each other”). This was called Conflictual behavior, although the factor loadings varied from .36 to .77. A moderate internal consistency of α = .56 was revealed for this factor.
Factor Correlations
The two factors were moderately correlated (r = .49), confirming the appropriateness of a Promax-rotated solution (Fabrigar et al., 1999).
Confirmatory Factor Analysis
Figure 1 depicts the CFA, demonstrating that most items reveal standardized correlations of.64 or higher. The exception is item 11, which correlates of .43 with Factor 2. This item also revealed a relatively low factor loading in the EFA (Table 2) and a low commonality (.21). This item was deleted from the model, and the CFA was re-estimated. The two-factor CFA model of the BPFSC-11 inventory shows the correlation factor and standardized regression coefficients.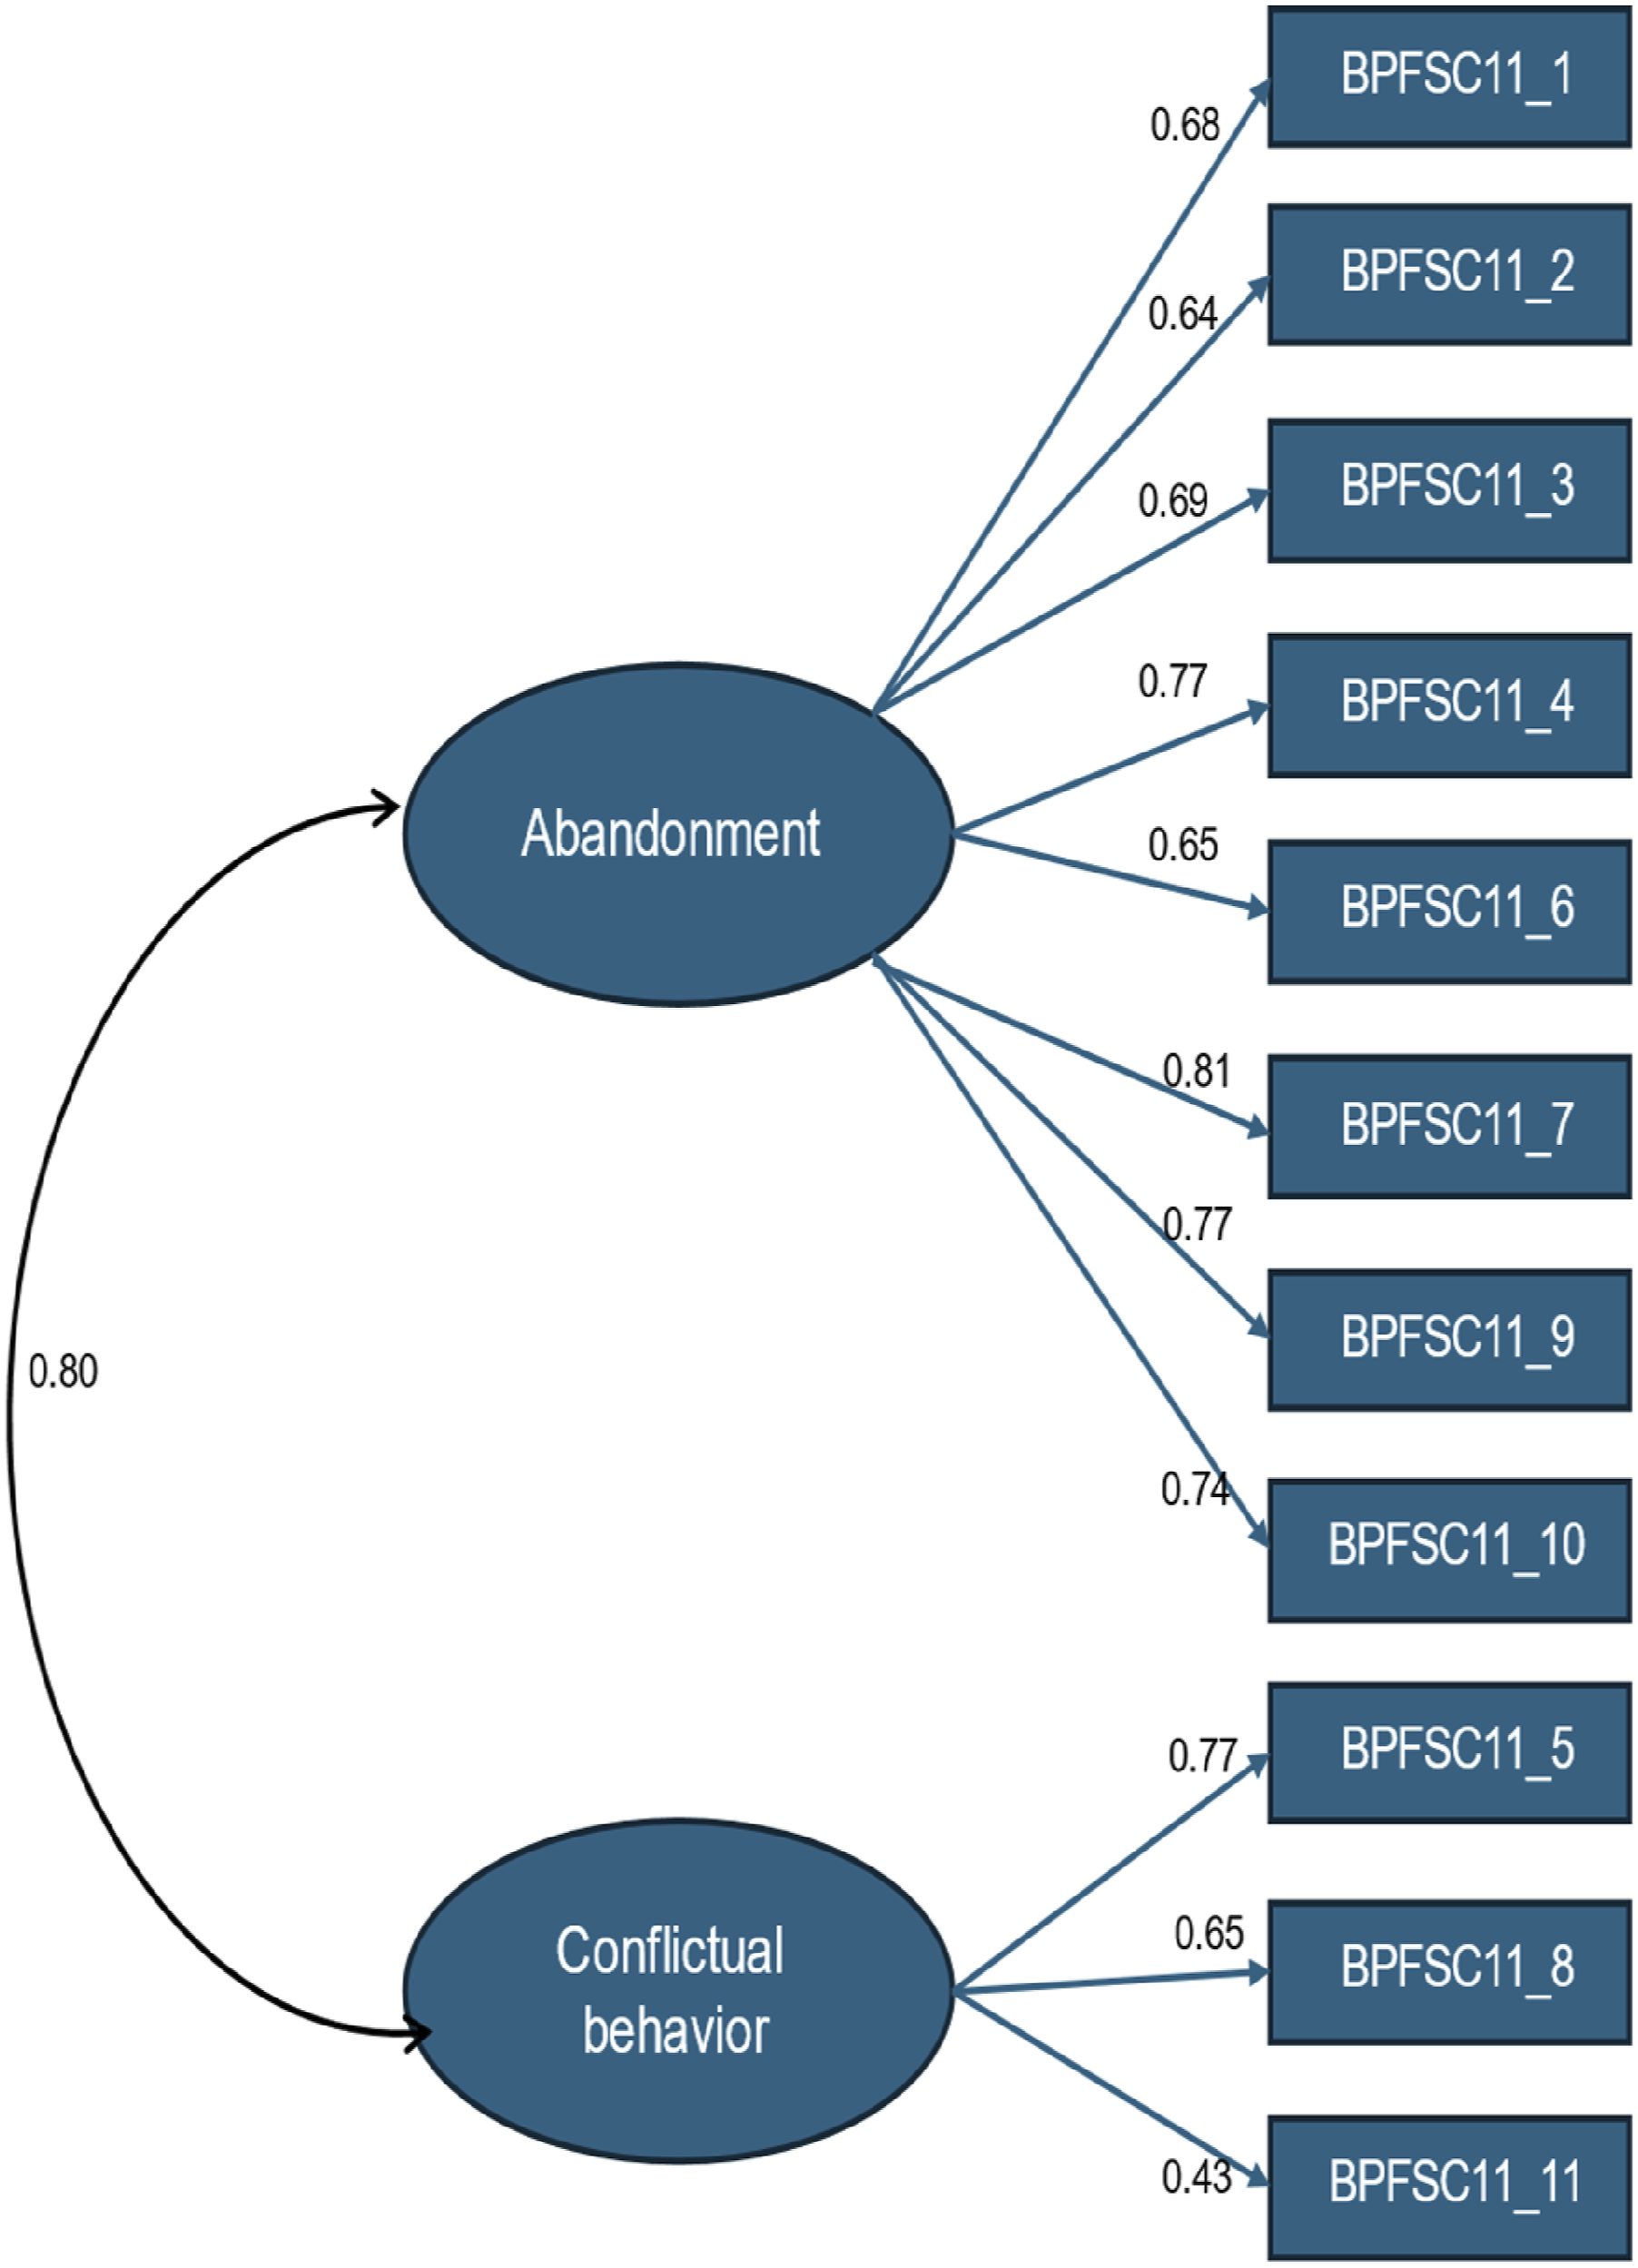
Model Fit Indices for BPFSC-11.
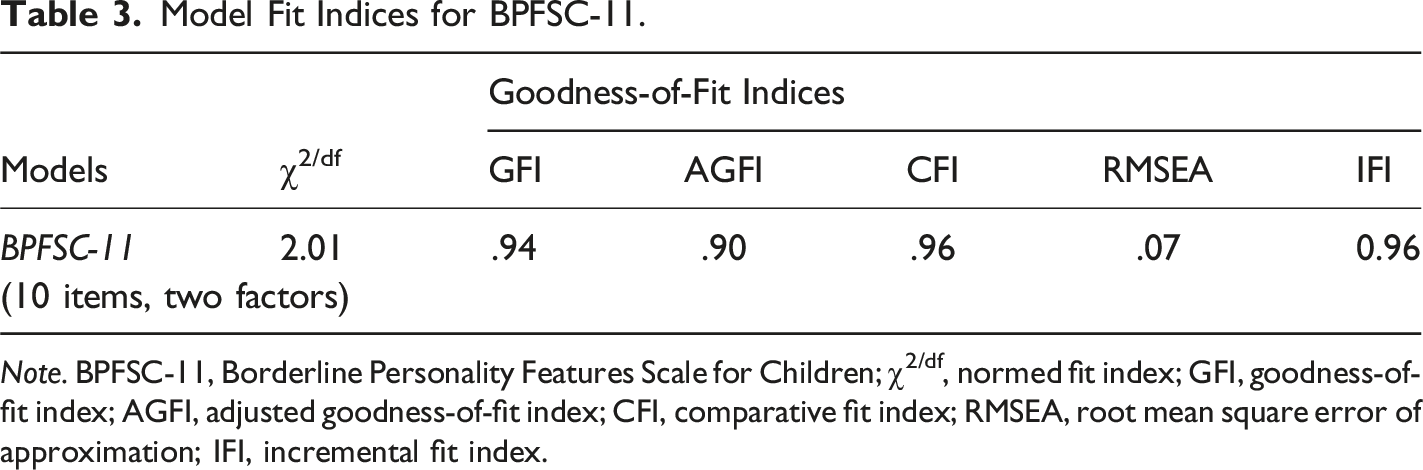
Note. BPFSC-11, Borderline Personality Features Scale for Children; χ2/df, normed fit index; GFI, goodness-of-fit index; AGFI, adjusted goodness-of-fit index; CFI, comparative fit index; RMSEA, root mean square error of approximation; IFI, incremental fit index.
Convergent and Concurrent Validity of the BPFSC-11
Person’s Correlations (r) Estimate Mean Scores (M) and Standard Deviations (SD) Across Various Scales.
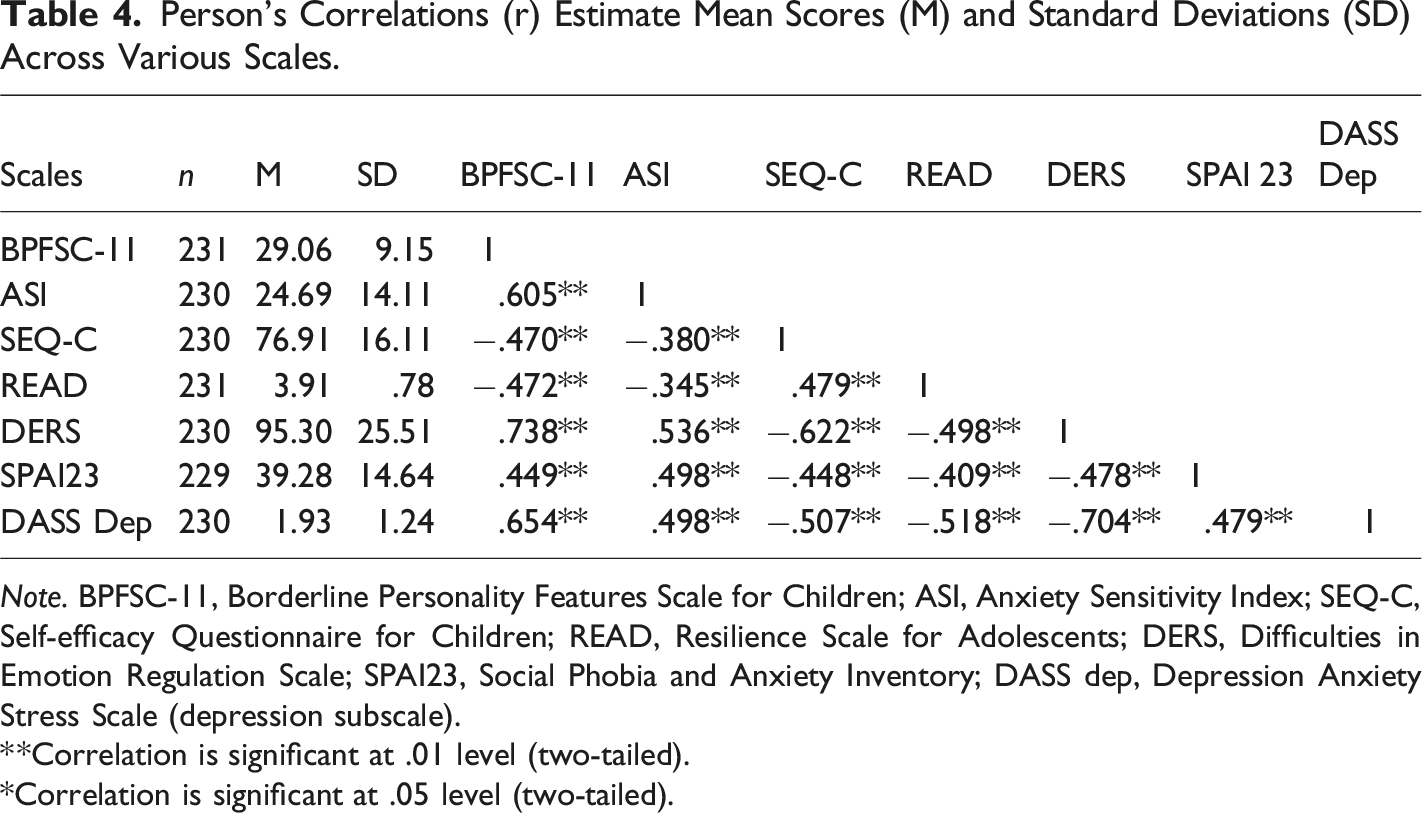
Note. BPFSC-11, Borderline Personality Features Scale for Children; ASI, Anxiety Sensitivity Index; SEQ-C, Self-efficacy Questionnaire for Children; READ, Resilience Scale for Adolescents; DERS, Difficulties in Emotion Regulation Scale; SPAI23, Social Phobia and Anxiety Inventory; DASS dep, Depression Anxiety Stress Scale (depression subscale).
**Correlation is significant at .01 level (two-tailed).
*Correlation is significant at .05 level (two-tailed).
As expected, the BPFSC-11 showed moderate to strong correlations with the included measurements. We found a positive, strong association of .74 between the BPFSC-11 and the DERS, indicating concurrent validity, which is similar to what was reported by Sharp et al. (2014) for these two scales. Moderate correlations were shown between the BPFSC-11 and DASS-21, ASI, and SPAI-23, with the strongest association between borderline features and depressive symptoms. We also discovered significant negative correlations of.47 between the BPFSC-11 and both self-efficacy and resilience.
Measurement Invariance (BPFSC-11)
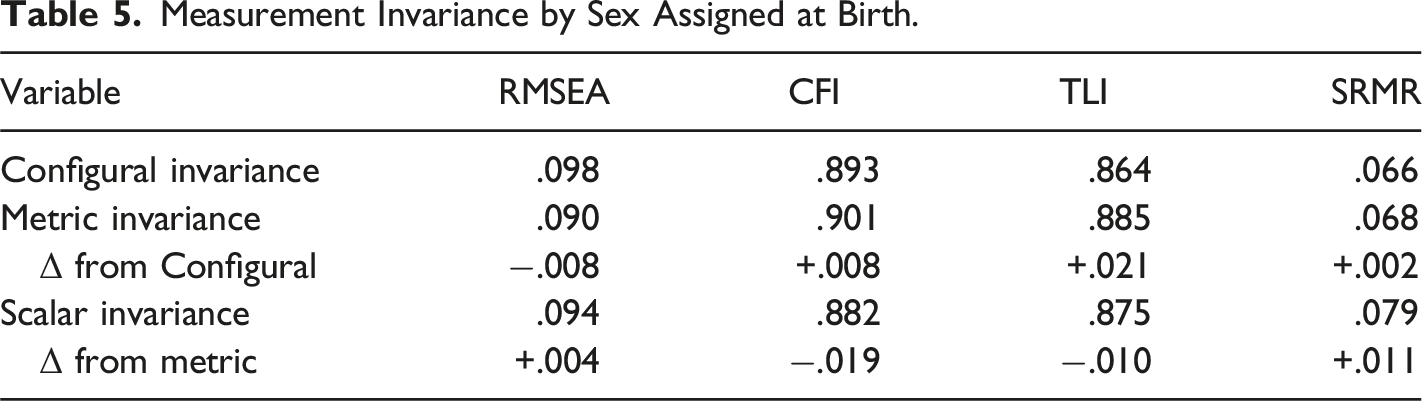
Measurement Invariance by Sex Assigned at Birth.
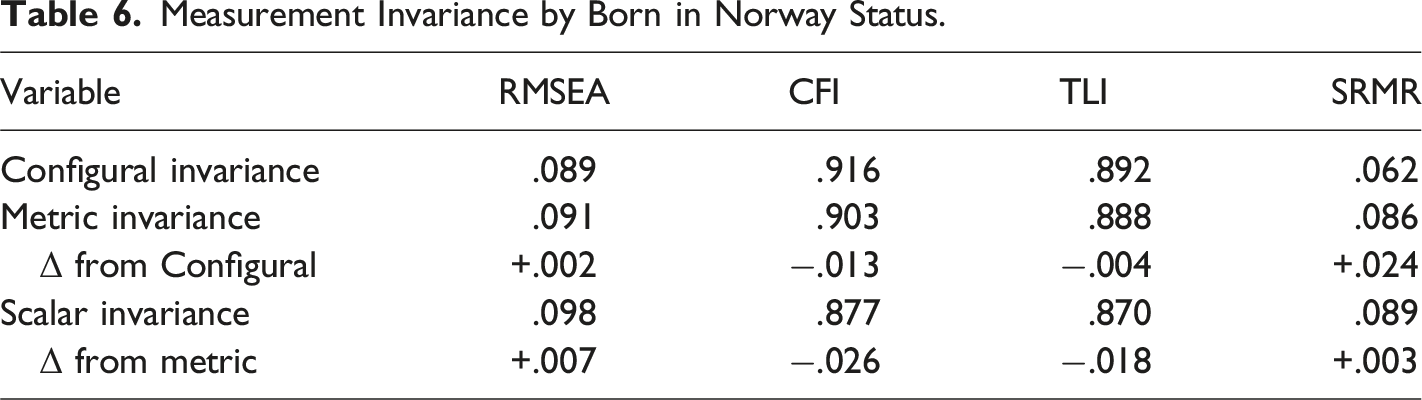
Measurement Invariance by Born in Norway Status.
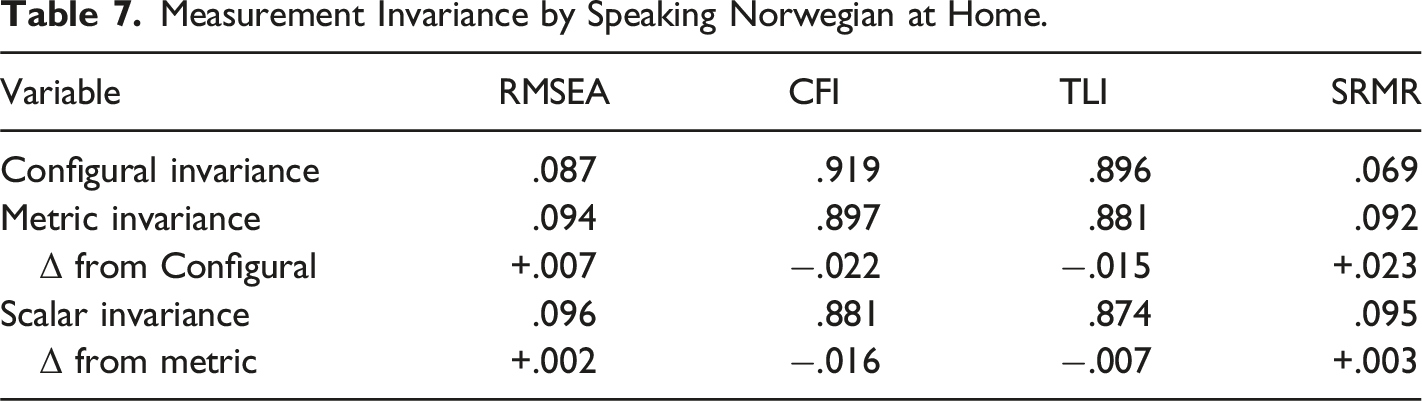
Measurement Invariance by Speaking Norwegian at Home.
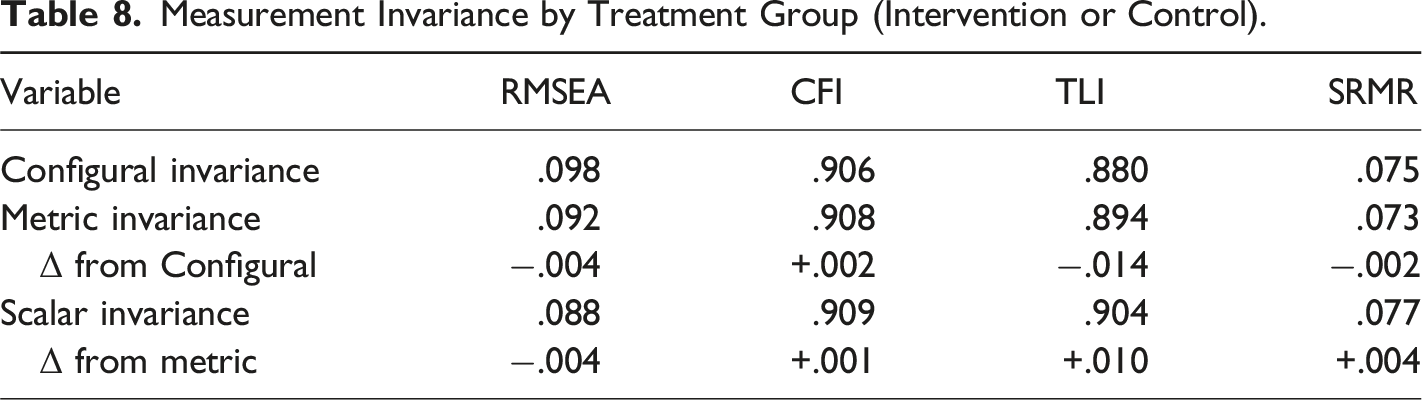
Measurement Invariance by Treatment Group (Intervention or Control).
For sex assigned at birth (Table 5) the model fit the data well with significant factor loadings for all items, χ2(86) = 181.418, p < .001, CFI = .893, RMSEA = .098 (90% CI = .078, .118), SRMR = .066. Constraining factor loadings to be equivalent across sex did not result in changes to fit, relative to the configural model, indicating metric invariance. Finally, there was no substantial decreases in model fit, relative to the metric model, after constraining factor loadings and item intercepts to be identical and allowing factor means to vary across sex, indicating no scalar variance.
For the variable “whether participants were born in Norway” (Table 6), the model fit the data well with significant factor loadings for all items, χ2(86) = 164.695, p < .001, CFI = .916, RMSEA = .089 (90% CI = .069, .110), SRMR = .062. Constraining factor loadings to be equivalent across status of being born in Norway did not result in changes to fit, relative to the configural model, indicating metric invariance. Finally, there was no substantial decreases in model fit, relative to the metric model, after constraining factor loadings and item intercepts to be identical and allowing factor means to vary across status of birth in Norway, indicating no scalar variance.
For whether participants speak Norwegian primarily at home (Table 7) the model fit the data well with significant factor loadings for all items, χ2(86) = 159.553, p < .001, CFI = .919, RMSEA = .087 (90% CI = .066, .108), SRMR = .069. Constraining factor loadings to be equivalent across speaking Norwegian at home did not result in changes to fit, relative to the configural model, indicating metric invariance. Finally, there was no substantial decreases in model fit, relative to the metric model, after constraining factor loadings and item intercepts to be identical and allowing factor means to vary across speaking Norwegian at home, indicating no scalar variance.
For participants who completed both time points (n = 196), an analysis of measurement invariance was conducted by treatment group (Table 8). The model fit the data well with significant factor loadings for all items, χ 2 (86) = 166.467, p < .001, CFI = .906, RMSEA = .098 (90% CI = .076, .120), SRMR = .075. Constraining factor loadings to be equivalent across treatment group did not result in changes to fit, relative to the configural model, indicating metric invariance. Finally, there was no substantial decrease in model fit, relative to the metric model, after constraining factor loadings and item intercepts to be identical and allowing factor means to vary across treatment groups, indicating no scalar variance.
Longitudinal Measurement Invariance by Time 1 and Time 2.
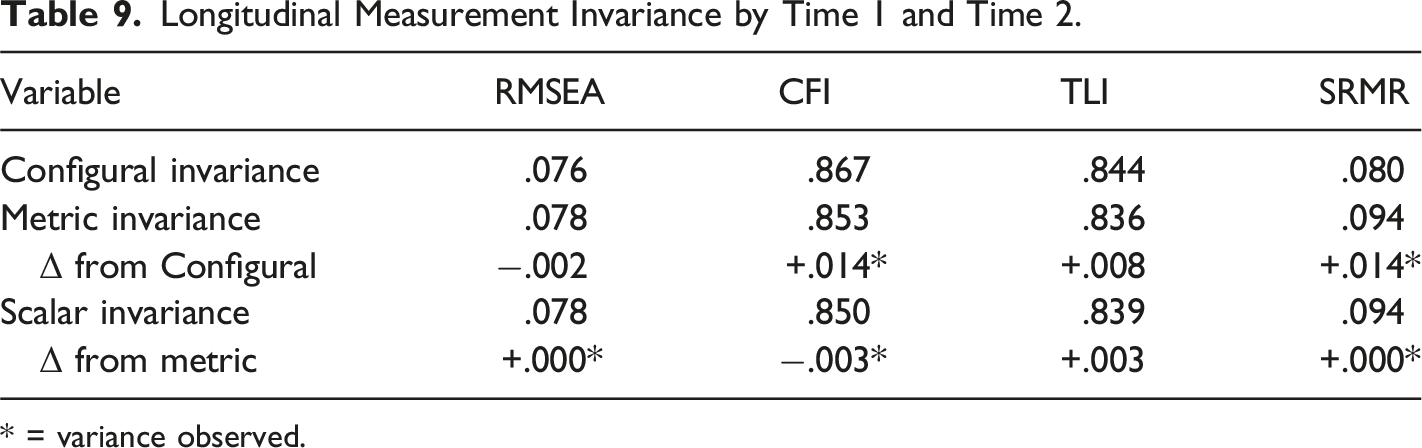
* = variance observed.
Taken together, the Norwegian version of the BPFSC-11 demonstrated strong internal consistency in our adolescent sample, with a Cronbach’s alpha of .87. This reliability estimate closely parallels findings from previous studies in European adolescent populations, including Fossati et al. (2019) in Italy (α = .78) and Calvo et al. (2023) in Spain (α = .86). The 12-month test-retest correlation in our sample was r = .71, which is notably higher than the six-month test-retest correlation of r = .50 reported by Fossati et al. (2019). The mean BPFSC-11 score in our sample (M = 29.06, SD = 9.15) was comparable to that reported by Fossati et al. (2019; M = 28.08, SD = 6.56), while Calvo et al. (2023) observed mean scores of 35.8 (SD = 7.9) in a BPD group, 27.7 (SD = 6.9) in an ADHD group, and 22.5 (SD = 8.3) in a control group. Consistent with Fossati et al. (2019), the best-fitting model in our sample was the two-factor model, with factor loadings ranging from .36 to .83, compared to .14 to .70 in Fossati et al. (2019). The same three items (5, 8, and 11) loaded on the same factor (factor 2) in both studies. Calvo et al. (2023) also identified two factors (Factor 1 item; 1, 4, 6, 7, 9, and 10: Factor 2; items 5, 8, and 11) with higher factor loadings (.64–.84) than those reported by Fossati et al. (2019), and a similar pattern to our findings. However, in contrast to our results, items 2 and 3 in Calvo et al. (2023) loaded similarly and above .40 in both factors, and three items (4, 7, and 10) from factor 1 also loaded above .40 on factor 2. Additionally, as we revealed in our study, gender invariance was confirmed in the Fossati et al. (2019) study.
Discussion
EFA indicates that two factors appeared to underline the 11 items (1. Abandonment; 2. Conflictual behavior). The significance of this solution was confirmed using a CFA. The high correlation between borderline personality features (BPFSC-11) and emotional dysregulation (DERS) indicates adequate convergent validity. Furthermore, correlation analyses between BPFSC-11 and measures assessing depression, anxiety sensitivity, and social anxiety disorder symptoms showed concurrent validity for the BPFSC-11. Compared with established measures of self-efficacy and resilience, the BPFSC-11 showed a moderate and negative correlation.
Upon inspection of the items, it was found that the mean score varies from 1.79 (item 11) to 3.19 (item 3), with an average score of 2.65. Fossati et al. (2019) reported similar results. Vanwoerden et al. (2019) reported a mean score of 2.31 and item scores ranging from 1.98 (item 11) to 2.73 (item 3) in a study using a community sample of 755 American adolescents. The differences in mean scores may be due to sample characteristics, such as age and gender distribution, as well as cultural differences between the US and Europe. Fossati et al. (2019) and Calvo et al. (2023) reported a two-factor model solution similar to the results of this study. However, the Fossati et al. (2019) and Calvo et al. (2023) studies differed in the items loaded on Factor 1. In contrast, comparing the two factors in this study with those of Calvo et al. (2023) revealed almost identical item distributions. On the other hand, in our study, all items were accurately distributed across two factors. In contrast, in the Calvo et al. (2023) study, only nine items were included in the final model. Moreover, in that study, most items loaded heavily on both factors.
We also included established psychometrically sound instruments to examine the concurrent validity of the BPFSC-11. According to the DSM-5 (APA, 2013), the essential feature of BPD is a pervasive pattern of affective instability. High and statistically significant correlations between borderline personality features (BPFSC-11) and emotional dysregulation (DERS) demonstrate adequate convergent validity. The results are almost identical to those reported by Sharp et al. (2014) (r = .71) but significantly higher than those shown by Somma et al. (2017) (r = .55), combining the same two instruments. Anxiety sensitivity is a stable individual difference characteristic that involves a propensity to develop beliefs that anxiety-related symptoms will have negative, destructive somatic, cognitive, and social consequences (Gratz & Roemer, 2008; Reiss, 1991). Gratz and Roemer (2008) and Doyle et al. (2022) have shown that anxiety sensitivity distinguishes outpatients with BPD from outpatients with no personality disorders. Doyle et al. (2022) showed that anxiety sensitivity predicted BPD over and beyond emotion dysregulation of impulsivity. Further, BPD and major depressive disorder commonly co-occur (Yoshimatsu & Palmer, 2014) and have high comorbidity with satisfaction with life and depressive symptoms in adolescence (Winograd et al., 2008). Thus, a correlation of .65, explaining 42% shared variance between borderline disorder features (BPFSC-11) and depressive symptoms (DASS), indicates a high association between these two scales. A moderate and positive correlation was obtained between borderline personality features and social anxiety disorder symptoms (SPAI-23). For instance, Gutz et al. (2016) have shown that individuals with BPD and SAD symptoms specifically show a higher increase in self-focused negative emotions and propensity toward avoidance.
Burghart et al. (2023) conducted a comprehensive analysis of the latent structure of the Emotion Regulation Questionnaire (ERQ) for adults, encompassing a diverse sample of 11,288 individuals from 29 countries. Their findings suggest that emotion regulation strategies may not converge consistently across cultural contexts. This observation is particularly significant given that impaired emotion regulation is considered a fundamental characteristic of BPD, as outlined in the Diagnostic and Statistical Manual of Mental Disorders (DSM-5-TR; APA, 2022). The implications of these findings underscore the critical importance of rigorously assessing and evaluating the psychometric properties of BPD scales across diverse cross-cultural settings. In an increasingly multicultural global landscape, psychological inventories demonstrating measurement invariance across various groups are paramount, as they provide evidence of a measure’s consistency and reliability.
Given observed measurement invariance across the factors for key demographic and contextual groups, namely sex assigned at birth, nativity (born in Norway), primary language spoken at home, and treatment condition, this supports the methodological robustness and cross-group applicability of the Norwegian version of the scale, reinforcing its value for comparative assessments in diverse populations. However, while these findings affirm the scale’s structural validity across groups, a deeper examination of the stability of these factors over time is warranted. The observed longitudinal variance suggests that the factor structure may not remain entirely consistent across different time points. This fluctuation could be attributed to two primary influences: the developmental nature of adolescence, a period characterized by rapid emotional, cognitive, and social changes, and the potential effects of clinical interventions, which may alter the way symptoms manifest or are reported over time. While reliable for cross-sectional comparisons among different groups, caution is warranted when interpreting changes over time. Future research should aim to clarify whether the observed longitudinal differences reflect true changes in borderline personality features or shifts in the measurement properties of the scale.
Limitations and Future Directions
This study has both strengths and weaknesses. It did not include a clinical interview to examine the diagnostic validity of the BPFSC-11, and another self-report inventory also intended to examine borderline features. As with all self-report instruments, there is a risk that social desirability bias may influence participants’ responses. Adolescents may underreport symptoms due to stigma or a desire to conform to perceived social norms. This potential bias could affect the accuracy of symptom reporting and, consequently, the scale’s psychometric properties. Moreover, cultural factors may have influenced the interpretation of certain items. Cultural differences in understanding or accepting risk-taking behaviors across various cultural settings might exist. Such nuances underscore the importance of cultural context in developing, translating, and adapting psychological measures. Moreover, while we followed established guidelines for the translation and cross-cultural adaptation of the BPFSC-11, including forward and back translation, expert review, and consultation with adolescents, some limitations remain. Despite these efforts, there is a possibility that specific cultural nuances or idiomatic expressions relevant to Norwegian adolescents may not have been fully captured. Furthermore, while back-translation and approval by the original developer help ensure fidelity to the source content, subtle differences in how symptoms are expressed or understood across cultures may impact the scale’s cultural validity. Future studies should examine the scale’s measurement invariance and cultural appropriateness in diverse Norwegian populations. Future research should incorporate qualitative approaches, such as cognitive interviewing, to further explore how Norwegian adolescents interpret specific items and to refine culturally sensitive content. Nonetheless, examining a sample of more than 200 using an 11-item inventory is sufficient (Field, 2013). However, a larger sample and a more balanced female-to-male ratio would have been preferable, specifically when assessing measurement invariance across various groups and genders. Conducting a CFA one year later with a sample from the same population strengthens the theoretical concept of the BPFSC-11 and confirms the model revealed by the EFA. Additionally, comparing well-recognized and psychometrically sound inventories increases confidence in the results, similar to previous works (Diotaiuti, et al., 2020, 2021). The statistical property of the measurement invariance indicates that the same underlying construct is being measured across groups and time.
This study makes an innovative contribution by providing the first validated Norwegian version of the BPFSC-11, expanding the availability of Evidence-Based assessment tools for borderline personality features in Norwegian adolescents. The scale’s strong psychometric properties support its use in both clinical and research settings, facilitating early identification and intervention for borderline personality pathology in Scandinavian youth. Future research should focus on several key areas. Larger longitudinal studies are needed to evaluate the predictive validity and sensitivity to change of the BPFSC-11, especially in clinical populations. Additionally, further exploration of the scale’s discriminant validity in relation to other personality disorders is essential, which may include comparisons with structured clinical interviews or other dimensional measures. Finally, cross-cultural validation efforts in diverse Norwegian subpopulations would enhance the scale’s generalizability across different cultural and demographic groups.
Footnotes
Acknowledgements
We thank all the participants in this study, Vestfold County, for their cooperation and support throughout the study process, and Kyrre Svarva for his support throughout the completion of this research.
Author Contributions
Tore Aune and Sigrid Flatås Aune contributed throughout the manuscript’s production phases. Roselyn Peterson conducted the measurement invariance testing and contributed to the manuscript’s writing. All three authors have read and approved the submitted manuscript.
Declaration of Conflicting Interests
The author(s) declared no potential conflicts of interest with respect to the research, authorship, and/or publication of this article.
Funding
The author(s) received no financial support for the research, authorship, and/or publication of this article.
Ethical Considerations
This research was performed using the World Medical Association’s code of ethics (Declaration of Helsinki) for experiments involving humans. It was approved by the Norwegian Regional Committee for Medical and Health Research Ethics (2017/1938). The Norwegian Centre for Research Data (#53960) also approved the study’s conduct.
Informed Consent
Written informed consent regarding participation and publishing was obtained after a complete study description was provided to the participants and their parents.
Data Availability Statement
The data is available upon request from the editor, reviewers, or others in the editor’s office.