
Abstract
This paper describes the types of social comparison used by Hispanic students at a Hispanic Majority Institution through two studies (N = 406). We found that students engaged in upward identification more often than downward identification, downward contrast, and upward contrast. However, when comparing themselves on an academic measure, downward identification and upward contrast became relatively more frequent. Additionally, downward identification tended to predict higher self-reported confidence about academic abilities than other types of social comparison.
Introduction
People naturally compare themselves to others, and this process can support or deter their goal attainment. For example, social comparison (Festinger, 1954) may affect college students’ anxiety (McCarthy & Morina, 2020), academic self-concept (Bong & Skaalvik, 2003; Wang, 2020), academic performance (Hermann et al., 2016), and career aspirations (Rudman & Phelan, 2010). When it comes to social comparison, it is important to not only think about the person making the comparison but also the available targets for comparison (Norton, 2013; Zell & Alicke, 2010). Therefore, it is critical to examine the process and outcomes of how Hispanic students compare themselves to other students when they are in an environment in which their targets are likely to be other Hispanic students as opposed to White students.
Social Comparison
Social comparison primarily involves the inclination to compare oneself to relevant peers (Festinger, 1954). When making comparisons, people can compare themselves to targets who are better off (upward comparisons) or worse off (downward comparisons). Additionally, people can focus on differences between the target and themselves (contrast comparison) or on similarities between the target and themselves (identification comparison; also known as assimilation). Thus, people may follow one of four strategies (i.e., a two-by-two arrangement): upward identification, upward contrast, downward identification, and downward contrast (Buunk et al., 2005; Dijkstra et al., 2008; Smith, 2000).
Meta-analyses have demonstrated that upward comparisons are more common than downward comparisons, and contrast comparisons are more common than identification comparisons (Gerber et al., 2018; Zell et al., 2020). However, contrast is likely to occur when the target is extreme and belongs to an out-group, whereas identification occurs when the target is moderate and belongs to an in-group (Mussweiler et al., 2004; Mussweiler & Rüter, 2003). Yet, these general trends may not apply to minority students. For example, some evidence suggests that minorities have the propensity to assimilate with in-group members (i.e., use identification strategies), even when the target is a downward target (Blanton et al., 2000; Brewer & Weber, 1994). Although downward identification has been addressed in segmented identification theory among minority children of immigrants (Portes & Zhou, 1993) and Hispanic youth (Altschul et al., 2008), social comparison processes for Hispanic students, particularly in academic environments where they are well represented, remains an important pursuit for research.
People typically compare themselves to others who are most accessible in their immediate social environment (Norton, 2013; Zell & Alicke, 2010). The implication of this context-dependent aspect of social comparison is that traditional examinations of social comparison processes, which typically focus on Hispanic students at historically White schools, views Hispanic students as part of the minority and outgroup. Thus, when Hispanic students look for targets for social comparison at these institutions, their targets are likely to be members of an outgroup. However, when Hispanic students at Hispanic Majority Institutions (HMIs; where Hispanic students make up more than 50% of the student population) look for targets for social comparison, their most readily accessible targets are likely to be ingroup members. This student population composition creates interesting dynamics for Hispanic students. For example, evidence suggests that Hispanic students have worse outcomes at schools where there is a prominent Hispanic population, including lower academic self-concept (Cuellar, 2014), more stress (Huynh et al., 2023), and lower attainment of STEM degrees than Hispanic students at White-majority schools (Herrera, 2020). However, some evidence suggests that increasing representation of Latino/a students does not affect graduation rates overall (Garcia, 2013). The mixed evidence suggests that there is an urgent need to describe and understand social comparison processes for Hispanic students at HMIs.
The term Hispanic Majority Institution (HMI) is intentional to differentiate it from the more commonly used term of Hispanic Serving Institution (e.g., Garcia, 2016; Santiago, 2006, 2016) because HMIs are a special subset of Hispanic Serving Institutions (HSIs). To be classified as an HSI, institutions must have “an enrollment of undergraduate full-time equivalent students that is at least 25% Hispanic students” (https://ed.gov). However, at HMIs, Hispanic students make up more than 50% of the total student population. Our study is specifically concerned with this subset because the common available targets of comparison for Hispanic students are other Hispanic students. This is not the case for all HSIs. For example, a Hispanic student attending an HSI with a 30% Hispanic student population is in the minority, whereas a Hispanic student attending an HMI is in the majority on campus. This membership in the majority group is at the crux of our investigation because we believe membership in the majority group affects social comparison processes for Hispanic students. Therefore, it is critical that we distinguish these institutions from HSIs by labeling them as HMIs. We think that this approach is complementary to the rich body of evidence that exists on HSIs (e.g., Garcia, 2019; Santiago, 2012). We believe that by separating HMIs from HSIs generally, researchers can explore the contours of HSIs more carefully and appreciate inter-institution differences under the broad umbrella of HSIs.
Social comparison leads to countless consequences for students including self-evaluation and self-esteem (Blanton et al., 2000; Brewer & Weber, 1994; Vogel et al., 2020), anxiety (McCarthy & Morina, 2020), and academic self-concept, particularly confidence in their academic abilities (Niepel et al., 2019; Reynolds, 1988; Wang, 2020; Wolff et al., 2018). For example, students who engaged in upward social comparison were more likely to report lower confidence in skills related to numeracy and speaking (Pulford et al., 2018), but, later on, may increase in confidence as upward comparisons allow students to gain confidence when their skills begin to match up with respected others (Sander & Sanders, 2006). Therefore, in addition to documenting social comparison processes for Hispanic Students at HMIs, it is also important to explore potential consequences that can arise from these processes. As such, in this paper, we summarize two studies that attempt to describe current social comparison processes and explore confidence in academic abilities as an outcome from these processes for Hispanic students at an HMI.
Summary of Goals
The primary goal of this paper was to describe social comparison processes of Hispanic students attending a Hispanic Majority Institution. The secondary goal of this paper was to explore how social comparison processes may predict students’ confidence in their academic ability. In Study 1, we summarized data from a volunteer sample of undergraduate students enrolled in psychology courses to describe patterns of social comparison. Additionally, we explored confidence in academic abilities as a potential consequence of social comparison. In Study 2, we used data from the general student population of an HMI to confirm patterns of social comparison established in Study 1. Moreover, we expanded the scope of investigation into outcomes of social comparison by examining students’ confidence and self-doubt as part of their academic self-concept. As such, the purpose of Study 2 was to replicate the initial findings from Study 1 with a more representative sample (i.e., we recruited from the whole student population instead of just from psychology students). Additionally, Study 2 examined additional outcomes related to social comparison that we did not consider in Study 1.
Study 1
Participants
Participants were undergraduate students at a regional comprehensive university in Texas. A total of 289 people attempted the study; 2 were excluded because their responses were largely blank. Out of the remaining participants, 163 self-identified as Hispanic/Latino singularly. Additionally, 52 self-identified as Hispanic/Latino in combination with White/Caucasian (39), Black/African American (9), Asian/Pacific Islander (2), American Indian/Native American (2). Thus, the final sample comprised of 215 participants, who self-identified as Hispanic/Latino singularly or Hispanic/Latino and one other race/ethnicity. The average age of these participants was 22.75 (SD = 6, range 18–57), and 86% self-identified as female, 13.5% as male, and .50% chose not to say. The majority of the students were psychology majors (64%), followed by biology and criminology (8% each). Of these participants, 72% self-identified as a first-generation college student, defined as neither parent having completed at least a bachelor’s degree.
In addition to participants’ information, it may be important to note characteristics about the university and its student population. The institution is a public regional university in South Central Texas. Initially founded in 2009 to serve upper-class, community college transfer students, it accepted first-year (freshmen) students starting in 2017. Today, the university serves approximately 7300 students, 77% of whom are Hispanic, 65.7% are female, and 73% are the first in their family to attend college (https://tamusa.edu). Additionally, more than 75% of all students qualify for financial aid.
Measures
Social Comparison
We employed comparative ratings to assess the types of social comparison students use. We asked participants to compare themselves to the typical student on campus using different variations of the same question format. In the first question, we asked participants to compare themselves to their classmates at their university generally (with no other information provided). Next, we asked participants to compare themselves to the student body at their university by providing them the following information: “71% are first-generation college students; 73% identify as Hispanic; 86% receive financial aid; and the average high school GPA is 3.4.” Then, in the next four questions, we listed each of the individual criterion separately, followed by the same prompt. For example, “At Texas A&M University - San Antonio, 71% of students are first-generation college students. Select the item that best describes how you see yourself in comparison to the student body.”
For all questions, participants were asked to select one of four statements that best describe how they see themselves relative to the student body. The choices were: (A) “Generally speaking, they are better off than me, but I am similar to them in important ways.” [Upward Identification]; (B) “Generally speaking, they are worse off than me, but I am similar to them in important ways.” [Downward Identification]; (C) Generally speaking, they are better off than me, but I am different from them in important ways.” [Upward Contrast]; (D) “Generally speaking, they are worse off than me, but I am different from them in important ways.” [Downward Contrast].
Confidence in Academic Ability
To provide an initial exploration of students’ confidence in their academic abilities, we used a single-item measure: “How likely do you think you are to achieve your academic goals?” Participants used a horizontal sliding scale, with anchors at 0% sure on the left side, 50% sure in the middle, and 100% sure on the far right. The mean response to this item was 85.02, (SD = 14.92).
Design and Procedures
This survey-based study was conducted entirely online using Qualtrics. Participants were recruited via SONA, an online research management system for students. Students sign up for a SONA account via their university affiliation and enrollment in a psychology course, which allows them to participate in studies posted by psychology researchers. Students earn course credit/extra credit for participating. Students earned .5 credit (equivalent to 30 minutes) for completing this study.
Participants clicked on a link that led them to the study. Following consent procedures, participants provided responses to social comparison questions, followed by questions about future expectations for success, and then demographic questions. As all questions were optional, participants could elect to skip questions as they chose. After that, participants read a debriefing statement thanking them for their participation. All study materials and procedures were approved by the Institutional Review Board (IRB) at Texas A&M University - San Antonio.
Results
Social Comparison Rates
Category by Social Comparison Group.
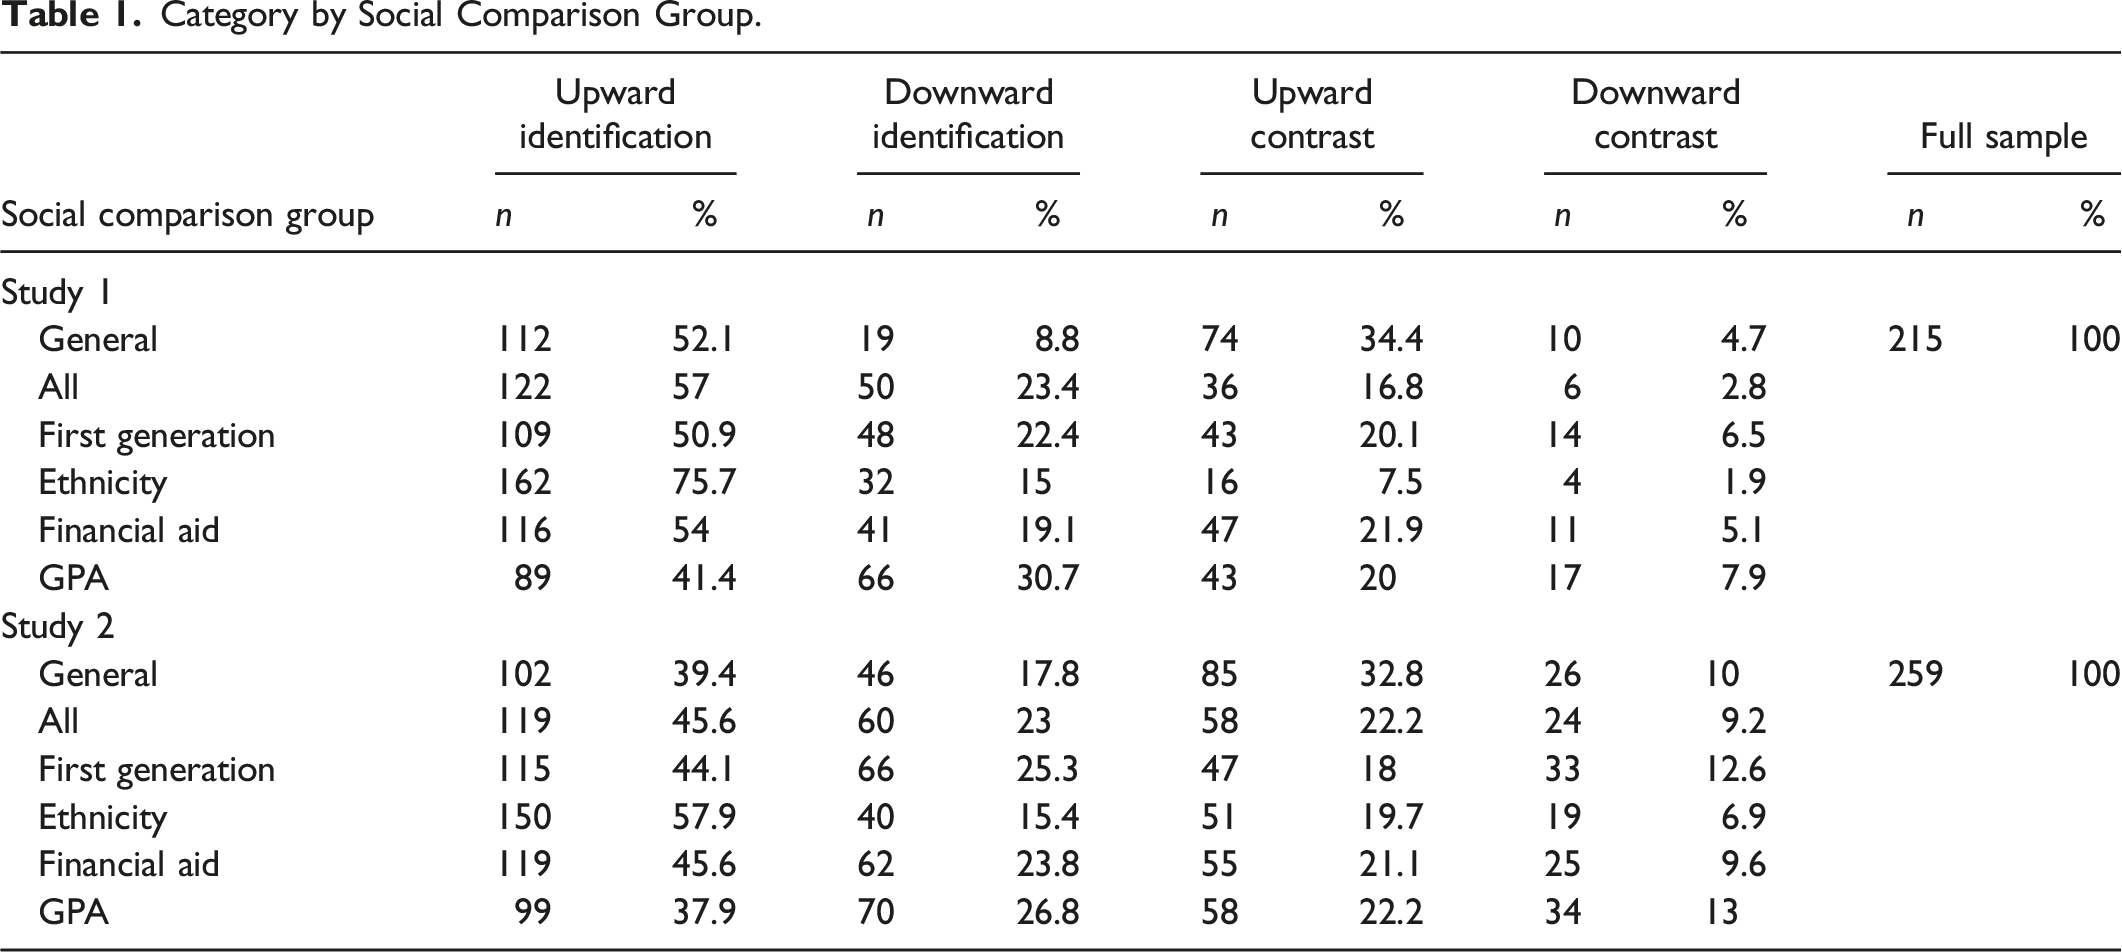
Generally, participants tended to make upward comparisons (61.4%–86.5%) more frequently than downward comparisons (13.5%–38.6%). Participants also tended to make identification comparisons (60.9%–90.7%) more frequently than contrast comparisons (9.4%–39.1%). Upward identification was the most frequently selected choice of social comparison for all questions, whereas downward contrast was the least frequently selected choice for all questions. Downward identification was the second most frequently selected option for all questions (except for the financial aid question, in which upward contrast was the second most frequently selected option).
Responses to the question regarding GPA stood out the most because the selections were most evenly distributed. In fact, it was the only question in which upward identification did not reach 50%. Thus, we focused on responses to this question to explore confidence in academic ability as a potential outcome of social comparisons based on GPA.
Confidence in Academic Ability
We used a one-way ANOVA to examine potential differences in confidence in academic ability based on social comparison regarding GPA and conducted additional Tukey HSD post hoc tests to identify specific differences between groups.
We found that confidence in academic ability differed based on social comparison group, F (3, 204) = 5.80, p = .001, ƞ2 = .08. Post hoc tests showed that participants who selected downward identification (M = 89.32, SD = 7.93) reported higher confidence in their academic abilities than upward contrast, (M = 77.62, SD = 18.66), p < .001, 95% CI [-17.37, −6.03]. Upward identification (M = 84.90, SD = 15.32) and downward contrast (M = 88.06, SD = 16.48) were also higher than upward contrast, p = .008, 95% CI [-12.63, −1.92]; p = .013, 95% CI [-18.62, −2.26], respectively. See Figure 1. Mean response to “How likely do you think you are to achieve your academic goals?” from 0% to 100% as a function of social comparison group. Error bars represent 95% confidence intervals.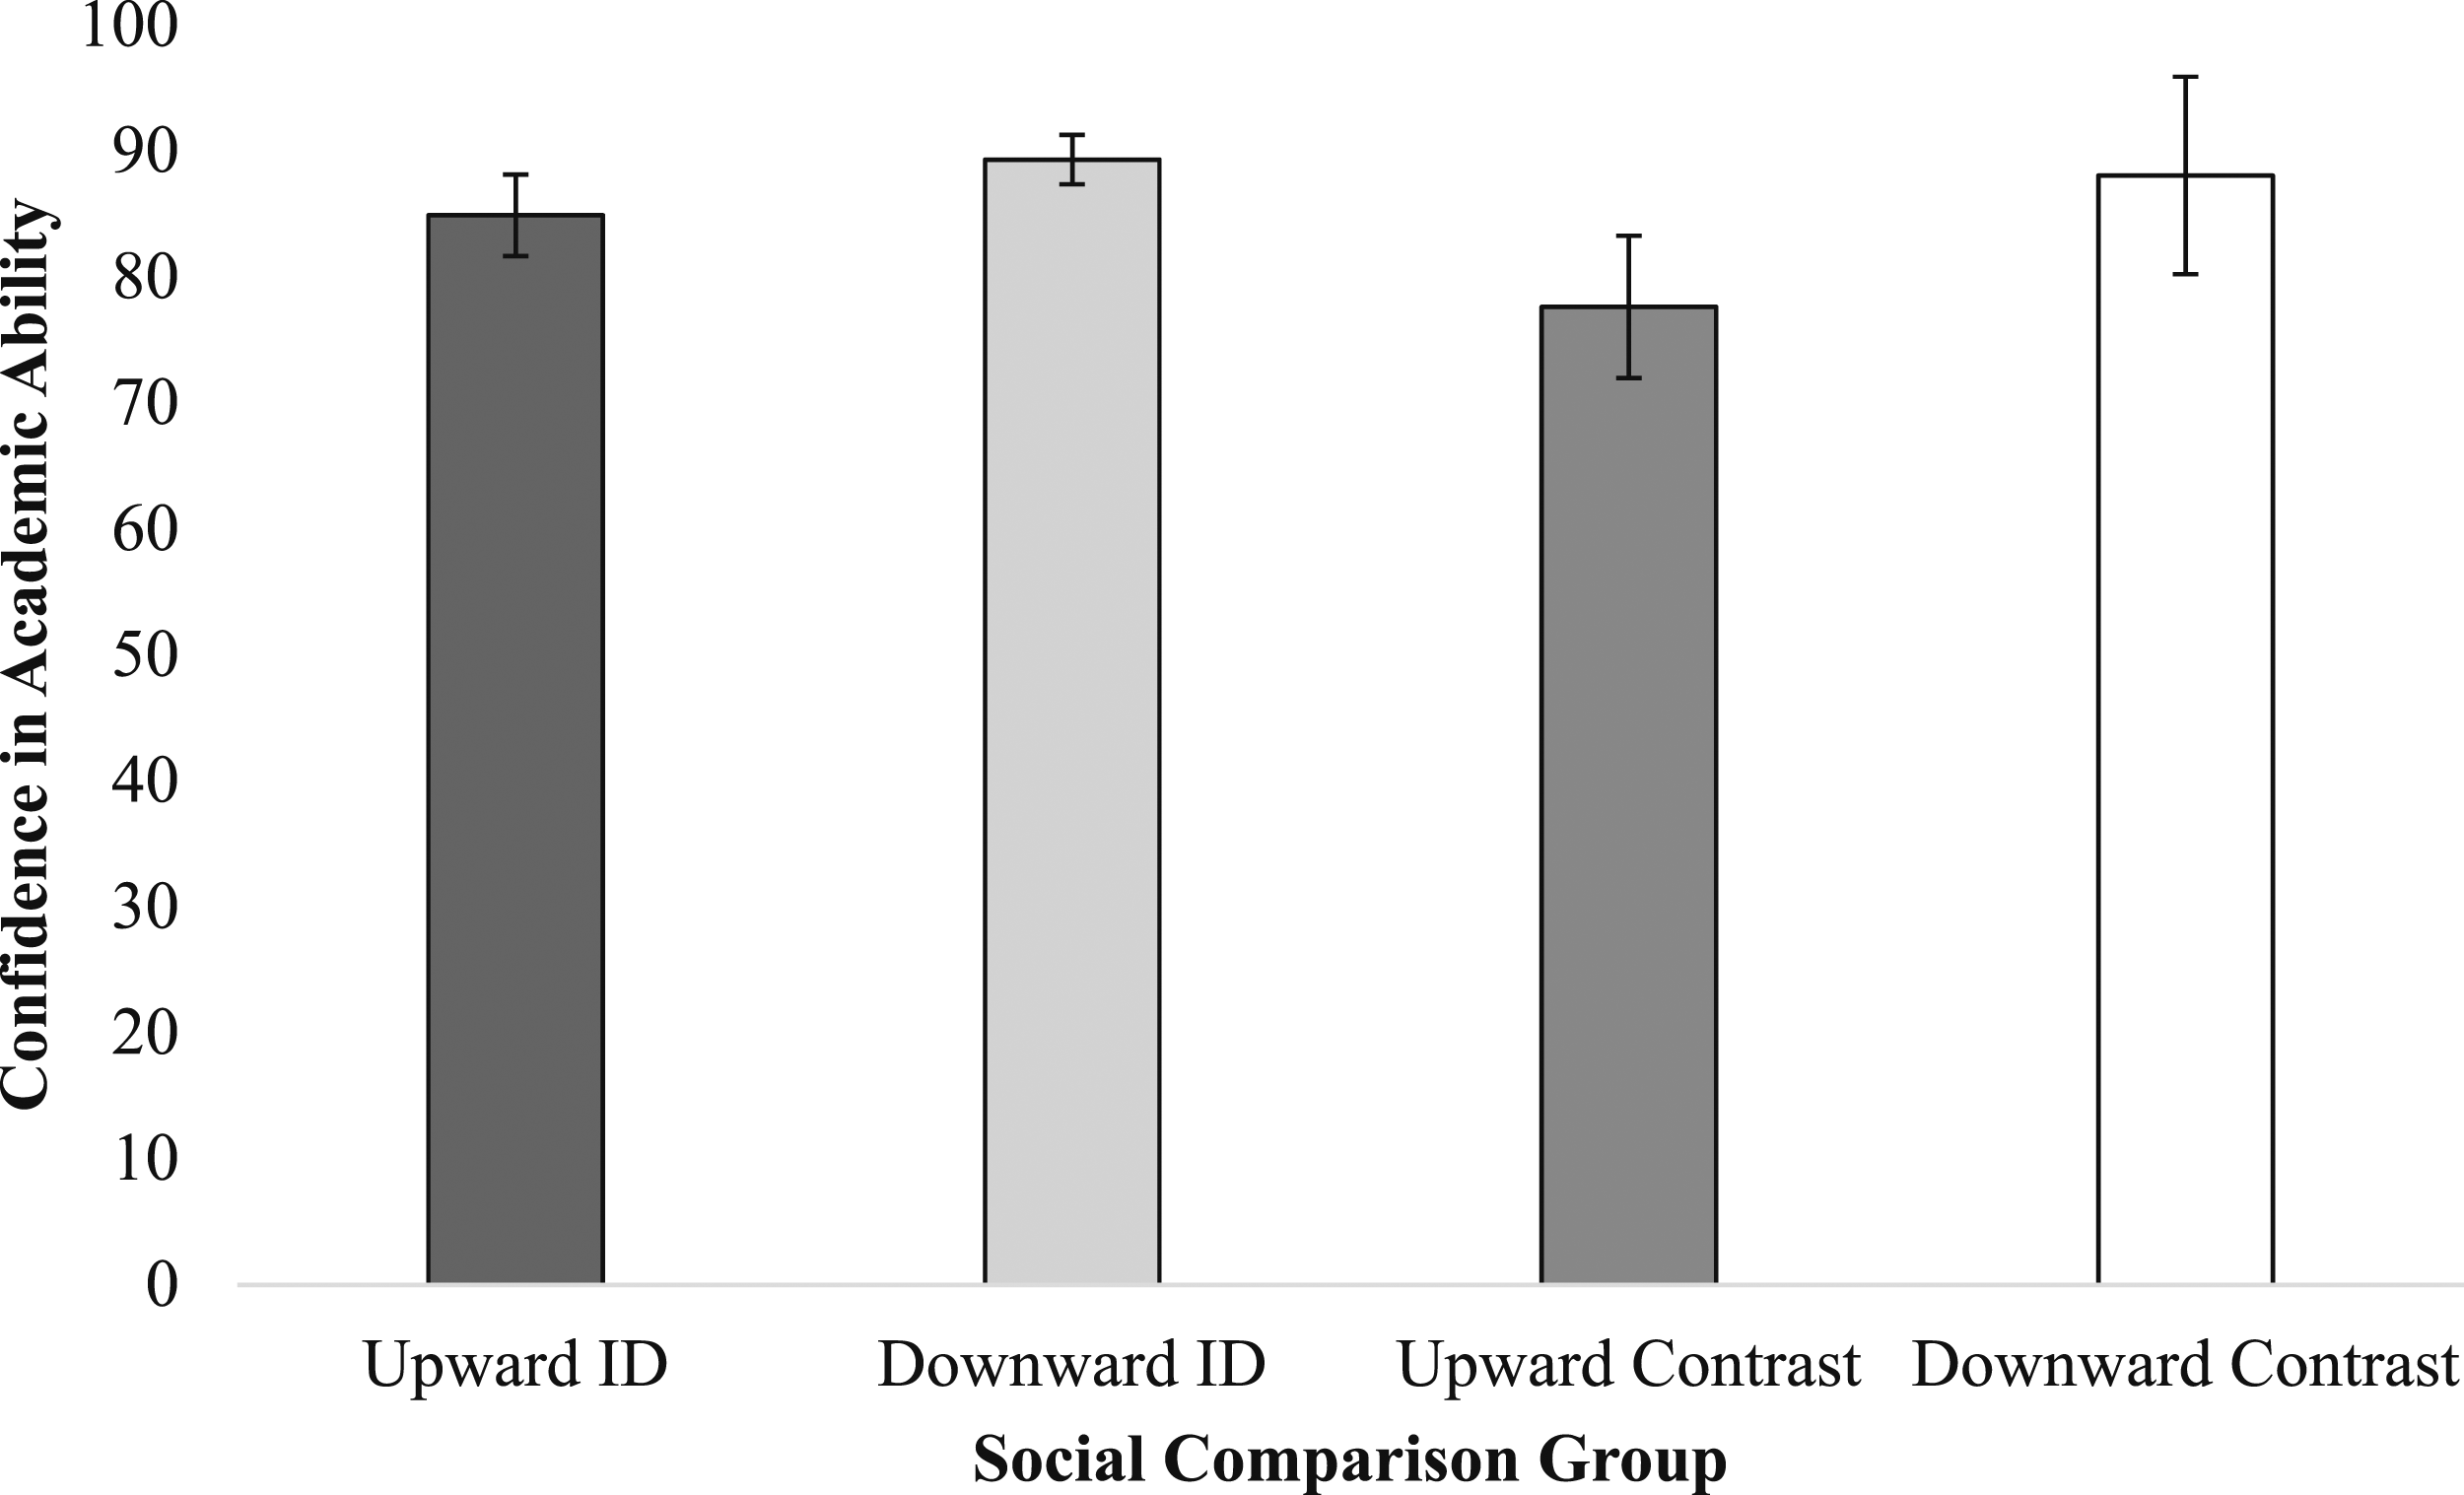
Study 2
In Study 1, we explored social comparison patterns for Hispanic students at an HMI and explored confidence in academic ability as a potential outcome resulting from different types of social comparison. However, participants were recruited through their enrollment in psychology courses, which limits the study’s generalizability.
In Study 2, we attempted to confirm the patterns of social comparison from Study 1; that is, we attempted to replicate findings from Study 1 with a more representative sample. Moreover, we expanded our investigation into Study 1’s findings about differences in students’ confidence about their future academic success. In particular, in Study 1, we used a single-item measure to assess students’ confidence about their academic success. In Study 2, we used the academic self-confidence and self-doubt subscales of the academic self-concept scale (Reynolds, 1988) to examine whether Study 1’s findings reflect a simple assessment of academic abilities or whether this outcome may be reflected in something more pervasive (i.e., their academic self-concept). In short, we extended the scope of investigation in Study 2 by employing validated measures and more concisely defined psychological outcomes related to social comparison.
Participants
Participants were recruited from the entire student population at the university described in Study 1. A recruitment email was sent out to all students via their university email address. A total of 405 participants opened the survey link, 32 did not go past the consent page, 102 answered some questions but failed to complete at least 67% (2/3) of the survey, which left us with 261 complete responses. The excluded participants did not provide enough information for us to be able to determine whether they were different from participants who completed the study. Of the complete responses, 191 self-identified as Hispanic/Latino (138 as Hispanic/Latino singularly, 41 as Hispanic and White/Caucasian, and 12 as Hispanic/Latino and Black/Asian/Native American). Similar to Study 1, our analysis involved only these 191 responses. Of these participants, 37 self-identified as male, 145 as female, 7 as non-binary/third gender, and 2 selected “prefer not to say.” The average age was 26.32 (SD = 9.37; range = 18–65). The most popular majors in the sample were Psychology (47), Business/Marketing (23), Biology (23), Education (17) and Criminology (14).
Measures
Social Comparison
We used the same measure for social comparison as the one described in Study 1.
Confidence in Academic Ability
We used two subscales of the academic self-concept scale (Reynolds, 1988) to assess confidence in academic ability. Participants rated their agreement with scale items using a 5-point Likert scale (1 = strongly disagree, 5 = strongly agree). The self-confidence subscale has three items (i.e., “Most courses are very easy for me.”; “Most exams are easy for me.”; “Most of the time while taking a test I feel confident.”). Higher scores indicate more self-confidence. This subscale had acceptable reliability, α = .68. The self-doubt subscale has eight items (e.g., “I sometimes feel like dropping out of school.”; “I feel that I do not have the necessary abilities for certain courses in my major.”; “I have doubts that I will do well in my major.”). Higher scores indicate more self-doubt. This subscale had good reliability, α = .88.
Design and Procedures
The study design and procedures were similar to Study 1. However, in this study, participants were recruited from the entire university. We acquired students’ email addresses through our institutional research office via a request for public information. We sent a recruitment email to those addresses directly from our university email account. Following the completion of the survey, participants had the opportunity to enter a drawing for one of eighteen $50 gift cards. Participants clicked on a link that led them to a separate survey in order for them to enter their email information to be used for the drawing. This step made it so that we could not connect their email address to their responses. All study materials and procedures were approved by Institutional Review Board (IRB) at Texas A&M University-San Antonio (2024).
Results
Social Comparison Rates
See Table 1 for a breakdown of frequencies and percentages of social comparison by question (i.e., criterion presented). Generally, participants tended to make upward comparisons more frequently (60.1%–77.6%) than downward comparisons (39.8%–22.3%). Participants also tended to make identification comparisons (57.2%–73.3%) more frequently than contrast comparisons (31.14%–26.6%).
However, the breakdown of identification and contrast fluctuated depending on the question. Across all questions, upward identification was the most frequently selected option of social comparison, whereas downward contrast was the least frequently selected option. Downward identification and upward contrast traded off being second and third in frequency. Downward identification was the second most frequently selected option for all criteria presented at once, first-generation college student status, financial aid, and GPA; whereas, upward contrast was second most frequently selected option for general (no criteria presented) and ethnicity.
Confidence in Academic Ability
Similar to Study 1, we used one-way ANOVAs to examine potential differences in confidence in academic ability based on social comparison of GPA and conducted additional Tukey HSD post hoc tests to identify specific differences between groups. We found that self-confidence differed based on the type of social comparison made, F (3,189) = 3.22, p = .02, ƞ2 = .05. Based on the post hoc analyses, we found that participants who selected downward identification (M = 3.20, SD = 0.84) reported higher self-confidence than those who selected upward identification (M = 2.78, SD = 0.80), p = .045, 95% CI [.001, .83]. This was the only significant difference in the pairwise comparisons. See Figure 2. Mean self-confidence as a function of social comparison group. Higher scores indicate more self-confidence. Error bars represent 95% confidence intervals.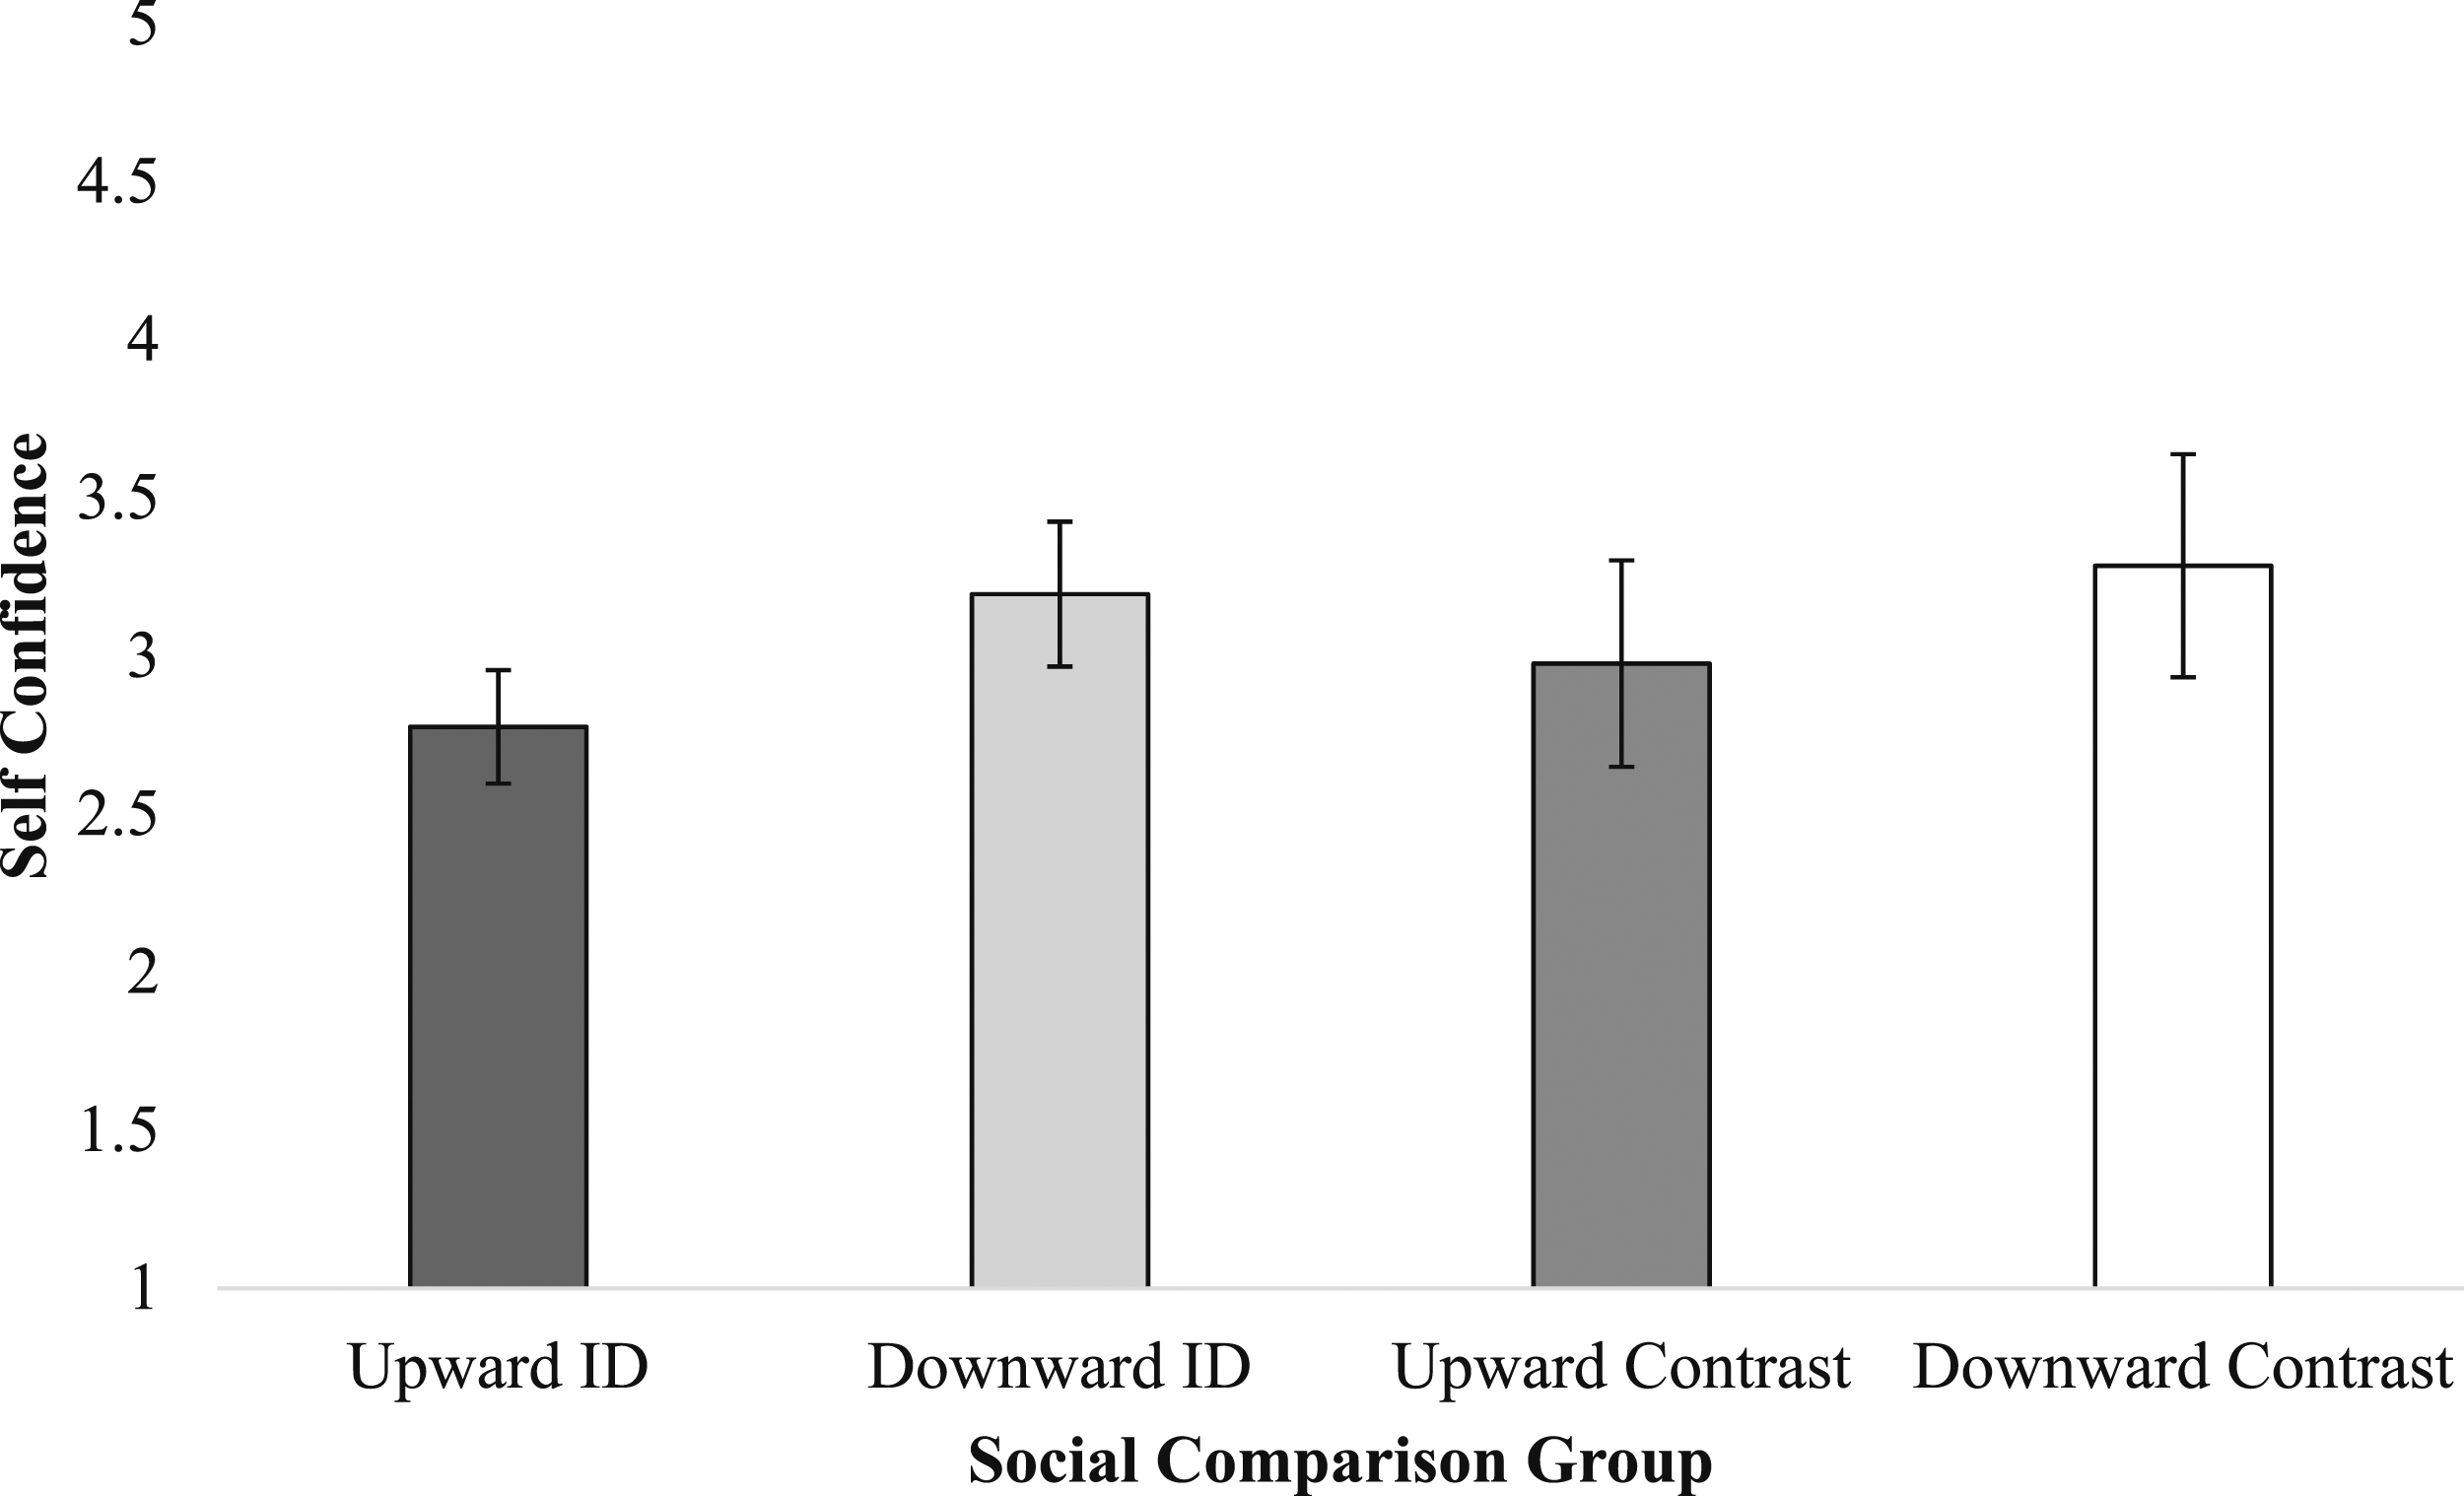
We also found that self-doubt differed based on the type of social comparison made, F (3,189) = 3.02, p = .03, ƞ2 = .05. Based on the post hoc analyses, we found that participants who selected downward identification reported lower self-doubt (M = 2.54, SD = 0.92) than those who selected upward contrast (M = 3.16, SD = 1.13), p = .029, 95% CI [.04, 1.19]. This was the only significant difference in the pairwise comparisons based on self-doubt. See Figure 3. Mean self-doubt as a function of social comparison group. Higher scores indicate more self-doubt. Error bars represent 95% confidence intervals.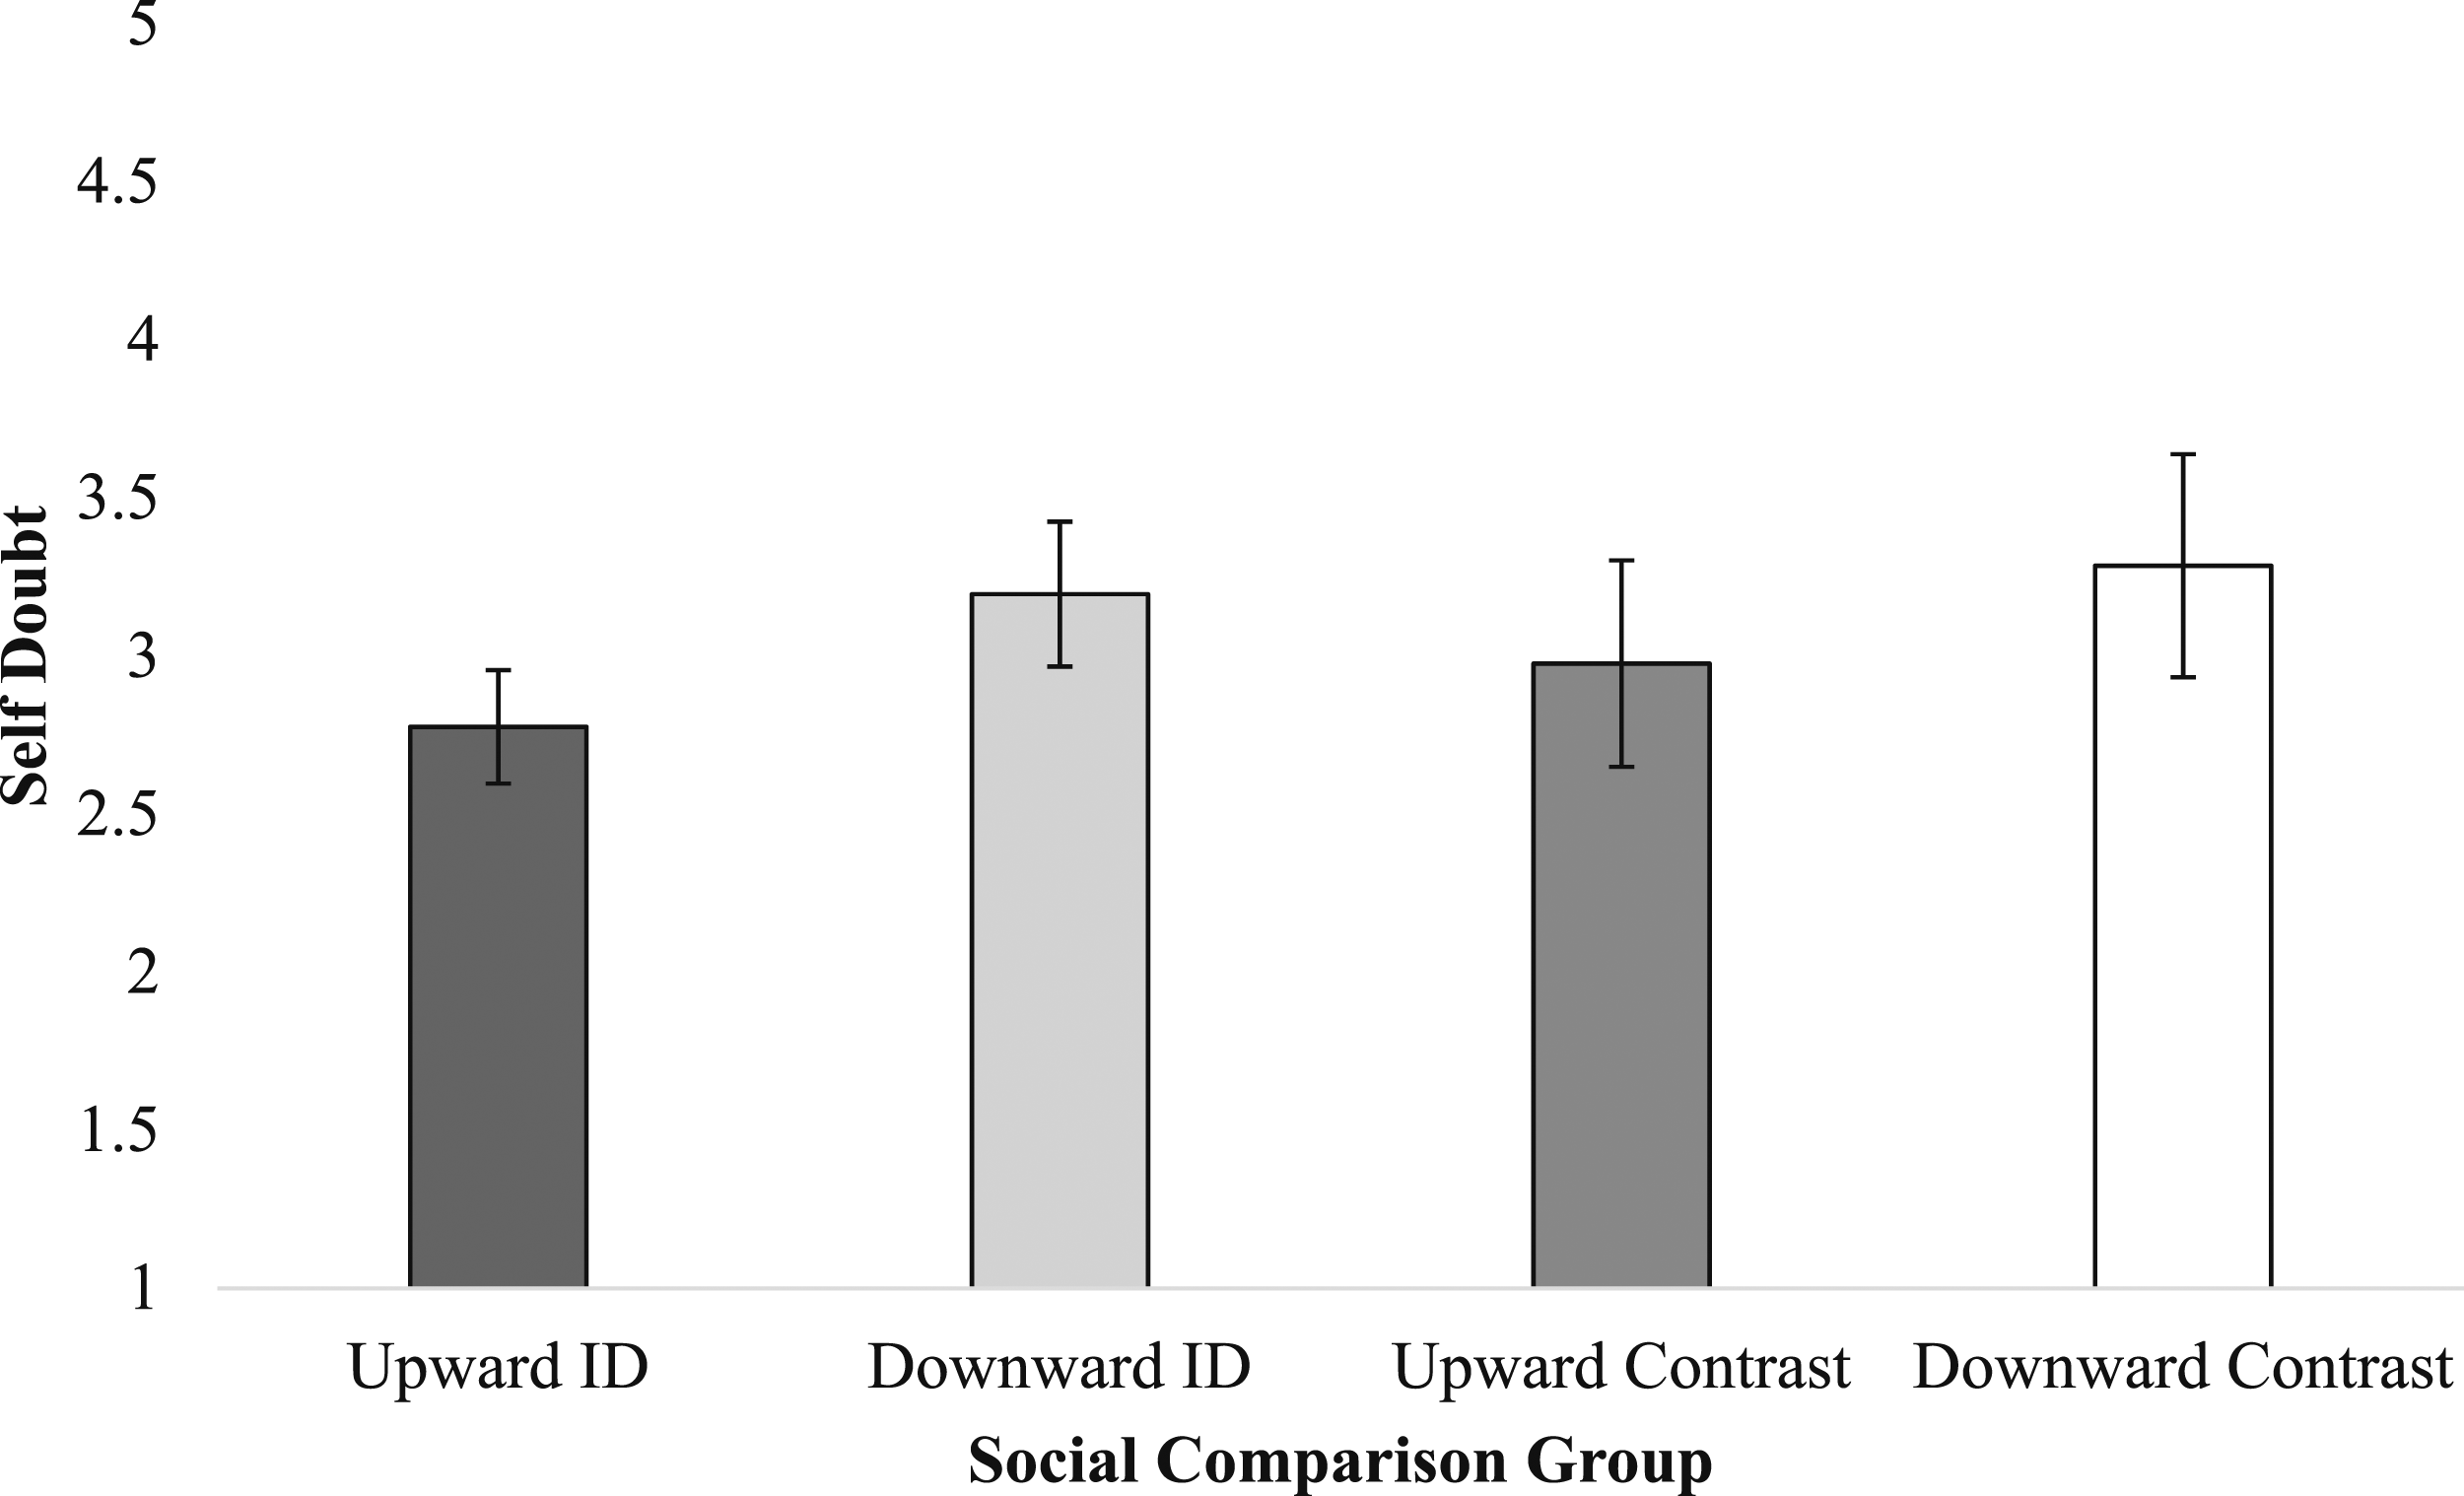
General Discussion
Through two studies, we examined social comparison processes for Hispanic Students attending an HMI. These studies make a novel contribution to the literature by being the first studies of social comparison to focus on Hispanic students on college campuses where they belong to the majority. These studies are critical because they break convention of previous research on social comparison, where Hispanic students are expected to be in the minority. As such, these findings provide greater nuance for the understanding of Hispanic college students’ experiences and may be leveraged to support Hispanic college students across the full spectrum of higher education institutions.
Looking first at how students chose to compare themselves to other students at the university produced some patterns consistent with previous research. For both Study 1 and Study 2, more students engaged in upward comparisons than downward comparison, which is consistent with previous meta-analyses (e.g., Gerber et al., 2018). Additionally, more students indicated that they identified with their peers as opposed to indicating contrast with peers. Given the large percentages of first-generation college students (71%), Hispanic students (73%), and students receiving financial aid (86%) at this particular university, it makes sense that the majority of students reported identifying with their peers on these characteristics. For Hispanic students at White Majority Institutions or those with higher socioeconomic status (SES) students, these results would have likely been quite different (e.g., higher levels of contrast would have been present).
Although not the primary focus of this study, an interesting shift in responses occurred from the first question that asked how students compare themselves without providing any descriptive statistics to the second question that provided the percentages for each demographic. Without specific information, more students (39%–43%) indicated that they contrasted with their peers; however, with descriptive statistics provided, levels of contrast were lower (20%–31%). In previous research (e.g., Broda et al., 2018), female students tended to compare themselves to upward targets if there were high achieving female students; however, if no other female students were high-achieving, the female students in the study compared themselves downward to lower achieving female students. This is similar to Dijkstra et al. (2008) who reported that people generally compare themselves to upward targets but do so more often with those who resemble themselves. While more research is necessary to explore why the present findings might be the case, Hispanic students’ general perception of themselves as different than the overall student population may be cause for concern if this is connected to a lower sense of belonging and/or academic outcomes. The shift from contrast to identification when presented with specific statistics could perhaps be due to students being reminded of the unique demographic composition of this particular university, and, thus, suggesting that even when considering their own university, students may benefit from a reminder of their classmates’ backgrounds to feel a sense of identification with others around them, such as been found with research involving similarity priming (Gerber et al., 2018).
When providing participants with the demographic statistics sequentially, an interesting pattern emerged when students compared themselves on an academic measure (i.e., GPA). When thinking about their academic performance, the distribution of responses shifted compared to responses for other criteria (i.e., ethnicity, financial aid, first-generation college student status). The percentage of students reporting upward identification regarding GPA was less than for other questions, and, instead, the percentages of students reporting upward contrast and downward identification increased to be much more prominent responses. Previous research suggests some positive and some negative outcomes that result from upward and downward comparisons. Students generally engage in upward comparisons (Gerber et al., 2018) and this is thought to provide them with motivation to perform at a higher level (Collins, 1996); however, in some circumstances such as when a person feels they do not have the ability to perform better or the situation is beyond their control, upward comparisons can result in less motivation (Gibbons et al., 2000). In contrast, downward comparisons provide an ego boost and increase self-esteem (Blanton et al., 2000). At first glance, these downward comparisons may seem beneficial because self-esteem is generally a positive thing; however, when students compare themselves to downward targets, they may lower their goals and motivation to succeed (Gibbons et al., 2000). Combined with a potentially unrealistic sense of ability, the lowering of goals that results from downward comparisons may ultimately decrease academic performance (Gibbons et al., 2000).
Given that the focus of education centers primarily on academic performance, we felt this shift in responses warranted further attention. Thus, we explored how confidence in academic ability differed across participants who reported different types of social comparison. For Study 1, participants who engaged in downward comparisons reported higher confidence in their academic ability than those engaged in upward comparisons, which is consistent with the research on downward comparisons improving self-esteem and boosting the ego (Gibbons et al., 2000). One issue of concern is that 20% of students engage in upward contrast comparisons. These students, who see themselves as worse off and different than their peers, reported the lowest level of confidence in their academic ability. This self-perception may indicate that they do not see themselves capable of performing at a higher level (Gibbons et al., 2000).
A second issue of concern is that 30% of participants engaged in downward identification. Although the downward comparison may boost the ego temporarily, this comparison could lead to students lowering their academic goals and settling for performance levels below their capabilities, essentially selling themselves short (Gibbons et al., 2000). Study 2 found similar patterns when examining differences in academic self-confidence and academic self-doubt across different types of social comparison. Participants who engaged in downward identification had higher self-confidence than those who engaged in upward identification and less self-doubt than those who engaged in upward contrast. Thus, these results from Study 2 demonstrate some benefits from engaging in downward identification in the form of higher self-confidence and lower self-doubt compared to upward comparisons. However, we caution against this approach because prior research demonstrates that, although upward identification can lower self-esteem, it can also provide examples for improvement (Dijkstra et al. (2008). Additionally, over-confidence in abilities may reduce motivation, but high levels of doubt could also reduce motivation. In some research, academic self-confidence may predict retention for Hispanic students (Núñez, 2009), although this may not be as predictive for students at HMIs. In all likelihood, there is an ideal level of academic self-concept that is both motivating while still preserving a student’s sense of self-efficacy. Additionally, other factors such as students’ experiences with negative stereotypes and extracurricular experiences are predictors of their self-confidence (Núñez, 2009). Ultimately, it is critical to evaluate the goals of social comparison and balance the need for temporary, self-enhancement/protective outcomes versus long-term, self-improvement outcomes. Therefore, future research should continue to examine how social comparison, academic self-concept, self-confidence, and self-doubt influence long-term academic and career outcomes, particularly for Hispanic students at HMIs.
Limitations and Future Directions
This study was conducted at an HMI to examine social comparison in a minority-majority context. For the ideal comparison, this study should be replicated at other institutions with a variety of demographic differences (e.g., Women Majority Institutions, Historically Black Colleges and Universities, Minority Serving Institutions with more varied demographics, etc.). For example, parental education level, SES, and high school academic performance are related to academic self-concept from the beginning to end of Latino/a students’ university experience (Cuellar, 2014). Additionally, the option for students to choose lateral comparison (i.e., not upward nor downward) was not provided as an option. This was intentional so that students were forced to choose how they ranked themselves in comparison to others; however, in real life situations, some students do fall at the 50th percentile and some students may feel they are of an average standing. Including lateral comparisons in future research could enhance understanding of social comparison. Moreover, our measure to assess social comparison included items that were created specifically for this study and therefore had not been validated previously. Some of the wording in the measure, including items that had “but I am similar to them in important ways,” may have been ambiguous to participants. Future studies should seek to validate these measures with students attending HMIs.
Additional nuance in how students identify culturally was not accounted for in the present study. The data presented in this paper are from students who indicated they identify as Hispanic/Latino; however, we did not assess the extent to which students identified as Hispanic nor the extent to which they felt acculturated, especially for students who immigrated to the United States. Given the complexity of racial and ethnic identity (Altschul et al., 2008), there is certainly room for nuance and further exploration on this aspect of social identity.
Moreover, the data in this report cannot support any causal explanations. This paper describes how students at an HMI compare themselves to others but does not provide explanations for why they hold these views nor what the short- and long-term effects are for viewing themselves in a particular way. Future research can further explore the motivations for these comparisons (e.g., a fear of failure, a sense of belonging, academic aspirations, etc.).
Conclusion
This paper described rates of social comparison for Hispanic students at a school where Hispanic students compose the majority of the student body. We found that these students typically see their peers as better off than themselves, although participants also tended to view their peers as similar to themselves in important ways. Additionally, downward identification appeared to be the most beneficial form of social comparison when it came to confidence in academic abilities, at least temporarily. However, benefits/harm from these comparisons need to be studied further to examine their effects in the long run. Some types of social comparison may benefit students, while others may be a disservice by limiting students’ perception of their potential. These topics warrant further exploration in order to best understand and serve students who come from traditionally underrepresented backgrounds in a changing academic landscape.
Footnotes
Acknowledgments
Thank you to the anonymous reviewers whose feedback helped to improve this manuscript. Additionally, the authors thank the staff and students at the university who helped make this project possible.
Author’s Note
We should note that the measures presented in this manuscript represent only variables of interest in this particular paper. These data are part of a large data collection effort based on a study funded by the National Science Foundation.
Declaration of Conflicting Interests
The author(s) declared no potential conflicts of interest with respect to the research, authorship, and/or publication of this article.
Funding
The author(s) disclosed receipt of the following financial support for the research, authorship, and/or publication of this article: Funding for this project was made possible by National Science Foundation Grant: 2222219.
Data Availability Statement
The data that support the findings of this study are available upon reasonable request from the corresponding author. The data are not publicly available because they contain information that could compromise the privacy of research participants.
Author Biographies